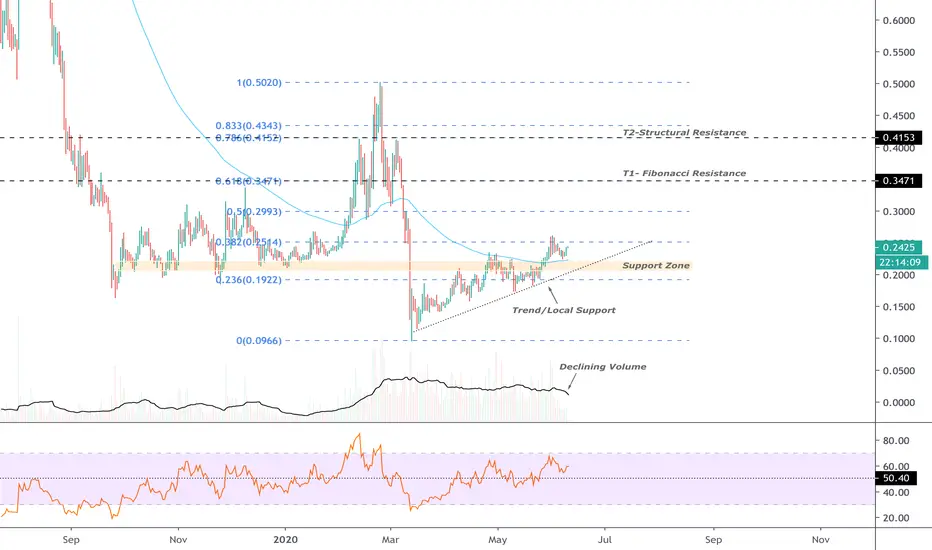
IOSTUSDT | S/R Flip | Volume Climax | .618 Fibonacci Todays analysis - IOSTUSDT – retracing after a strong breakthrough structural resistance.
Points to consider:
- S/R flip Re-test
- Support confluence
- 55 EMA – visual guide
- Volume climax
- Oscillators overextended
IOST is likely to retrace back to structural resistance after a bullish pattern break, S/R flip needs to hold for a valid long trade.
Structural support in confluence with .618 Fibonacci retracement further solidifies the true trade location.
IOST trading above the 55 Exponential Moving Average, acting as a visual guide, price must hold on retest to support the bullish bias.
Volume climax evident, indication of buyer exhaustion, temporary top may be in as price finds its equilibrium before another probable impulse move.
Both, the RSI and Stochastics trading in overextended conditions, a retrace in price will allow oscillators to cool off, creating space for further bullish momentum.
Overall, in my opinion, a long trade is validated on a successful S/R flip re-test.
What are your thoughts? Let me know in the comments below!
Be sure to leave a like and follow me for daily chart updates.
As always - focus on you, and the money will too!
Srflip


Potentially 14% / 7R upcoming S/R flip play- Resistance broken for 3rd time in short duration.
- Price sustaining above resistance now.
- Will long a retest of this S/R flip for a 7R play

#netflix - buy the dip Netflix has broken out of huge ascending triangle, it is one of those few stocks for which current #Covid-19 situation is good for business, with people locked inside only thing they have to do is "Netflix & Chill"
green range should act as good support now so buy close to it
there are bearish bearish Divs printing on weekly & monthly but I feel this will go Parabolic like Microsoft!

ALGOUSDT | Massive Volume | S/R Flip |Trade SetupAfternoon traders,
Todays analysis - ALGOUSD – Trading above the structural support zone projecting a healthy inclining trend
Points to consider:
- S/R flip retest must hold
- High overall volume
- Declining immediate volume
- RSI trading above 50 putting in lower highs
- Fibonacci and structural resistance technical targets
ALGOUSD recent S/R flip must respect local trend and consolidate above the structural support zone for a bullish continuation.
Overall trading volume has increased drastically adding legitimately in the price action, however, a decline of immediate volume is indicative of an influx being imminent.
RSI trading above 50 with a healthy higher low projection showing strength in the market.
Overall, in my opinion, ALGOUSDT needs to consolidate above the support zone and respect the local trend for a valid long trade to technical targets.
TLRAY INC |Bull Flag | S/R Flip | Clean Trade Setup Today’s Chart - TLRAY INC – Currently consolidating in a bull-flag formation above structural support.
Points to consider:
- Structural support retest (S/R Flip confirmation)
- Bull-flag formation
- Below average volume
- RSI trading above 50
TLRAYs S/R flip has been confirmed with a retest of structural support, the immediate target now structural resistance.
Volume nodes are below average, bulls need to see an influx out of the probable bull flag formation to support the bullish bias
RSI is above 50, showing reasonable strength in the current market
Overall, in my opinion, a bullish breakout is imminent. A long trade will be validated on a retest of the neckline (conservative entry) or a break of the bull flag (aggressive entry) as both technical targets align with structural resistance.
“When you smoke herb, it reveals you to yourself.” – Bob Marley

AIONBTC | Trend Change | S/R Flip Re-test | Trade SetupToday’s Chart – AIONBTC – Showing signs of a confirmed trend change, holding structural support will establish another higher low.
Points to consider:
- S/R flip at structural level
- Volume steadily declining
- Increased bull volume nodes
- Square-up at .5 Fibonacci resistance
- RSI bearish divergence
Currently trading above structural support, consolidating above this level further solidifying the S/R flip.
Increase in bull volume nodes is a healthy sign for the trend change and the evident decline in overall volume is an indication of an influx being imminent
AION’S technical target of .5 Fibonacci retracement is also in convergence with a square-up from a recent impulse move
The RSI has a valid bearish divergence, a sign that the local trend is weak and a retrace to structural support is likely with a probable confluence by the 100 EMA
Overall, in my opinion, a retrace to structural support validates a long trade to .5 Fibonacci resistance with defined risk below structural support.

CRLBF S/R Flip|Structural Support|Trend Change|Bull Volume NodesEvening Traders,
Today’s Analysis – CRLBF – showing signs of a confirmed trend change, holding structural support will establish another higher low.
Points to consider,
- S/R Flip at structural level
- Structural resistance (Immediate target)
- RSI Cooling off
- Stochastic in upper regions
- 21 Moving Average (Visual guide)
- Increasing bull volume nodes
The trend change on CRLBF has been confirmed with establishing its first higher low. Now trading above structural support, consolidation above this level will further solidify the S/R flip.
The 21 Moving Average can be utilized as a visual guide as CRLBF has been respecting it in the immediate up trend.
Current increasing bull volume nodes is a healthy sign for the trend change, must sustain with establishing another higher low.
The RSI is cooling off from oversold conditions, a retracement to the 50 level is probable if price starts to consolidate above support.
Stochastics on the other hand is in the upper regions, can remain trading here for an extended period of time with stored momentum.
Overall, in my opinion, CRLBF is in the midst of a trend change. Holding structural support is critical for a new higher low. A long trade is valid with defined risk below structural support.
What are your thoughts?
Please leave a like and comment,
And remember,
“A probabilistic mind-set pertaining to trading consists of five fundamental truths. 1. Anything can happen. 2. You don’t need to know what is going to happen next in order to make money. 3. There is a random distribution between wins and losses for any given set of variables that define an edge. 4. An edge is nothing more than an indication of a higher probability of one thing happening over another. 5. Every moment in the market is unique.”
― Mark Douglas

#USDTRY Shorts are strongerOn the long run, longs will definitely win.. But on short-term, I believe we have more downside..

#VET - Building a long position on retest i am gonna use a small balance my #IOST trade was awesome but was stopped on FAKE DOWN, gonna leave lose stop loss for this one
possible Triangle broken out with good volume, retest holds then long it!!!

VETUSDT Recovering From All-Time Low [BULLISH SCENARIO]Vet has struggled massively over the last few weeks. The general cash pull-out based on COVID-19 caused the price to drop to unseen lows. After the overall markets and BTC have recovered temporarily, I foresee a bullish scenario here on the 60m for VET based on technicals.
There have been two import horizontal areas here, for which both have S/R flips. The current horizontal resistance is important for VETUSDT. It seems that the bulls are attempting to break through this horizontal resistance, and I expect that after a small retracement the price will continue in an upwards trend. The old zone of resistance will act as a logical spot of support, which will push the price up from its all-time low.
Follow me for consistent high quality updates, with clear explanations and charts.
Please like this post to support me.
- Trading Guru
--------------------------------------------------------------
Disclaimer!
This post does not provide financial advice. It is for educational purposes only!
About the links below:
20% Discount on Binance: Did you know that Binance introduced a new system where you can get 20% discount on your fees? Find the step-by-step guide on how to add it to your account on the website of 100eyes
Forex & Crypto Scanner: Nobody can keep track of all the pairs on all timeframes. This scanner works on Telegram and sends an automated message including a chart every time something happens to a coin. E.g. it can automatically detect areas of support and resistance, RSI Divergences, Fib Retracements, and more.

BEAT- BEAST is about to be unleashed...Positional/swing tradeBEAT is your prototypical aggressive growth stock- Strong future growth potential with good earning and revenue track record ... If you can overlook its debt level.
This beast was tamed for a while after its share price skyrocketed from $25 to almost $80 , but it is ready to unleash its fury again.
But first, I think the pullback is in the store facing key resistance lvl in confluence with ichi and BB on the weekly timeframe.
In addition, short % of float is around 10%.
However, it is a bullish sign when price hovers below the key resistance lvl rather than experiencing outright price rejection.
My buy zone is between $45 to $55 for the positional trade. The long term trendline and S/R flip below this price range will act as a strong support.
Click the like button and follow me if you like my analysis :D


EURCHF Long SetupAfter price hit the 1.2 floor we have had a nice 3 waves down. We have exact equal legs into the 8H OB at around 1.07 and the bottom of the channel. Currently we have a LTF reversal pattern forming on the 15min TF. A break of the Head&Shoulders neckline will be my entry. Final target will be the SR-Flip level. This give around 24R


Best trading strategy for beginner!Basic charting skills for novice traders
Understanding Support and Resistance levels are a fundamental part of learning how to chart and trade.
It's the most basis concept but plays a tremendous role in technical analysis.
When one has a good understanding of support and resistance levels, he/she can start trading S/R flips.
Which is a relatively easy trading strategy. A S/R flip is when a Support level turns into a Resistance level and vice versa.
The first step is to learn how to identify key support and resitance levels. You'll get a hang of this fairly quick by practicing on Daily, 4H and hourly charts.
I would advice to stay away from lower timeframes in the beginning, due to the fact that it can be a little more tricky to identify clear levels there.
Once you get a hang of identifying support and resistance levels, try practicing with the trading strategy of trading S/R flips.
Select a chart, identify the relevant support and resistances that are close to the current price level and mark them with horizontal rays. (I have done this with the LTC/EUR chart for this idea).
For a select period (depending on which timeframe you selected; 1D, 4H, 1H), try monitoring the way the price reacts to the levels which you have drawn.
You might notice a certain patterns of the price breaking levels, and then re-testing them. This is called an S/R flip.
It shows that the previous resistance (which has been keeping the price from going up), has now turned into support (keeping the price from going down).
The same may apply for support levels turning into resistances.
How does one trade S/R flips?
In a bull market, traders can wait for price action to break through a previous resistance level.
If the price manages to break through the resistance and close above it, that indicates that the resistance has been broken and now functions as support.
Traders can enter a trade from the moment the candle closes above the resistance level, OR play it more safely and wait to enter on the retest of the broken resistance.
The trade is invalidated when there is a failed retest attempt where the price falls through the level.
However, do note that prices can always "wick" through a level, without actually closing below it (which is a clear sign to get out).
In a bear market, traders basically trade the same way only in a different direction.
Traders will wait for the price to fall through a support level and open a short when the candle closes below the support lvel OR wait for the price to retest the broken support level.
Off course, the information provided here is a bit short-sighted. It is definitely as "black and white" as i have described it here.
There are other things to consider, like volume in-or decreases. Or larger chart patterns which are directing the price action.
However, the tutorial provided here should help you get well on your way!
Please note i am doing this for educational pruposes and am still learning myself!
I am not a professional trader or financial adviser.


AGIBTC Bottomed out | Falling wedge extremely Bullishcheck daily chart below
AGIBTC is now at very important point from here it can go up so
The black line you see in chart is the horizontal breakout line
so where we are right now
-> we are above this line and 1 hour forms a bullish wedge so taking support on the line and if bounced it can go higher
see 1 day chart
see 4 hour chart
bounce expected from here it can pump very high don't miss this coin just because it's on support ( dead cat bounce doesn't matter but this can pump from here
Buy : 240 - 250
stop loss : 5%
target : 5 to 40%


POLY consolidating on top of prior resistance, might continue upPOLY/BTC is currently consolidating on a prior resistance zone around 2850-2900, and this level has been a pretty important pivot point in the past. If we can continue to hold this level as support, then POLY might look to move up to higher levels. Beware of Bitcoin though as it may be making a decisive move sooner rather than later. This is a high risk trade, so be cautious. Also, if anyone wants to get a free stock from Robinhood, feel free to sign up using my referral link below. They also offer feeless cryptocurrency trading on a select few coins if you're in an approved state. I'll put an article down below for those interested in Robinhood crypto. I also accept BTC donations if you guys are feeling generous! :)
Entry: 2850-2950 (Might need to wait for a pull-back.)
Target 1: 3250
Target 2: 3550
Target 3: 3900
Target 4: 4400
SL: 2800-2825 (Beware of wicks.)
Robinhood crypto article: support.robinhood.com
-This is not financial advice. Always do your own research and own due-diligence before investing and trading, as for investing and trading comes with high amounts of risk. I am not liable for any incurred losses or financial distress.

Dash long setup incoming?Dash looking pretty nice for a long trade in the near future, waiting for a test of previous resistance which should now be support.
Only issue I have is that it failed to gain above the previous pump so more risk is in play here so use correct risk management.
Setting orders from 20546 to 20250 for a swing

neo long ideaDuring today's dump, neo retraced to daily breakout level, and shows a good S/R flip on daily. If market goes down a more, i'll add second part on 1hr retrace, shown below.
targets and stoploss level shown on chart, manage your risk.

USDCAD short - Broke out of daily range and took out stops above.
- Sold off and came back in the range and retested the range high
- Broke key support
If support turns to resistance next target is the range low
