SRM/USDT - Potential 767% SetupHello Traders!
SRM has completed the previous cycle and enters accumulation. At the moment the price of the asset is in the trading range of $1.68 - $3.06
Falling trading volume and volatility are typical for the beginning of the accumulation phase of the asset. Good opportunities for medium and long term purchases are opened near the price levels of $1.68 and $0.95. It is better to gain positions in parts and evenly, starting from $1.68.
The profit taking targets will be price levels
$5.26
$6.80
$8.24
Good luck and watch out for the market
P.S. This is an educational analysis that shall not be considered financial advice
SRMUSD

SRMUSDpotential reaccumulation zone...
this would be in the case of fullbore 3ry bearmarket
still very on the cards looking at the market rn
but btc would have to break below the 30k range and start moving to low 20s so see how we go
btc is still 40k rn so this is not a confirmed scenario by anystretch imo

SRMUSDT: Trade 1H timeframeHi friends. The analysis by supply and demand. As seems that the chart in the correction trend and its stop at 2.70 and I expected growth to 3.810. So
SL: 2.568
TP: 3.810

SRM 1D BUYSRM 1D support is at ~$2.4
Enter 50% here
and try to set some buy orders near the support zone
If SRM holds above the trendline,
the Take-Profit target would be $3.3, $3.9, and $4.5
Cheers

$SRM Going for the R/S flip above ~3$$SRM
Going for the R/S flip above ~3$
Volume looking strong on the daily chart..
Would bet for continuation toward ~4$+
#SRM

#SRM is going to fix above the resistance zone 💥SRM is trying to break the trendline and EMA50
In case it close above i expect another bull run

Serum (SRM) • This lowcap is finally looking greatThis chart contains what i think to be the most important technical ranges as target zones where price can see serious pullback or trend reversals.
The current momentum and volumes is looking good. Be aware of possible pullback.
If it trade bellow the described entry zone i think is good to de-risk and wait until it regain the level OR i dips into the buy zone for better RR.
There was finally a break of major macro trend. However this doesn't mean we are heading straight to all time high.
The quarterly open around 7.5 is a very significant levels because is basically 50% of the whole trading range visible on higher timeframes.
This coin is a low-cap (above top #100) and backed/supported/endorsed by FTX so expect to have some cycle where it is likely to keep marking up.
We need to be on the watch out for possible reversals because the market in general due to macro environment still looking shaking.
Not financial advice. Educational and Entertainment purposes only.
If you are interested in access to D7 technical indicators please refer to the website link bellow
or feel free to check my free indicators in published-scripts section.

SRM#SRM
Sam is the director of the FTX exchange, hinting at the DEX exchange SERUM on Twitter.
On the technical side, if you look at the chart, the test should be $1.48 (fall correction).
You can buy on spot at a 3% deposit.
If we correct by $1.5, we will buy another 2%.
Target 2.7$

An attractive short-term ideaIf I am told to consider an idea for the medium term, srm is undoubtedly one of my options, because technically after a leading diagonal we are now in log a of a large correction, so there is a correction that is priced with log a We will have fit, so our goal in this currency is to ride on an upward correction
In the end, this is a personal analysis and there is no certainty as to whether or not to do it

SRM Longfrom historic view point. both price pattern and MACD shows sign that the selling pressure is over. Now we shall look into making a new ATH

SRMHi Dear traders, this is my opinion, and I think SRM will go for the targets that I have mentioned in the chart. You can use it for futures trading with a 20x leverage. Be sure to use stoploss exactly on 2.36592. I am going to open my position too. Good luck, and please do not get greedy!

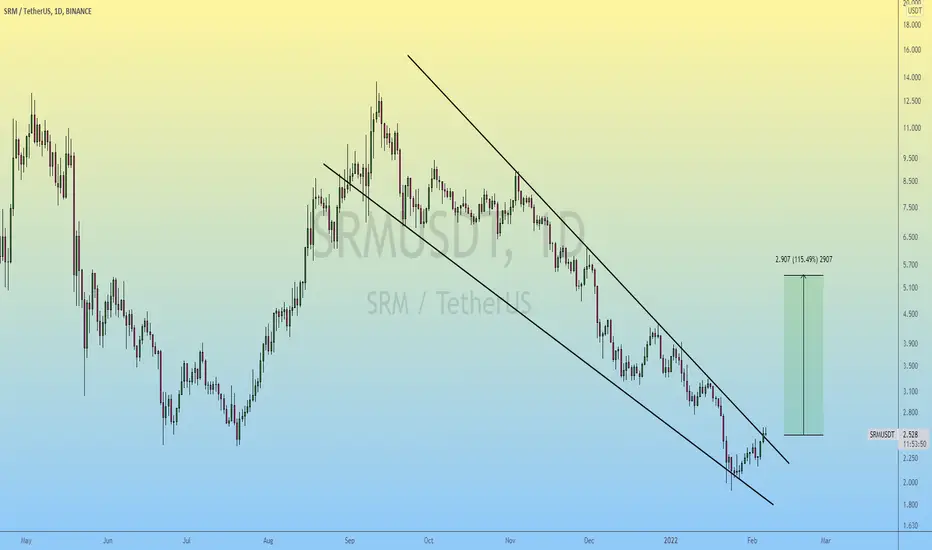
SRM | Falling Wedge Formation..!!
#SRM (Update)
Falling Wedge Formation along with Bullish Divergence in Daily timeframe.
Bulls need some Decent Volume for Breakout.
Looks Promising for Breakout so Keep an eye on it.
In Case of Breakout Expecting +100-120% Bullish Wave.
📍 Always Wait for Confirmed Breakout & Candle to Close and Only then ENTER..
Please like the idea for Support & Subscribe for More ideas like this and share your ideas and charts in Comments Section..!!
Thanks for Your Love & Support..!!
SRMUSDT, The price is coming in buy zoneGood Night everyone
Do you know about SRM?
SRM is one of the most popular exchange on solana ecosystem with many bonus for trading in and ...
If you want to learn fundamental & technical analysis ---> send us messages in private (Our id is in my profile)
According to the chart and previous analysis, the price exactly moved in downwards trend after it broke trendline, and at this time its coming through buy zone area, at there we expect the price can support can after some squeeze and consolidation in there its ready to move upwards.
We will update target very soon.
Good Luck
Abtin
Previous analysis :

An attractive idea (SRM)This is an analysis based on my visual strategy Not a fact...................

SRM: Near-Term PT $15Diagonal / wedge structure that has a remarkably similar shape & feel to May - July has a near-term target of $15... SRM just received a major investment ($75 Million) from Tiger Global. This is one of the largest Hedge Funds in the entire world with $95 Billion in Assets Under Management (AUM). The reason this is a big deal for the state of DeFi / Crypto is that this is one of the most mainstream investors in terms of views on crypto that we could have enter the crypto foray. This is just as big as Dalio who has so far only dabbled his toes into the crypto space. A $75 million investment in the Serum Protocol is not just a mere dipping of toes but a full on swan dive into the pool. Most VC backed ventures only raise $1-3 million dollars in total. This shows the extreme confidence from one of the smartest minds in the world. Believe me, Tiger has a field of analysts that are 10x smarter than the rest of us, and they are going with the narrative of investing in geniuses like Sam Bankman-Fried who is the mind behind SRM and the Serum Protocol that on the surface appears to only be a DeFi trading project in reality is MUCH bigger than just DeFi. The entire ecosystem has many different projects using the Serum Protocol as its central engine. SRM is built using the Solana Protocol which currently boasts 65k TPS.
In my view Serum will overtake all DEXs (with their bloated fee structure and much slower finality in trading) on ETH protocols... which at last view if we just add up the market caps of the top 3 (Pancake, Sushi, and UNI), we get nearly $15 billion in market cap. Knowing that SRM is at 65k TPS and is scaling to 1 million TPS and 1 billion users and has major minds like SBF and Tiger Global behind it - I fully expect to see SRM dominate the DEX space in 2022 and garner 80% market share of all DEXs... let's just say that all DEXs today have a value of $40 - $50 billion. At 80% that means SRM could rise to $32 - $40 Billion Market Cap in 2022.
At the current market cap of $400 million that means a price of approximately $30. Uniswap reached a market cap of $22 Billion USD at its height but remember, this was on the ERC-20 protocol which is bloated, slow, and VERY expensive per trade. SRM is essentially free to trade, extremely fast, and is scaling to 1 million TPS in 2022. We could easily see a $40 Billion valuation in 2022 in my view and a PT of $30 in intermediate term.

SRM (Serum) Coin Analysis 29/03/2021Fundamentals:
Serum is a decentralized exchange (DEX) and an ecosystem that brings high speed and low transaction costs to decentralized finance (DeFi). It is permissionless and is built on the Solana blockchain.
Serum was created to eliminate the vulnerabilities in the current DeFi space that exist due to incomplete decentralization. It is claimed to be fully decentralized and runs on a non-custodial exchange with cross-chain trading support and no know your customer (KYC) requirements.
Solana is a web-scale blockchain that can reach 50,000 transactions per second. This is achieved through a verifiable delay function, known as SHA 265 hash chain, that enables optimistic concurrency control.
Serum is developed by the Serum Foundation, which is backed by a group of experts in cryptocurrency, trading and decentralized finance. The project also has backing from a wide number of firms.
The SRM is a utility token used on the Serum ecosystem. Its cross-chain swap protocol allows users to exchange assets between blockchains in a trustless manner.
Serum offers a decentralized automated full limit order book that provides traders with full control over each order. The full Ethereum and Solana integration makes Serum faster and more efficient while also allowing it to be interoperable with ERC20 tokens.
The physically settled cross-chain contracts allow easy margin positions in DeFi on synthetic assets. SerumBTC is a model for creating ERC20- or Solana-based tokens for Bitcoin (BTC) and SerumUSD is a model for creating a decentralized USD-pegged stablecoin.
Staking rewards are distributed on the basis of the nodes’ performance, which takes into account important on-chain actions, such as supplying blockchain histories for cross-chain settlement validation.
Users can also stake towards another node. A portion of a node’s staking fees goes to the leader and all nodes receive staking results. These rewards increase through productive participation in node duties.
SRM is Serum’s governance token that is based on the Solana blockchain and has an ERC20 version. It has cross-chain support that enables the trustless exchange of assets between different blockchains. Serum uses a trustless bridge through a premier validator for distributed ledger technology (DLT).
Serum was co-founded by Sam Bankman-Fried. He is also the CEO of the FTX cryptocurrency derivatives exchange and a co-founder of the Alameda Research quantitative trading firm. Bankman-Fried also used to work as the director of development for The Centre for Effective Altruism and as a trader at Jane Street.
Bankman-Fried graduated from the Massachusetts Institute of Technology with a bachelor’s degree in physics.
Technical Analysis:
the price has done its accumulation and now retracing after an impulsive wave, which is a good sign of Bullish trend
there total of 3 Targets Specified where as the 3 TP gets Confirmed as the 2 TP gets Triggered followed by some price correction

SRM Elliott Wave - $71 by May, $300 by 2023SRM is setting up for a beautiful 5 Wave Structure - see the red count - we are currently at beginning of Wave 3.

LONG SRM/USDTAdding exposure to SRM through raydium swap.
SRM will be a great long term position and we are at extremely great prices to get in for the ride.

SRMUSDT, Exactly movement to our pathHello everybody
SRM is one the most powerful project that is working on ... ecosystem :D
According to our last analysis of SRM after the price broke the trendline support, we shown on that chart that the price should drop more and after that its ready to have pullback to the trendline and we shown you the path that the price can go and reach
Exactly the drop is completed and according to the price that is ranging and the power of candle, the price want to move upwards to make and complete the pullback
You can buy and take long position but becareful and dont forget use stop loss because the market trend is downward and we need to take position toward the trend
Until now we should wait and watch after the pullback what will happen then we can decide what to do
Previous analysis :
Good Luck
Abtin

SRMUSDT , We need more correctionHello everybody
If you need any help just as us and send us messages in private
According to the chart you can see the price broke the support zone of trendline and because of that we expect the price can dump more and make our movement and route become true.
In there zone , according to the price its worthy to buy step by step.
Target will be update in future.
Good Luck
Abtin


SRM READY FOR REVERSAL! BUY HERE...SRM has been in the downtrend for so long now, however, it seems like SRM is ready for a recovery from here, but SRM and ride it for the next trend if we reverse it.
Buy zone is marked, buy it from $5 - $4.5 and wait patiently, SL below $3.75 so far..
If you liked it give it a thumbs up!

srmusdtSRM is in the cheap zone. (fibo 0.705-0786). and there are in this zone undecision candle,imbalance candle and untested order block. perfect area for long. R:R ratio is 11.15
PS: Not an a financial advise. only idea.
