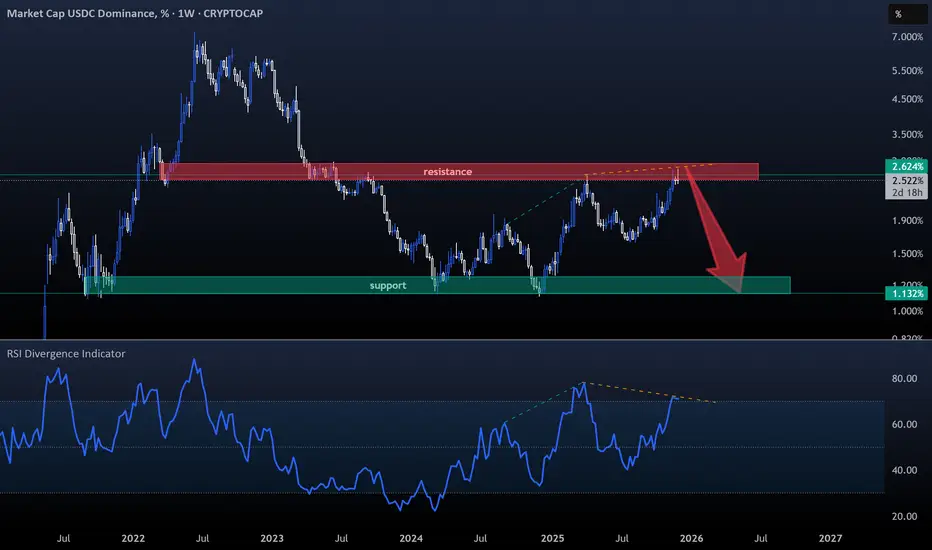
USDC DOM- I haven’t covered Circle’s stablecoin recently. Tether's USDT remains the clear leader at 6% Dom, but with USDC rising back to 2.5% Dom, it’s definitely worth watching again.
- The chart is simple, focus on the Weekly RSI and you’ll see a clear divergence developing on the weekly timeframe.
- So just keep an eye on USDC’s support around 1.1% (green zone) and it's resistance near 2.8% (red zone).
One Simple Rule : Stablecoins down = Bitcoin up.
Happy Tr4Ding !
Stablecoindominance
FireHoseReel | USDT.D : The Next Major Crypto Wave Is Starting🔥 Welcome to FireHoseReel!
Let’s dive into the USDT Dominance (USDT.D) market structure.
👀 USDT.D – 4H Overview
After a strong bullish rally, USDT Dominance has fully retraced its entire move and is now losing a key support zone. This is one of those levels you shouldn’t pass without a position — it’s a critical decision area.
🧮 RSI Analysis
The USDT Dominance RSI has formed an oversold zone around the 33 level. A breakdown and sustained move below this zone could trigger mass USDT selling and strong buying pressure in Bitcoin and altcoins.
✍️ Current Scenario for USDT Dominance (Simple Setup)
🟢 Long Scenario for the Crypto Market:
A clear break and candle close below 5.934%, ideally accompanied by RSI breaking below the 33 level, would confirm momentum. In that case, the move is expected to accelerate, and we’ll likely spend less time inside the position due to high volatility.
❤️ Risk Management & Emotional Discipline
Crypto trading is highly risky. Without proper risk management and emotional control, trading becomes no different from gambling.
Logic must always come before emotions. Learn to manage your trades and enjoy the process with control and discipline.

USDT.D: Smart Money Indicator for Bitcoin & Altcoin CyclesUSDT.D Dominance: The Hidden Cycle Behind Crypto Bull & Bear Markets (2021–2026)
The USDT.D dominance chart offers a clear window into the underlying market sentiment: when stablecoin dominance rises, the market tends to weaken, and when it falls, risk-on assets thrive.
From late 2021 , USDT.D saw a steady rise, signaling capital flowing out of risk assets . This climaxed in late 2022 , aligning with Bitcoin’s historic drop from $69k to $15k (~-74%).
Following this, USDT.D entered a downtrend and consolidated for over a year, a period that coincided with multiple altcoin bull runs , highlighting the inverse relationship between USDT.D and alt markets.
Recent months have shown breakout dynamics , as USDT.D reclaimed its long-term downtrend resistance. The market now faces a crucial retest around 5–5.1% , which could act as a springboard for the next major rally.
🔹 Market Implications:
Short-term: Bitcoin & Ethereum likely to see significant upward momentum during early 2026.
Mid-term: USDT.D may form a Bullish Cup & Handle , targeting 8–9% by late 2026 , signaling potential market corrections.
Key takeaway: Stablecoin dominance is a leading indicator —tracking its patterns can provide insight into market cycles, risk periods, and optimal entry/exit windows.
💡 Pro Tip: Always combine dominance analysis with price action and volume for better timing in crypto markets.

CRYPTO GOES 'TETHERED & CIRCLED' AMID THE PERDITION OF BTC BULLSThe recent 'Tethering and Circling' of crypto assets amid the downturn of Bitcoin (BTC) bulls can be explained by several interconnected factors rooted in market dynamics, investor behavior, and regulatory pressures.
As BTC bulls face setbacks in sustaining their upward momentum in 2025, the crypto market as a whole tends to become more tethered and circled around stablecoins like Tether (USDT) and Circle's USD Coin (USDC).
This shift is due to the need for stability, liquidity, and risk mitigation in an environment of uncertainty.
Role of Stablecoins Amid BTC Bear Pressure
Stablecoins like Tether and Circle have become dominant anchors in the crypto ecosystem, controlling over 80% of the global stablecoin market capitalization. Their foundational role is to provide a stable medium of exchange and store of value pegged to fiat currencies, predominantly the US dollar. As Bitcoin bulls lose steam and volatility spikes, investors and traders increasingly move their capital into these stablecoins to avoid the sudden price swings of BTC and altcoins. This creates a "tethering" effect where a large portion of liquidity is parked in stablecoins, allowing market participants to quickly enter or exit positions while minimizing exposure to risk. Stablecoins thereby act as a safe haven within the crypto market during periods of bearish sentiment or market correction.
Market Sentiment and BTC Cycle Influences
The 2025 Bitcoin cycle differs significantly from previous bull runs seen in 2021. Analysts suggest the true peak of Bitcoin’s cycle was back in April 2021, and since then the market has entered a phase characterized by cautious consolidation rather than explosive growth. Key macroeconomic indicators such as inflation trends, Federal Reserve rate policies, and quantitative tightening play substantial roles in shaping this slower, more measured market behavior. With BTC showing signs of a shallow bear phase and mixed momentum, investors' confidence is dented, pushing them towards safer crypto assets like stablecoins and highly liquid tokens.
Increased Regulatory and Competitive Pressures
The crypto market environment in 2025 is also shaped by growing regulatory scrutiny, especially around stablecoins themselves. Regulations in regions such as the EU have introduced frameworks like MiCA, impacting how stablecoin issuers operate. Tether, for instance, has responded cautiously to some regulatory moves, even choosing not to comply with certain restrictive regulations, leading to delisting from some centralized exchanges and challenges in maintaining its dominance.
Meanwhile, Circle’s USDC has been slightly less affected due to wider regulatory acceptance but still faces limitations on certain yield-generating activities. These regulatory pressures influence market dynamics, prompting crypto participants to actively circle around the most trusted and compliant stablecoin options to secure their holdings.
Market Dynamics of Crypto Herd Behavior
Moreover, cryptocurrencies tend to move together due to their correlated trading patterns. Large market movements in BTC often trigger cascading effects in altcoins and other digital assets. When BTC bulls falter, a wave of stop-loss liquidations occurs, leading traders to sell off altcoins and consolidate holdings into stablecoins or less volatile crypto instruments. This communal movement is amplified by the relatively smaller market caps of altcoins compared to BTC and the 24/7 nature of crypto trading, intensifying the tethering phenomenon as market participants seek to safeguard their assets and maintain liquidity.
Technical challenge
The main technical chart is a sum of USDT and USDC dominance; they both in nowadays represent more then 80 percent of all stablecoins market cap.
Long term upside trend is still looks robust, with a potential of Bull extension due to 200-week simple moving average brekthrough.
In summary, the crypto market's increasing tethering and circling around stablecoins amid the recent bearish phase of BTC bulls in 2025 is mainly due to the need for stability during heightened volatility, the maturation and changing cycle of Bitcoin, regulatory developments around stablecoins, and the inherent herd behavior in crypto trading. This dynamic ensures that stablecoins remain central hubs in the crypto economy as investors navigate uncertain market conditions.

FireHoseReel | USDT.D 4H Analysis🔥 Welcome FireHoseReel !
Let’s jump into the Tether Dominance Analysis , one of the most Popular Crypto Index .
👀 USDT Dominance – 4H Timeframe
USDT dominance has reached a major resistance level after a very strong upward rally. At this point, I personally have a bearish bias, expecting a rejection and the completion of a multi-timeframe secondary trend. This view is also supported by my mentor, Arshia Azizpour.
📉 RSI Analysis
Since volume isn’t very reliable on dominance charts, we use the RSI oscillator instead.
RSI has just rejected from the 81 zone, which is a strong static resistance inside the overbought area.
This rejection suggests potential cooldown, pullback, or loss of momentum.
📌 Key Levels to Watch
USDT dominance currently has three major levels:
🔺 6.623% – major top resistance
🔸 6.427% – multi-timeframe trend-shift zone
🔸 6.148% – secondary multi-timeframe trend-shift zone
A clean break and candle close below these levels can give us a bearish bias on dominance, which naturally creates a bullish bias for crypto assets.
⚠️ Important Note
USDT dominance still has strong trend momentum.
If it breaks above the current top, it could trigger another wave of downward pressure on Bitcoin and altcoins.
Historically, these dominance spikes hit BTC and ETH the hardest, while altcoins don’t always fall as aggressively.
🛞 Risk Management & Disclaimer
Please remember to always use proper risk management and position sizing. Nothing in this analysis is financial advice. The market can change quickly, so always trade based on your own strategy, research, and risk tolerance. You are fully responsible for your own trades.

Can USDT.D break its high ? | USDT.D 4H Analysis🥳 Hey everyone! Hope you’re doing great! Welcome to SatoshiFrame channel .
✨ Today we’re diving into the 4-Hour Ethereum analysis. Stay tuned and follow along!
💵 Can USDT.D break its high & cause crypto drop again ? Tether Dominance is hovering near the 5% zone after the Trump tariff rumors — a key resistance that perfectly aligns with the crypto market’s bottom. A breakout here could trigger another leg down across altcoins.
👀 4-hour timeframe of Tether Dominance and we can see that after breaking the 4.6% area, it gave us a confirmation for an uptrend, and in this area, it also formed a higher low compared to its previous low. It easily broke through several resistance levels and reached its top at the 5.16% area, where it is now rejected. Since we are in the holiday period, we have faced weak downward momentum, and now several breakout triggers have formed on the Tether dominance chart which, with Tether volume passing through these areas, the market can start its next move. Note that this top that has currently formed is the same as the bottom of the altcoins that we see on various charts, so breaking this top will not be easy.
🧮 The RSI oscillator can be a great help to us in this analysis, as it allows us to better identify the tops and bottoms of Tether dominance. If the oscillation passes through those desired areas, we can take positions on coins contrary to the direct supply and demand of the chart itself. The 74 oscillation zone is slightly above the overbought boundary, and crossing this area can increase the oscillation volume of Tether buy trades and cause the crypto market to lose its bottom. The next important area is the 50 zone, where a reaction to this area or passing the oscillation limit from this area can form a lower top for Tether dominance and then give us confirmation to start a bullish leg in the market.
🕯 The size of the Tether dominance candles during the rise was significantly smaller but closed with more strength, while during reactions and pullbacks, the size and number of candles increased, which informs us of the weakness of the Tether sellers' trend. A noteworthy point for Tether dominance is the rejection it received from the top and then moved downward, facing weak upward momentum. If the market bottom is in this area and the Tether dominance top is also in this area and this top does not break, the market can soon tend toward a trend change and a drop in dominance may occur.
❤️ Disclaimer : This analysis is purely based on my personal opinion and I only trade if the stated triggers are activated .

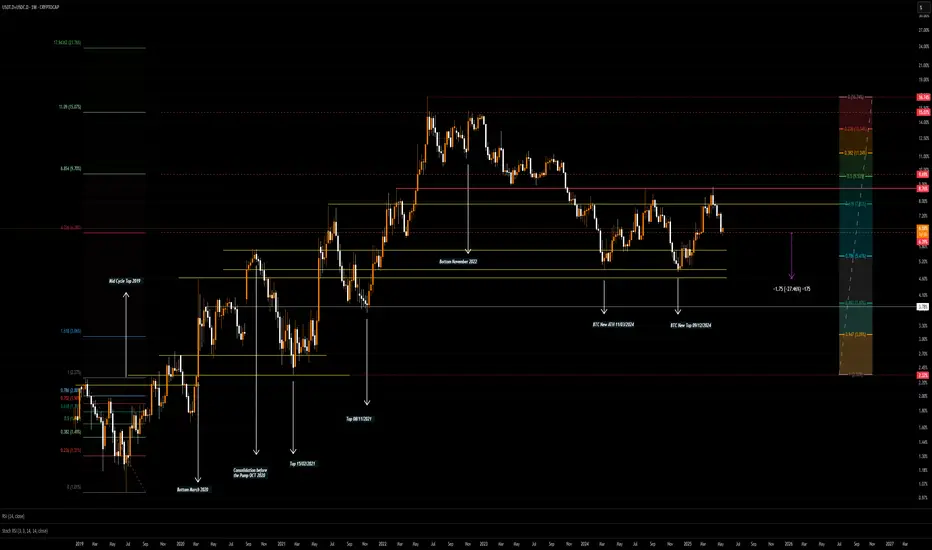
Finding BTC Top by Stable coin dominaceI think the next leg could be the final push of BTC in this cycle. However, it seems every time the Dominance of stable coins (in this case USDT+USDC) is dropping to certain point in larger timeframe can be relative to find the next top.
I think at least we can come back to 4.92% which it has been touched numerous time in this cycle such as 11/03/2024 and 09/12/2024.
It has the potential to fall a bit further to 4.64% or even 3.87 to 3.67% as well/
USDT.D 1H Analysis - Key Triggers Ahead❄️ Welcome to the cryptos winter , I hope you’ve started your day well.
⏰ We’re analyzing CRYPTOCAP:USDT.D on the 1-Hour timeframe .
👀 On the 1-hour timeframe, Tether Dominance moved upward after breaking above the 4.46% level. However, buyers were unable to push through the 4.72% resistance, and the market reacted (rejected) at that zone. This reaction formed a multi-timeframe consolidation box. The top and bottom of this box now act as key levels to determine the next market direction:
Break above 4.72% ➝ Potential for deeper correction in the crypto market.
Break below 4.46% ➝ Possible trend reversal and confirmation of renewed upside momentum.
The market is currently in a low-volume weekend phase, and price action is range-bound. With the start of the new week, there’s a higher probability of breaking out of this consolidation.
🧮 The RSI oscillator shows that after reaching the overbuy zone, price couldn’t sustain time there and was quickly rejected, forming the current market floor. Another key RSI level is around 44, which aligns with the 4.46% support. If momentum crosses below this zone, volatility could increase and trigger the next leg of movement.
🕯 On the 1-hour chart, there have been numerous green candles, indicating a deeper market correction as earlier buyers take profit and sell. This move continued until the 4.72% resistance, and the current range structure shows:
Red candles slightly larger
Green candles more frequent but smaller
This signals weakening bullish momentum, increasing the likelihood of a break below the 4.46% support.
🧠 With the current sideways structure, two main scenarios are in play:
1️⃣ Breakdown of the lower boundary (4.46%)
Could trigger a strong bullish leg in crypto, pushing the market upward.
If this happens, it could be an ideal scenario, supporting a broader crypto rally.
2️⃣ Breakout above the upper boundary (4.72%)
Would likely lead to a deeper correction across the market.
This scenario could result in significant drops in Bitcoin and Ethereum.
Keep both the ceiling and floor of Tether Dominance in mind as the new week begins. The current range is relatively narrow, meaning a breakout could even occur as early as tomorrow during the New York session.
❤️ Disclaimer : This analysis is purely based on my personal opinion and I only trade if the stated triggers are activated .

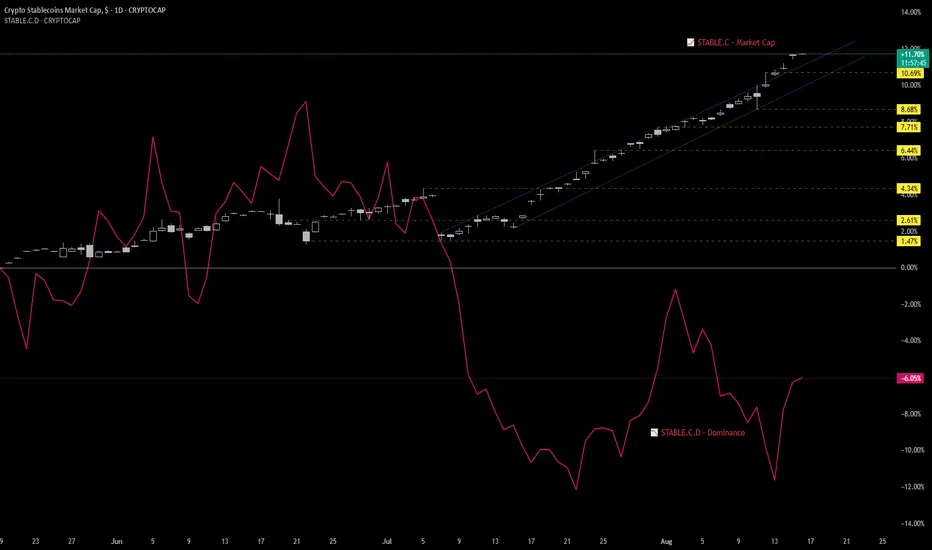
Stablecoins as the New Macro Liquidity ProxyFor years, macro liquidity in crypto was gauged through broad monetary metrics like M2 or Total Market Cap. But those days are fading.
With the rise of regulated stablecoins—and new TradingView tickers like CRYPTOCAP:STABLE.C (Stablecoin Market Cap) and CRYPTOCAP:STABLE.C.D (Stablecoin Dominance)—we now have real-time, on-chain liquidity metrics that better reflect how institutional and retail capital enters the crypto ecosystem.
🔑 Why These Tickers Matter
• STABLE.C = Capital injection.
→ Tracks aggregate growth of major stablecoins, serving as a proxy for dry powder entering the system.
• STABLE.C.D = Sentiment signal.
→ Measures stablecoin dominance relative to the crypto market.
→ Rising dominance = risk-off (capital parked).
→ Falling dominance = risk-on (capital deploying).
Together, they offer a macro lens on risk appetite and capital inflow , updated in real-time—something no traditional metric can match.
🔍 How We Use Them
These metrics are now integrated into our Crypto Macro Cockpit , where:
• Stablecoin cap growth signals liquidity expansion or contraction
• Dominance slope helps identify regime shifts (risk-on vs risk-off)
We're beginning to see consistent patterns:
➤ Surges in STABLE.C precede market rallies
➤ Spikes in STABLE.C.D often align with rotation tops or periods of caution
📎 Implication
Stablecoins are no longer just trading tools—they’re macro indicators.
If ETFs are the Trojan horse for institutional entry, stablecoins are the bloodstream.
As we transition into a new cycle, these tickers might become the most important charts you’re not watching.
💬 Would love to hear from others—are you using STABLE.C or STABLE.C.D in your analysis? What signals are you seeing?
Stablecoin Dominance vs Altcoins – Final Altseason Loading?This chart visualises a powerful relationship — stablecoin dominance (USDT.D + USDC.D) versus OTHERS dominance (i.e. altcoins excluding BTC and ETH).
Put simply:
When this chart moves down, stablecoins are flowing into altcoins — risk-on behavior, altseason ignites.
When it moves up, capital rotates back into stables — risk-off behavior, weakness across alts.
This has nailed every major altseason impulse and correction cycle over the past few years.
Right now, we’re seeing this pair push higher into a key supply zone — the same distribution range it previously broke down from. My expectation is a retest of that breakdown zone, which should align with a short-term correction in the altcoin market.
📉 Once this retest plays out and we see signs of weakness at supply, I anticipate continuation bearish in this pair — leading to stablecoins flowing back into altcoins.
That next leg down into higher time frame demand could mark the final altseason push, before the broader market tops out. If we follow the usual cycle pattern, that last alt impulse will likely drag retail back in for the top — just before distribution takes over and the bear phase begins.
🧠 In short:
Push into supply → altcoin correction
Breakdown → capital rotation back into alts
Final altseason + market top → bottoming of this chart + reversal bullish
This will be a key chart I’ll track closely over the next few months — it offers one of the cleanest reads on altcoin liquidity flow and timing for top formation.
1W:

USDT.D Update: Range Reversal in Play?Initially in my last update, I was expecting USDT.D to push into daily supply levels after taking the swing low from the prior daily higher low — pulling back into supply before continuing lower after the market structure break.
Instead, it pushed even deeper, taking out the range low swing at 4.56%, which allowed BTC to break higher and tag its ATH by taking major upside liquidity.
Since then, we’ve seen a cool-off from those levels. Supply has come in across majors (notably TOTAL), and I’ve been tracking the local range forming in USDT.D — forecasting a reversal back into supply. That reversal is now starting to show itself, with USDT.D rising as BTC and alts pull back.
I'm currently watching for a push into the 5.0% – 5.6% supply zone, which I believe could mark the next major pivot point for the market.
From there, I’ll be looking for weakness or signs of rejection in USDT.D — which would align with BTC and the broader market setting up for another leg higher.
Once this supply is hit and the move starts rolling over, I expect USDT.D to begin its final phase down toward 3.73% — a key HTF demand and bullish reversal level. That would mark a major shift, coinciding with what I believe will be the macro market top forming across risk assets.
This level will be one I’m watching closely for DCA entries and scaling back into exposure — the reversal in USDT dominance from that zone should align with the last stage of the current cycle before distribution takes over.
1D:
3D:
1W:
3M:

ETH Bottomed last week!This chart illustrates the ratio of the market capitalization of the top three stablecoins and that of Ethereum (ETH).
The correlation is quite evident, as anticipated.
We are likely approaching a phase where these stablecoins will be deployed, with Ethereum being a key beneficiary, signalling that we are entering a period of increased risk appetite and overall market buoyancy.
#ALTS
#USDT
#USDC
#DAI
#ETH

A wonderful ALTCOIN Bullrunis all set in motion.
If my chart resonates with you in any way.
The combined dominance charts of the big four.
#BTC.d
#ETH.d
#USDC.d
#USDT.d
We are on our way to my anticipated target zone.

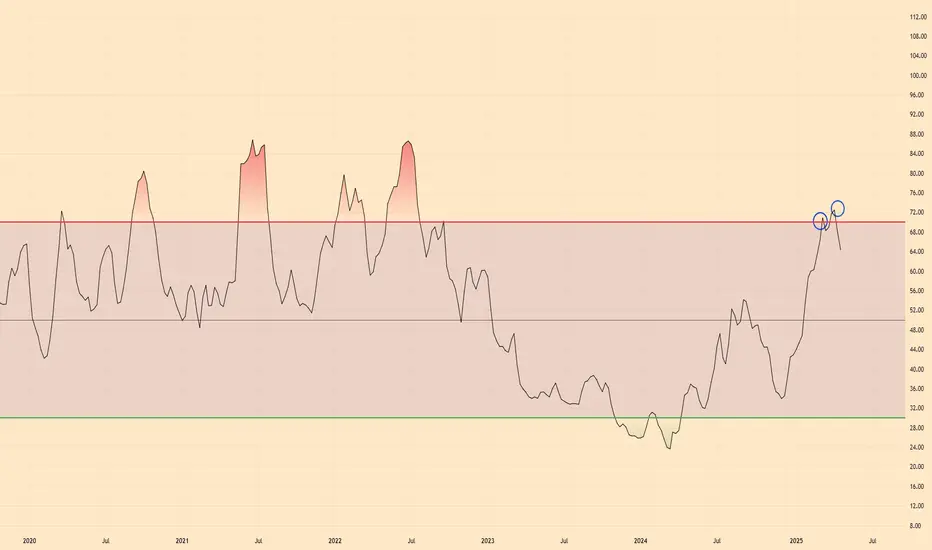
$USDC | Altseason Incoming.....FinallyCRYPTOCAP:USDC Dominance looks to be Double Topped on the RSI side and per historic movements, this looks promising for the market.
I say, BRING ON THE ALTCOINS.
USDT.D Bearish Reversal Incoming Into a New Bullish Phase in BTCUSDT.D Update:
Its been a while since my last USDT.D update on here since i accurately forecasted and called the top in September last year from its last distribution range. Since then, Ive been expecting USDT.D and USDC.D to continue higher into deeper premiums and into monthly and 3M supply areas, taking further BSL in the process and coming into the HTF downtrend channel high, whilst the rest of the market continued bearish after the first moves from last year.
Both have done just that, pushing higher to extreme supply and heavy premium pricing. USDT.D has topped out with high volume as it come into refined extreme daily supply from the UT event in the prior distribution range, whilst taking the LQ at the 5.93% level i discussed in the market update videos. This is effectively following last points of supply from one distribution range to the next, following HTF bearish orderflow and HTF bearish structure in stablecoin dominance pairs. From the recent UTAD event we have seen bearish breakdowns on the daily timeframe on both USDT.D and and USDC.D, marking a turn in the market where things should start to get more interesting! Im looking for this again but on the weekly timeframe and monitoring for a HTF weekly close below the weekly HL, therefore putting in a LL on the weekly to give further HTF confirmations of the reversal from this area.
Whats interesting at this point is the last couple days of data on both USDT.D and USDC.D and the range conditions we are now creating.
For me, it looks pretty similar to the last top, where we created a distribution range in HTF supply after taking extreme key levels and LQ, putting the market in extreme fear, before slowly flipping bearish in the range before a full blown reversal and breakdown to the 3.73% level.
Im expecting a bounce of some degree over the next week or so in USDT.D back into the 5.57% region where the range high sits alongside some daily and refined 12H supply zones from the UTAD event. Im looking for a push into supply forming a LPSY last point of supply in phase D, before continuing HTF bearish to target SSL on the lows of this upward trend channel with my main targets between 3.73% and 3.12%. This aligns with what im seeing in BTC as posted today on TradingView and the market, expecting a pullback to demand respectively before continued upside.
I don't for see this taking the highs again above 6.24%. There is a lot of resistance and supply in this range now we have broke down and its likely we are seeing the formation of the reversal taking shape in due course.
As ive stated i the most recent BTC analysis, this is a risk on situation in my opinion and i will be allocating capital to spot bags as USDT.D hits its supply levels in the range highs and as BTC comes into the daily demand levels im monitoring between $84,000 - $76,500, buying the dip whilst expecting further upside and a HL to form in BTC and new LHs in stablecoin dominance pairs.
To finish, look at this chart on the daily, 2D, 3D, 4D, 5D, 1W, 2W, 3W charts and really look at the HTF closes on these candles at these highs. Theres been no HTF bullish closes above HTF supply or significant highs. Price has failed to put in new higher highs and is merely sweeping highs now with high volume rejections, volume dropping off, all whilst looking like a top imo with HTF weekly rejections all the way up to the monthly candle.
1D:
3D:https://www.tradingview.com/x/XtxjrvGR/
1W:
1M:

USDC Leads Stablecoin Market Cap Growth in 2024, Surpassing USDT
The year 2024 witnessed a significant shift in the stablecoin landscape, with Circle's USD Coin (USDC) demonstrating a remarkable resurgence and outperforming its main competitor, Tether's USDT, in terms of market capitalization growth. This surge marks a significant milestone for USDC, which had faced a considerable setback in 2023 following the collapse of Silicon Valley Bank (SVB). This article delves into the factors contributing to USDC's impressive recovery and its implications for the broader stablecoin market.
USDC's Rocky Road to Recovery
USDC's journey in recent years has been a rollercoaster ride. In 2023, the stablecoin experienced a substantial downturn, with its market cap plummeting by 45%. This decline was largely attributed to the collapse of SVB, where Circle had a portion of its reserves held. The bank's failure triggered a crisis of confidence in USDC, leading to significant withdrawals and a temporary de-pegging from the US dollar. This event cast a shadow over USDC's future and raised concerns about the stability of stablecoins in general.
However, USDC's performance in 2024 tells a different story. The stablecoin not only recovered from the SVB-induced slump but also surpassed USDT in market cap growth. This remarkable turnaround underscores USDC's resilience and the growing trust in its underlying mechanisms.
Factors Driving USDC's Growth
Several factors have contributed to USDC's impressive growth in 2024:
1. Increased Regulatory Clarity: The evolving regulatory landscape surrounding stablecoins has been crucial in USDC's resurgence. As governments worldwide are increasingly focusing on establishing clear frameworks for stablecoin operations, USDC's commitment to transparency and compliance has resonated with investors and users. This regulatory clarity has fostered a more favorable environment for USDC, attracting both institutional and retail adoption.
2. Focus on Trust and Transparency: Circle has prioritized building trust and transparency in its operations. The company regularly publishes attestations of its reserves, providing assurance to users that USDC is fully backed by traditional assets. This commitment to transparency has been instrumental in restoring confidence in USDC following the SVB crisis.
3. Expansion of Blockchain Infrastructure: The continuous development and expansion of blockchain infrastructure have also contributed to USDC's growth. As more blockchain networks integrate USDC, its utility and accessibility increase, driving adoption and market capitalization.
4. Growing Institutional Adoption: USDC has witnessed increasing adoption among institutional investors. These investors are drawn to USDC's stability, transparency, and regulatory compliance, making it a preferred choice for various use cases, including trading, lending, and payments.
5. Market Demand for Diversification: The stablecoin market has been increasingly seeking diversification beyond USDT. Concerns about the composition of Tether's reserves and its lack of transparency have led investors to explore alternative stablecoins. USDC, with its focus on transparency and regulatory compliance, has emerged as a leading beneficiary of this trend.
USDC vs. USDT: A Closer Look
USDC and USDT are the two dominant stablecoins in the market, but they differ significantly in their approach and underlying mechanisms.
• Transparency and Audits: USDC has been lauded for its transparency, with regular audits and attestations of its reserves. In contrast, Tether has faced criticism for its lack of transparency and the composition of its reserves.
• Regulatory Compliance: Circle has actively engaged with regulators and prioritized compliance, while Tether has faced regulatory scrutiny in various jurisdictions.
• Market Capitalization: While USDT still holds the largest market share, USDC has been steadily closing the gap, driven by its strong growth in 2024.
Implications for the Stablecoin Market
USDC's surge has significant implications for the broader stablecoin market:
• Increased Competition: USDC's growth has intensified competition in the stablecoin market, challenging USDT's dominance. This competition is healthy for the market, driving innovation and improving standards.
• Focus on Transparency and Compliance: USDC's success has reinforced the importance of transparency and regulatory compliance in the stablecoin industry. This trend is likely to continue, with stablecoin issuers prioritizing these aspects to gain trust and adoption.
• Growing Institutional Interest: The increasing institutional adoption of USDC signals a growing acceptance of stablecoins as a legitimate asset class. This trend is likely to attract more institutional investors to the stablecoin market, further driving its growth.
Conclusion
Circle's USDC has demonstrated a remarkable recovery and growth in 2024, outperforming Tether's USDT in market cap surge. This resurgence can be attributed to several factors, including increased regulatory clarity, a focus on trust and transparency, expansion of blockchain infrastructure, growing institutional adoption, and market demand for diversification. USDC's success has significant implications for the stablecoin market, intensifying competition, emphasizing transparency and compliance, and attracting growing institutional interest. As the stablecoin market continues to evolve, USDC is poised to play a leading role, shaping its future and driving its adoption in the broader financial ecosystem.

USDC.D In a Wyckoff Distribution range - Breakdown imminentUSDC.D Looking bearish as hell here in its Wyckoff distribution range. Compare it to USDT.D and see the similarities.
The difference being USDC.D is leading here and weaker, compared with USDT.D. Both still look great for the downside here and its only a matter of time before they roll over and the market runs to new highs!
USDC.D:
USDT.D:
Once this breaks down with USDT.D, we are in for the next bullish expansion in the market to new ATHs!

USDT.D Incoming bearish reversal and a bullish market and Q4!Im loving the look of USDT.D right now, it looks so bearish with the recent HTF closes. It looks done for and in the perfect wyckoff distribution.
Following the plan to a T, rejecting off the 5.90% level as discussed in the prior analysis where this was a key resistance level from the first PSY event. Price has refused to push to the upper limit of the range, rejecting from the last supply point and PSY in the range, formed a swing high on the daily, swept that high and is now continuing to distribute lower in line with the HTF picture.
This does look like a local top here following the last points of supply and we could be putting in local bottoms in the market.
Market could start its next run higher anytime over the next couple weeks now! Be patient, we are almost there!

USDT Dominance --- heading to 3.25%HOPEFULLY )
As our Bull market Top % Dominance
Low stablecoin dominance = FOMO shit coin mania :)
dominance up = bear market

This will make our jobs easier if #Stablecoin Dominancewas to reach the inverse head & shoulder target :)
Almost the same % when the #crypto market topped out last cycle.
Will it?
IDK!
Should u wait to those low single digit numbers before u emabrk on profit taking?
probably not.
We shall keep an eye on this of course.
Best of Luck

Stablecoin Dominance Tipping PointI see two possible scenarios playing out:
The Bullish Scenario
The dominance goes lower and respects the current downtrend. This could either bounce off roughly 6% (this area has seen some interesting patterns in the chart) or just continue collapsing down. This would be bullish depending on if we don't have much trouble clearing the 5.8-6% range.
The Bearish Scenario
We break the current downtrend by going up to 7.5% or above in the next 2-3 weeks, at which point I think that worst case we would test somewhere around 8.15%. This would be short to slightly medium-term bearish at the worst in my opinion.
I lean towards the bull case simply because markets are usually boring or choppy the month or so after the Bitcoin halving event; things usually ramp up after. We've dumped over 20% in BTC and altcoins got flushed aggressively while not establishing lower local lows at the same time as BTC did recently.
Despite being bullish, it's definitely at a tipping point where if it goes up by a bit more then it's a cause for concern. This is a good chart to watch closely for the next 1-3 weeks as evidence of more incoming corrections for a few more weeks or as evidence of the bullish trend resuming.
