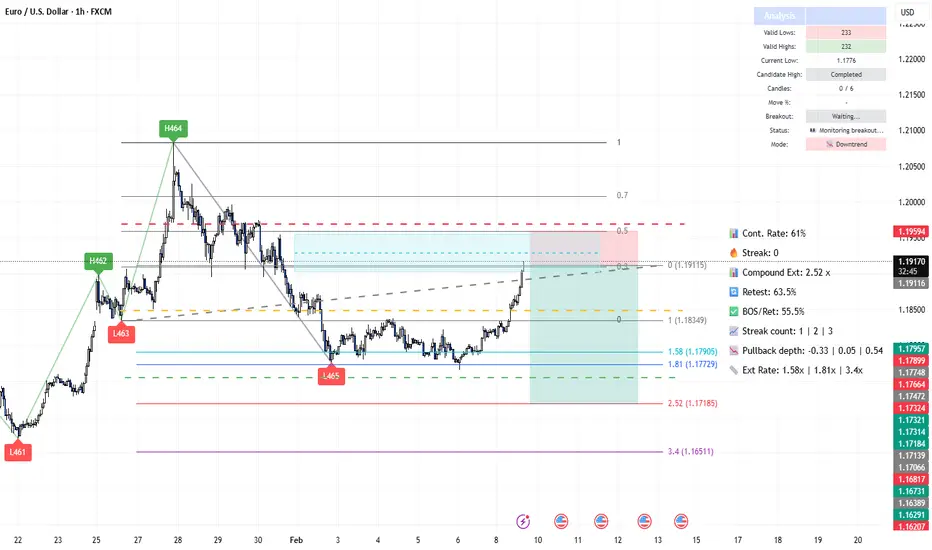
EUR/USD Market Analysis: Macro + Structure [MaB]1. The Macro Context (The "Why") 🌍
Hi traders! Before looking at the candles, let's look at the money.
My fundamental scoring table is giving us a clear signal: we have a -2 differential, pointing toward a Bearish (Moderate) bias that we simply can't ignore. 🏦
Key Factor Analysis:
🏦 Current Rates: Explanation: USD Fed funds at 3.75% offer a significant carry advantage over the BCE at 2.15%. Score EUR: 0 | Score USD: +1
🌍 Economic Regime: Explanation: EUR is in a Reflation phase with weak growth, while the USD enjoys a "Goldilocks" Expansion with solid GDP. Score EUR: +1 | Score USD: +1
📊 Rate Expectations: Explanation: ECB remains neutral with a prolonged hold, while the Fed shows a dovish post-cut trend. Score EUR: 0 | Score USD: -1
⚖️ Risk Sentiment: Explanation: Market sentiment is currently neutral for both currencies with no significant bias. Score EUR: 0 | Score USD: 0
🏛️ COT Score: Explanation: Speculators are heavily long on EUR at maximums, while USD shorts are being covered, suggesting a sentiment improvement. Score EUR: +2 | Score USD: +1
Currency Score Summary: Total Score EUR: +2 (Mixed) Total Score USD: +4 (Balanced)
Synthesis:
💡 EUR (Weak, Score +2): Mixed situation with stagnant growth (0.7%) and manufacturing PMI in contraction (<50).
💡 USD (Strong, Score +4): Solid growth (2.1%) and expanding PMIs, supported by positive employment data from jobless claims.
Conclusion: Given this fundamental backdrop, we are strictly looking for Short setups. Going against this bias would be statistical suicide. 🚫
2. The Technical Setup (The "Where") 📉
Timeframe: 1h | Pair: EUR/USD
The SMC Market Structure + Price Zones indicator has confirmed our statistical edge.
Here’s the probabilistic data from the dashboard:
🚀 Continuation Rate (61%): We are currently above the 60% threshold.
This confirms a healthy directional trend where continuation has a much higher probability than a reversal.
🔥 Streak Analysis (0): We are currently on impulse number 0 (Waiting for breakout).
Expected Streak: 1 | 2 | 3
Remaining Moves: High. This indicates a Young trend. The statistical range suggests we are at the start of a potential new bearish leg.
🔄 Retest & Reaction:
Retest Prob (63.5%): The probability of the price returning to test the zone after a BOS.
BOS/Ret Rate (55.5%): Once inside the zone, this is the probability of a positive reaction leading to a new BOS.
🎯 Extension & Projection:
Extension Range: The expected extension for this single leg is between 1.58x and 1.81x (Expected: 1.58x).
Compound Extension (2.52x): This is the total projected move based on the remaining expected impulses.
3. Execution Plan on Chart 🎯
Moving over to the charts, we are using these statistics to define our operational levels:
📍 Entry and Stop Loss: We are placing a limit entry within the Supply Zone 1h (Red/Grey Band) .
The stop loss is tucked a few pips outside the zone to protect against structural invalidation.
🏁 Statistical Take Profit: Instead of an arbitrary target, we are leveraging the Compound Extension .
We project the target at 2.52x relative to the pullback zone height.
This allows us to capture the full extension projected by the algorithm. 🏆
Trade Parameters:
💰 Entry Price: 1.19116
🛡️ Stop Loss: 1.19594
🏆 Take Profit: 1.17150
⚠️ Disclaimer: This analysis is based on a proprietary algorithm and is shared exclusively for educational and didactic purposes.
It does not constitute financial advice or investment solicitation in any way. Trading involves significant risk.
Statisticalprobability
EUR/AUD Market Analysis: Macro + Structure [MaB]1. The Macro Context (The "Why") 🌍
Hi traders! Before looking at the candles, let's look at the money.
My fundamental scoring table is giving us a clear signal: we have a -5 differential, pointing toward a Bearish (Moderate) bias that we simply can't ignore. 🏦
Key Factor Analysis:
🏦 Current Rates: Explanation: AUD offers a significantly higher and more attractive rate at 3.6% compared to the Euro's 2.15%. Score EUR: 0 | Score AUD: +1
🌍 Economic Regime: Explanation: Both regions are in reflation, but AUD shows accelerating inflation (+0.79%) while EUR inflation remains weak/stable. Score EUR: +1 | Score AUD: +2
📊 Rate Expectations: Explanation: ECB is on a neutral holding pattern, while the RBA remains hawkish with a recent +25bp hike and a tightening trend. Score EUR: 0 | Score AUD: +1
⚖️ Risk Sentiment: Explanation: The market regime is currently neutral for both currencies, offering no specific directional bias from sentiment alone. Score EUR: 0 | Score AUD: 0
🏛️ COT Score: Explanation: Both currencies show a COT Index of 100% with strong long positioning and purchase acceleration. Score EUR: +2 | Score AUD: +2
Currency Score Summary: Total Score EUR: +2 (Neutral) Total Score AUD: +7 (Strong)
Synthesis: 💡 EUR (Weak, Score +2): Showing signs of stagnation with a low GDP of 0.7% and manufacturing PMI still in contraction (49.5%). 💡 AUD (Strong, Score +7): Robust economy with 2.3% GDP and a surging services PMI at 56.3%.
Conclusion: Given this fundamental backdrop, we are strictly looking for Short setups. Going against this bias would be statistical suicide. 🚫
2. The Technical Setup (The "Where") 📉
Timeframe: 15m | Pair: EUR/AUD
The SMC Market Structure + Price Zones indicator has confirmed our statistical edge. Here’s the probabilistic data from the dashboard:
🚀 Continuation Rate (66.1%): We are currently above the 60% threshold. This confirms a healthy directional trend where continuation has a much higher probability than a reversal.
🔥 Streak Analysis (0): We are currently at the start of a potential new cycle.
Expected Streak: 1 | 2 | 5
Remaining Moves: This indicates a Young trend. The statistical range suggests we are positioned early in the structural movement.
🔄 Retest & Reaction:
Retest Prob (69.9%): The probability of the price returning to test the zone after a BOS.
BOS/Ret Rate (61%): Once inside the zone, this is the probability of a positive reaction leading to a new BOS.
🎯 Extension & Projection:
Extension Range: The expected extension for this single leg is between 1.56x and 3.16x (Expected: 1.78x).
Compound Extension (2.47x): This is the total projected move based on the remaining expected impulses. By multiplying the current zone height by this factor, we find our ultimate target.
3. Execution Plan on Chart 🎯
Moving over to the charts, we are using these statistics to define our operational levels:
📍 Entry and Stop Loss: We are placing a limit entry within the Supply Zone 15m (Red Band) . The stop loss is tucked a few pips outside the zone at 1.68740 to protect against structural invalidation.
🏁 Statistical Take Profit: Instead of an arbitrary target, we are leveraging the Compound Extension . We project the target at 2.47x relative to the pullback zone height. This allows us to capture the full extension projected by the algorithm. 🏆
Trade Parameters: 💰 Entry Price: 1.68410 🛡️ Stop Loss: 1.68740 🏆 Take Profit: 1.66764
⚠️ Disclaimer: This analysis is based on a proprietary algorithm and is shared exclusively for educational and didactic purposes. It does not constitute financial advice or investment solicitation in any way. Trading involves significant risk.

AUD/CAD Market Analysis: Macro + Structure [MaB]1. The Macro Context (The "Why") 🌍
Hi traders! Before looking at the candles, let's look at the money.
My fundamental scoring table is giving us a clear signal: we have a +5 differential, pointing toward a Bullish (Moderate) bias that we simply can't ignore. 🏦
Key Factor Analysis:
🏦 Current Rates: Explanation: RBA at 3.6% offers elevated and competitive yields compared to the BOC's mid-low 2.25% stance. Score AUD: +1 | Score CAD: 0
🌍 Economic Regime: Explanation: AUD is in a Reflation regime with accelerating inflation (+0.79%), while CAD shows signs of Stagflation with a borderline 50.9 Manufacturing PMI. Score AUD: +2 | Score CAD: -1
📊 Rate Expectations: Explanation: RBA remains hawkish following a recent +25bp hike; BOC maintains a neutral "prolonged holding" stance. Score AUD: +1 | Score CAD: 0
⚖️ Risk Sentiment: Explanation: Market sentiment is currently neutral for both currencies with no specific bias. Score AUD: 0 | Score CAD: 0
🏛️ COT Score: Explanation: Both currencies show maximum bullishness from speculators with a strong acceleration in long positions. Score AUD: +2 | Score CAD: +2
Currency Score Summary:
Total Score AUD: +6 (Strong Bullish)
Total Score CAD: +1 (Neutral/Positive)
Synthesis:
💡 AUD (Very Strong, Score +6): Driven by a hawkish RBA, solid 2.3% GDP, and strong PMI expansion.
💡 CAD (Positive, Score +1): Supported by COT data and target inflation, but weighed down by moderate 1.6% GDP and weak manufacturing.
Conclusion: Given this fundamental backdrop, we are strictly looking for Long setups. Going against this bias would be statistical suicide. 🚫
2. The Technical Setup (The "Where") 📉
Timeframe: 1h | Pair: AUD/CAD
The SMC Market Structure + Price Zones indicator has confirmed our statistical edge. Here’s the probabilistic data from the dashboard:
🚀 Continuation Rate (63.6%): We are currently above the 60% threshold. This confirms a healthy directional trend where continuation has a much higher probability than a reversal.
🔥 Streak Analysis (0): We are currently on impulse number 1 (start of a new cycle).
Expected Streak: 1 | 2 | 3 (Percentile: 55.2%)
Remaining Moves: 1 to 2. This indicates a Young trend.
🔄 Retest & Reaction:
Retest Prob (67.5%): High probability of the price returning to test the demand zone after the Break of Structure (BOS).
BOS/Ret Rate (55.2%): Once inside the zone, there is a solid probability of a positive reaction leading to a new BOS.
🎯 Extension & Projection:
Extension Range: The expected extension for this single leg is between 1.50x and 2.78x (Expected: 1.78x).
Compound Extension (2.45x): This is the total projected move based on the remaining expected impulses.
3. Execution Plan on Chart 🎯
Moving over to the charts, we are using these statistics to define our operational levels:
📍 Entry and Stop Loss: We are placing a limit entry within the Demand Zone 1h (Cyan/Blue Band) . The stop loss is tucked a few pips outside the zone at 0.95023 to protect against structural invalidation.
🏁 Statistical Take Profit: Instead of an arbitrary target, we are leveraging the Compound Extension . We project the target at 2.45x relative to the pullback zone height, aligning with the 0.98553 level. This allows us to capture the full extension projected by the algorithm. 🏆
Trade Parameters:
💰 Entry Price: 0.95583
🛡️ Stop Loss: 0.95023
🏆 Take Profit: 0.98553
⚠️ Disclaimer: This analysis is based on a proprietary algorithm and is shared exclusively for educational and didactic purposes. It does not constitute financial advice or investment solicitation in any way. Trading involves significant risk.

AUD/CHF Market Analysis: Macro + Structure [MaB]1. The Macro Context (The "Why") 🌍
Hi traders! Before looking at the candles, let's look at the money.
My fundamental scoring table is giving us a clear signal: we have a +7 differential, pointing toward a Strong Bullish bias that we simply can't ignore.
Key Factor Analysis:
🏦 Current Rates: Explanation: AUD RBA at 3.6% offers competitive high rates, while CHF SNB remains at 0.0%, the lowest among majors. Score AUD: +1 | Score CHF: -1
🌍 Economic Regime: Explanation: Both currencies are in a Reflation regime, but AUD shows stronger acceleration (+0.79%). Score AUD: +2 | Score CHF: +1
📊 Rate Expectations: Explanation: RBA remains hawkish with a recent +25bp hike, whereas SNB is expected to hold rates for a prolonged period. Score AUD: +1 | Score CHF: 0
⚖️ Risk Sentiment: Explanation: Market appetite is currently neutral with no specific bias affecting these currencies. Score AUD: 0 | Score CHF: 0
🏛️ COT Score: Explanation: Speculators are maximally bullish on AUD with accelerating longs; CHF shows mixed signals despite a strong short position. Score AUD: +2 | Score CHF: 0
Currency Score Summary: Total Score AUD: +6 (Strong Bullish) Total Score CHF: -1 (Weak Bearish)
Synthesis:
💡 AUD (Strong, Score +6): Driven by a hawkish RBA, solid 2.3% GDP, and strong PMI expansion. 💡 CHF (Weak, Score -1): Weighted down by 0.02% deflation, modest growth, and manufacturing contraction (PMI 48.8).
Conclusion: Given this fundamental backdrop, we are strictly looking for Long setups. Going against this bias would be statistical suicide.
2. The Technical Setup (The "Where") 📉
Timeframe: 1h | Pair: AUD/CHF The SMC Market Structure + Price Zones indicator has confirmed our statistical edge. Here’s the probabilistic data from the dashboard:
🚀 Continuation Rate (65.1%): We are currently above the 60% threshold. This confirms a healthy directional trend where continuation has a much higher probability than a reversal.
🔥 Streak Analysis (1): We are currently on impulse number 1.
Expected Streak: 1 | 2 | 4 (Percentile: 20th-80th) Remaining Moves: This indicates a Young trend, suggesting significant room for further appreciation.
🔄 Retest & Reaction:
Retest Prob (75.2%): High probability of the price returning to test the demand zone. BOS/Ret Rate (56.7%): Once inside the zone, there is a solid probability of a positive reaction leading to a new Break of Structure.
🎯 Extension & Projection:
Extension Range: Expected extension for this leg is between 1.61x and 2.72x. Compound Extension (1.75x): This is the total projected move based on the remaining expected impulses.
3. Execution Plan on Chart 🎯
Moving over to the charts, we are using these statistics to define our operational levels:
📍 Entry and Stop Loss: We are placing a limit entry within the Demand Zone 1h (Cyan Band) . The stop loss is tucked a few pips outside the zone to protect against structural invalidation.
🏁 Statistical Take Profit: Instead of an arbitrary target, we are leveraging the Compound Extension . We project the target at 1.75x relative to the pullback zone height.
This allows us to capture the full extension projected by the algorithm. 🏆
Trade Parameters:
💰 Entry Price: 0.53949 🛡️ Stop Loss: 0.53653 🏆 Take Profit: 0.55654
⚠️ Disclaimer: This analysis is based on a proprietary algorithm and is shared exclusively for educational and didactic purposes.
It does not constitute financial advice or investment solicitation in any way. Trading involves significant risk.

ETHUSD Market Analysis: Macro + Structure [MaB]1. The Technical Setup (The "Where") 📉
Timeframe: 15m | Pair: ETHUSD
The SMC Market Structure + Price Zones indicator gave us the confirmation we needed for our statistical edge. Look at the dashboard, numbers don't lie:
🚀 Continuation Rate (73.9%): We are well above the 60% threshold. This tells us the market is in a healthy, directional trend. Statistically, betting on continuation pays off more than looking for a reversal.
🔥 Streak (0): We are at the start of a potential new cycle after the recent BOS.
🔄 Retest (70%): The indicator tells us that statistically, when price creates a new Break of Structure (BOS), it retraces into the previous zone 70% of the time.
💥 BOS/Ret Rate (64.2%): This parameter tells us that once price retraces inside the previous zone, it has a high probability of reacting and creating a new BOS.
🎯 Extension Rate (1.65 - 3.3x): The algorithm projects an ambitious target. We expect this move to extend at least 1.65 times the current pullback leg.
2. Execution Plan on Chart
Moving to the chart, the SMC Market Structure + Price Zones indicator supports us in pinpointing liquidity to define entry and stop loss:
Entry and Stop Loss: We place a limit entry in the Supply Zone 15m (Red Band) at the 0.5 Fibonacci level and the stop loss above the zone.
Take Profit: We leverage the asset's statistical analysis offered by the Extension Rate and place the target at 1936.1 .
Trade Parameters:
Entry Price: 2071.3
Stop Loss: 2097.6
Take Profit: 1936.1
⚠️ Disclaimer: This analysis is based on a proprietary algorithm and is shared exclusively for educational and didactic purposes. It does not constitute financial advice or investment solicitation in any way. Trading involves significant risk.

ETHUSD Market Analysis: Macro + Structure [MaB]1. The Technical Setup (The "Where") 📉
Timeframe: 15m | Pair: ETHUSD The SMC Market Structure + Price Zones indicator gave us the confirmation we needed for our statistical edge.
Here is where the indicator makes the difference. Look at the dashboard on the right, numbers don't lie:
🚀 Continuation Rate (74.5%): We are well above the 60% threshold. This tells us the market is in a healthy, directional trend. Statistically, betting on continuation pays off more than looking for a reversal.
🔥 Streak (9) & Streak Pct (4%): We are at the 9th consecutive impulse. It's a mature trend (we are in the 4th percentile of trend extension), so watch those stop losses, but as long as the music plays, we dance.
🔄 Retest (78.6%): The indicator tells us that statistically, when price creates a new Break of Structure (BOS), it retraces into the previous zone 78.6% of the time.
💥 BOS/Ret Rate (65.2%): This parameter tells us that once price retraces inside the previous zone, it has a high probability of reacting and creating a new BOS.
🎯 Extension Rate (1.8x): The algorithm projects an ambitious target. We expect this move to extend 1.8 times the current pullback leg. That's where we'll take profit.
2. Execution Plan on Chart
Moving to the chart, the SMC Market Structure + Price Zones indicator supports us in pinpointing liquidity to define entry and stop loss:
Entry and Stop Loss: We place a limit entry in the Supply Zone 15m (Blue Band) and the stop loss a few pips above the zone at the structural high. Take Profit: We leverage the asset's statistical analysis offered by the Extension Rate and place the target by measuring with Fibonacci at 1.8x relative to the pullback leg.
Trade Parameters: Entry Price: 1963.2 Stop Loss: 2021.9 Take Profit: 1563.2
⚠️ Disclaimer: This analysis is based on a proprietary algorithm and is shared exclusively for educational and didactic purposes. It does not constitute financial advice or investment solicitation in any way. Trading involves significant risk.

AUD/JPY Market Analysis: Macro + Structure [MaB]1. The Macro Context (The "Why") 🌍
Hi traders! Before looking at the candles, let's look at the money. My fundamental scoring table speaks clearly: there is a +7 differential, indicating a Strong Bullish bias that we cannot ignore.
Key Factor Analysis:
🏦 Current Rates: Explanation: RBA is at 3.85% post-hike, making rates attractive, while BoJ remains at 0.75%, still very low vs G7. Score AUD: +1 Score JPY: -1
🌍 Economic Regime: Explanation: AUD is in Reflation with accelerating inflation; JPY is in Expansion (Goldilocks). Score AUD: +2 Score JPY: +1
📊 Rate Expectations: Explanation: RBA is hawkish, being the first major to hike in 2026; BoJ is hawkish following the December hike but in a tactical pause. Score AUD: +1 Score JPY: +1
🎈 Inflation: Explanation: AUD at 3.8% is well above target; JPY at 2.91% keeps pressure on BoJ for tightening. Score AUD: +1 Score JPY: +1
📈 Growth/GDP: Explanation: AUD GDP (2.3%) is considered more robust compared to the weak JPY GDP at 0.5%. Score AUD: 0 Score JPY: -1
⚖️ Risk Sentiment: Explanation: Current market appetite is neutral with no specific bias. Score AUD: 0 Score JPY: 0
🏛️ COT Score: Explanation: Longs are strong for AUD with accelerating buying; JPY shorts are strong but buying is starting. Score AUD: +2 Score JPY: 0
🗞️ News Bonus: Explanation: RBA hiked 25bp three days ago; no relevant JPY news in the last 24h. Score AUD: +1 Score JPY: 0
Currency Score Summary:
Total Score AUD: +8 (Strong Bullish)
Total Score JPY: +1 (Bullish)
Synthesis:
AUD (Strong, Score +8): Very strong with RBA being the first major to hike in 2026 and a determined hawkish stance.
JPY (Weak, Score +1): Benefits from a hawkish BoJ stance, but growth remains very weak at 0.5%.
Conclusion: With this scenario, we are only looking for Long setups.
2. The Technical Setup (The "Where") 📉
Timeframe: 4H | Pair: AUD/JPY
The SMC Market Structure + Price Zones indicator gave us the confirmation we needed for our statistical edge. Look at the dashboard on the right:
🚀 Continuation Rate (72.2%): We are well above the 60% threshold. This tells us the market is in a healthy, directional trend.
🔥 Streak (4) & Streak Pct (4): We are at the 4th consecutive impulse. It's a mature trend, but as long as the music plays, we dance.
🔄 Retest (41.2%): The indicator tells us that statistically, price retraces into the previous zone only 41.2% of the time.
💥 BOS/Ret Rate (68.1%): This parameter tells us that once price retraces inside the previous zone, it has a high probability of reacting and creating a new BOS.
🎯 Extension Rate (1.79x): The algorithm projects an ambitious target. We expect this move to extend 1.79 times the current pullback leg.
3. Execution Plan on Chart
Moving to the chart, the SMC Market Structure + Price Zones indicator supports us in pinpointing liquidity:
Entry and Stop Loss: We place a limit entry in the Demand Zone 4H (Cyan Band) and the stop loss a few pips below the zone.
Take Profit: We leverage the Extension Rate and place the target by measuring with Fibonacci at 1.79x relative to the pullback leg.
Trade Parameters:
Entry Price: 107.815 Stop Loss: 106.769 Take Profit: 112.011
⚠️ Disclaimer: This analysis is based on a proprietary algorithm and is shared exclusively for educational and didactic purposes. It does not constitute financial advice or investment solicitation in any way. Trading involves significant risk.

GBP/AUD Market Analysis: Macro + Structure [MaB]1. The Macro Context (The "Why") 🌍
Hi traders! Before looking at the candles, let's look at the money. My fundamental scoring table speaks clearly: there is a -6 differential, indicating a Bearish (Moderate) bias that we cannot ignore.
Key Factor Analysis:
🏦 Current Rates: Explanation: GBP at 3.75% matches the Fed, while AUD at 3.6% remains attractive after a recent hike. Score GBP: +1 Score AUD: +1
🌍 Economic Regime: Explanation: GBP is in Expansion (Goldilocks), but AUD is in Reflation with accelerating inflation. Score GBP: +1 Score AUD: +2
📊 Rate Expectations: Explanation: BoE is in an easing cycle with a December cut (dovish), while RBA remains hawkish after a +25bp hike. Score GBP: -1 Score AUD: +1
🎈 Inflation: Explanation: Both remain above target, maintaining hawkish pressure on both central banks. Score GBP: +1 Score AUD: +1
📈 Growth/GDP: Explanation: Moderate growth for GBP (1.3%) vs. more robust but potentially unsustainable growth for AUD (2.3%). Score GBP: 0 Score AUD: 0
⚖️ Risk Sentiment: Explanation: Current market appetite is neutral with no specific bias. Score GBP: 0 Score AUD: 0
🏛️ COT Score: Explanation: GBP shows bearish positioning building, while AUD sees strong long acceleration. Score GBP: -1 Score AUD: +2
🗞️ News Bonus: Explanation: No relevant economic surprises in the last 24h for either currency. Score GBP: 0 Score AUD: 0
Currency Score Summary:
Total Score GBP: +1 (Neutral/Weak)
Total Score AUD: +7 (Strong)
Synthesis: GBP (Weak, Score +1): Under pressure due to the BoE easing cycle and bearish COT positioning. AUD (Strong, Score +7): Very strong following a hawkish RBA hike and accelerating long positions in the COT report.
Conclusion: With this scenario, we are only looking for Short setups. Going against this bias would be statistical suicide.
2. The Technical Setup (The "Where") 📉
Timeframe: 1h | Pair: GBP/AUD
The SMC Market Structure + Price Zones indicator gave us the confirmation we needed for our statistical edge. Here is where the indicator makes the difference. Look at the dashboard on the right, numbers don't lie:
🚀 Continuation Rate (64.9%): We are well above the 60% threshold. This tells us the market is in a healthy, directional trend. Statistically, betting on continuation pays off more than looking for a reversal.
🔥 Streak (2): We are at the 2nd consecutive impulse. It's a young trend, so there is plenty of room for extension before reaching extreme exhaustion levels.
🔄 Retest (84.6%): The indicator tells us that statistically, when price creates a new Break of Structure (BOS), it retraces into the previous zone 84.6% of the time. This gives us high confidence in our entry zone.
💥 BOS/Ret Rate (60.2%): This parameter tells us that once price retraces inside the previous zone, it has a high probability of reacting and creating a new BOS.
🎯 Extension Rate (1.72x): The algorithm projects an ambitious target. We expect this move to extend 1.72 times the current pullback leg. That's where we'll take profit.
3. Execution Plan on Chart
Moving to the chart, the SMC Market Structure + Price Zones indicator supports us in pinpointing liquidity to define entry and stop loss:
Entry and Stop Loss: We place a limit entry in the Supply Zone 1h (Red Band) at the equilibrium (0.5) level, and the stop loss a few pips above the zone.
Take Profit: We leverage the asset's statistical analysis offered by the Extension Rate and place the target by measuring with Fibonacci at 1.72x relative to the pullback leg.
Trade Parameters:
Entry Price: 1.96135
Stop Loss: 1.96617
Take Profit: 1.92990
⚠️ Disclaimer: This analysis is based on a proprietary algorithm and is shared exclusively for educational and didactic purposes. It does not constitute financial advice or investment solicitation in any way. Trading involves significant risk.

[EUR/CHF] Market Analysis: Macro + Structure [MaB]1. The Macro Context (The "Why") 🌍
Hi traders! Before looking at the candles, let's look at the money.
My fundamental scoring table speaks clearly: there is a +5 differential, indicating a Bullish Moderate bias that we cannot ignore.
Key Factor Analysis:
🏦 Current Rates: Explanation: ECB at 2.15% (G7 average) vs SNB at 0% (lowest G7, no carry appeal). Score EUR: 0 Score CHF: -1
🌍 Economic Regime: Explanation: Both currencies are in a Reflation regime with moderate inflation increases. Score EUR: +1 Score CHF: +1
📊 Rate Expectations: Explanation: Both central banks are neutral, holding steady with no immediate pressure. Score EUR: 0 Score CHF: 0
🎈 Inflation: Explanation: EUR (2.14%) is near target, while CHF (0.02%) is in deflation and well below target. Score EUR: 0 Score CHF: -1
📈 Growth/GDP: Explanation: EUR shows evident stagnation (0.7%), while CHF shows modest but stable growth (1.2%). Score EUR: -1 Score CHF: 0
⚖️ Risk Sentiment: Explanation: The market is in a neutral regime for both currencies with no specific bias. Score EUR: 0 Score CHF: 0
🏛️ COT Score: Explanation: Strong long accumulation and accelerating buys for EUR vs consolidated strong shorts for CHF. Score EUR: +2 Score CHF: -1
🗞️ News Bonus: Explanation: No major EUR surprises; CHF PMI Manufacturing (48.8) remains in contraction despite a slight recovery. Score EUR: 0 Score CHF: -1
Currency Score Summary:
Total Score EUR: +2 (Neutral/Mixed)
Total Score CHF: -3 (Weak)
Synthesis:
EUR (Mixed, Score +2): ECB neutral with 2.15% rates, inflation near target but growth is weak. Strong COT support with speculators accumulating.
CHF (Very Weak, Score -3): SNB neutral with 0% rates and stagnation. Manufacturing PMI remains under 50 with consolidated short positions.
Conclusion: With this scenario, we are only looking for Long setups. Going against this bias would be statistical suicide.
2. The Technical Setup (The "Where") 📉
Timeframe: 15m | Pair: EUR/CHF
The SMC Market Structure + Price Zones indicator gave us the confirmation we needed for our statistical edge.
Here is where the indicator makes the difference. Look at the dashboard on the right, numbers don't lie:
🚀 Continuation Rate (68.8%): We are well above the 60% threshold.
This tells us the market is in a healthy, directional trend. Statistically, betting on continuation pays off more than looking for a reversal.
🔥 Streak (1) & Streak Pct: We are at the 1st consecutive impulse.
It's a fresh trend (we are in the 3rd percentile of trend extension), so the potential for growth is high. As long as the music plays, we dance.
🔄 Retest (39.7%): The indicator tells us that statistically, when price creates a new Break of Structure (BOS), it retraces into the previous zone only 39.7% of the time.
💥 BOS/Ret Rate (64.9%): This parameter tells us that once price retraces inside the previous zone, it has a high probability of reacting and creating a new BOS.
🎯 Extension Rate (1.74x): The algorithm projects an ambitious target.
We expect this move to extend 1.74 times the current pullback leg. That's where we'll take profit.
3. Execution Plan on Chart
Moving to the chart, the SMC Market Structure + Price Zones indicator supports us in pinpointing liquidity to define entry and stop loss:
Entry and Stop Loss: We place a limit entry in the Demand Zone 15m (Blue Band) and the stop loss a few pips below the zone.
Take Profit: We leverage the asset's statistical analysis offered by the Extension Rate and place the target by measuring with Fibonacci at 1.74x relative to the pullback leg.
Trade Parameters:
Entry Price: 0.91698
Stop Loss: 0.91575
Take Profit: 0.92382
⚠️ Disclaimer: This analysis is based on a proprietary algorithm and is shared exclusively for educational and didactic purposes. It does not constitute financial advice or investment solicitation in any way. Trading involves significant risk.

EUR/GBP Market Analysis: Macro + Structure [MaB]1. The Macro Context (The "Why") 🌍
Hi traders! Before looking at the candles, let's look at the money. My fundamental scoring table speaks clearly: there is a huge differential that we cannot ignore.
+1
Key Factor Analysis:
🏦 Current Rates: Explanation: BoE at 3.75% provides a higher yield environment compared to the ECB's 2.15%. Score EUR: 0 Score GBP: +1
🌍 Economic Regime: Explanation: The Eurozone is currently in Reflation, while the UK is experiencing an Expansion phase. Score EUR: +1 Score GBP: +1 📊 Rate Expectations: Explanation: The ECB is holding steady, whereas the BoE is perceived as dovish following a recent cut. Score EUR: 0 Score GBP: -1
🎈 Inflation: Explanation: EUR CPI is low at 1.9%, putting dovish pressure on the ECB; GBP CPI remains high at 3.57%. Score EUR: -1 Score GBP: +1
📈 Growth/GDP: Explanation: EUR growth is stagnant at 0.7%, while GBP growth is 1.3%. Score EUR: -1 Score GBP: 0 ⚖️ Risk Sentiment: Explanation: Both currencies are currently operating in a neutral risk environment. Score EUR: 0 Score GBP: 0
🏛️ Fiscal/Balance: Explanation: No significant fiscal shifts or debt crises are currently impacting either region. Score EUR: 0 Score GBP: 0 🗞️ News Catalyst: Explanation: Recent EUR CPI data came in slightly lower than expected at -0.1%. Score EUR: 0 Score GBP: 0
Currency Score Summary: Total Score EUR: -1 (Weak) Total Score GBP: +2 (Strong)
Synthesis: EUR (Weak, Score -1): Weighed down by low inflation (1.9%) and stagnant growth, increasing expectations for ECB easing. GBP (Strong, Score +2): Bolstered by high relative interest rates and persistent inflation (3.57%) that limits aggressive BoE cutting.
Conclusion: With this scenario, we are only looking for Short setups. Going against this bias would be statistical suicide.
2. The Technical Setup (The "Where") 📉
Timeframe: 4H | Pair: EUR/GBP
The SMC Market Structure + Price Zones indicator gave us the confirmation we needed for our statistical edge.
Here is where the indicator makes the difference. Look at the dashboard on the right, numbers don't lie:
🚀 Continuation Rate (62.2%): We are well above the 60% threshold. This tells us the market is in a healthy, directional trend. Statistically, betting on continuation pays off more than looking for a reversal.
🔥 Streak (3) & Streak Pct: We are at the 3rd consecutive impulse. It's a mature trend, so watch those stop losses, but as long as the music plays, we dance.
🔄 Retest (81.3%): The indicator tells us that statistically, when price creates a new Break of Structure (BOS), it retraces into the previous zone 81.3% of the time.
💥 BOS/Ret Rate (58.1%): This parameter tells us that once price retraces inside the previous zone, it has a high probability of reacting and creating a new BOS.
🎯 Extension Rate (1.59x): The algorithm projects an ambitious target.
We expect this move to extend 1.59 times the current pullback leg. That's where we'll take profit.
3. Execution Plan on Chart
Moving to the chart, the SMC Market Structure + Price Zones indicator supports us in pinpointing liquidity to define entry and stop loss:
Entry and Stop Loss: We place a limit entry in the Supply Zone (Red Band) and the stop loss a few pips above the zone. Take Profit: We leverage the asset's statistical analysis offered by the Extension Rate and place the target by measuring with Fibonacci at 1.59x relative to the pullback leg.
Trade Parameters: Entry Price: 0.86799 Stop Loss: 0.86978 Take Profit: 0.85904
⚠️ Disclaimer: This analysis is based on a proprietary algorithm and is shared exclusively for educational and didactic purposes.
It does not constitute financial advice or investment solicitation in any way. Trading involves significant risk.

EUR/AUD Market Analysis: Macro + Structure [MaB]1. The Macro Context (The "Why") 🌍
Hi traders! Before looking at the candles, let's look at the money.
My fundamental scoring table speaks clearly: there is a huge differential that we cannot ignore.
Key Factor Analysis:
🏦 Rate Expectations: Explanation: The BCE remains neutral at 2.15%, holding for two consecutive meetings, while the RBA maintains a higher rate of 3.6% with a neutral but relatively hawkish stance. Score EUR: 0 Score AUD: +1
+4
🎈 Inflation: Explanation: Eurozone inflation is at 1.9%, below the 2% target, creating dovish pressure. Conversely, Australian inflation is high at 3.8%, well above target, maintaining hawkish pressure. Score EUR: -1 Score AUD: +1
+2
📈 Growth/GDP: Explanation: The Eurozone faces concerning stagnation with growth at 0.7%. Australia shows more solid growth at 2.3%, though high inflation makes it sensitive. Score EUR: -1 Score AUD: 0
+2
🏭 PMI Data: Explanation: EUR PMI is mixed (Manufacturing 49.4, Services 51.9). AUD Services PMI saw a significant acceleration (+4.9 to 56.0), indicating strong expansion. Score EUR: 0 Score AUD: 0
+4
⚖️ Risk Sentiment: Explanation: EUR is acting as semi-cyclical and neutral, while AUD remains cyclical but currently in a neutral regime with no specific bias. Score EUR: 0 Score AUD: 0
+2
🗞️ News Catalyst: Explanation: No significant fiscal crisis news for either region; focus remains on the divergent inflation paths and PMI momentum. Score EUR: 0 Score AUD: 0
+1
Currency Score Summary:
Total Score EUR: -1 (Weak) Total Score AUD: +3 (Strong)
+2
Synthesis:
EUR (Weak, Score -1): Stagnant growth and below-target inflation are weighing on the Euro. AUD (Strong, Score +3): Higher interest rates and accelerating services PMI make the Aussie the clear favorite.
Conclusion: With this scenario, we are only looking for Short setups. Going against this bias would be statistical suicide.
+3
2. The Technical Setup (The "Where") 📉
Timeframe: 4H | Pair: EUR/AUD
The SMC Market Structure + Price Zones indicator gave us the confirmation we needed for our statistical edge. Here is where the indicator makes the difference. Look at the dashboard on the right, numbers don't lie:
🚀 Continuation Rate (66.7%): We are well above the 60% threshold. This tells us the market is in a healthy, directional trend. Statistically, betting on continuation pays off more than looking for a reversal.
🔥 Streak (4) & Streak Pct (3): We are at the 4th consecutive impulse. It's a mature trend, sitting in the 3rd percentile of extension—watch those stop losses, but as long as the music plays, we dance.
🔄 Retest (79.8%): The indicator tells us that statistically, when price creates a new Break of Structure (BOS), it retraces into the previous zone 79.8% of the time. This gives us high confidence that our entry zone will be reached.
💥 BOS/Ret Rate (57.8%): This parameter tells us that once price retraces inside the previous zone, it has a 57.8% probability of reacting and creating a new BOS.
🎯 Extension Rate (1.66x): The algorithm projects an ambitious target. We expect this move to extend 1.66 times the current pullback leg. That's where we'll take profit.
3. Execution Plan on Chart
Moving to the chart, the SMC Market Structure + Price Zones indicator supports us in pinpointing liquidity to define entry and stop loss:
Entry and Stop Loss: We place a limit entry in the Supply Zone 4H (Red Band) at 1.71276 and the stop loss a few pips above the zone at 1.71846.
Take Profit: We leverage the asset's statistical analysis offered by the Extension Rate and place the target by measuring with Fibonacci at 1.6x relative to the pullback leg.
Trade Parameters: Entry Price: 1.71276 Stop Loss: 1.71846 Take Profit: 1.67569
⚠️ Disclaimer: This analysis is based on a proprietary algorithm and is shared exclusively for educational and didactic purposes. It does not constitute financial advice or investment solicitation in any way. Trading involves significant risk.

EUR/JPY Market Analysis: Macro + Structure [MaB]1. The Macro Context (The "Why") 🌍
Hi traders! Before looking at the candles, let's look at the money.
My fundamental scoring table speaks clearly: there is a huge differential that we cannot ignore.
Key Factor Analysis:
🏦 Rate Expectations: Explanation: The BCE remains neutral with a trend holding stance and no clear bias in recent decisions, while the BOJ is the only hawkish central bank in the G7 with a recent +25bp hike and an aggressive stance. Score EUR: 0 Score JPY: +2
🎈 Inflation: Explanation: Eurozone inflation is at 2.14%, close to the 2% target, representing a controlled situation. JPY inflation at 2.91% is above target, justifying the BOJ's hawkish stance. Score EUR: 0 Score JPY: +1
📈 Growth/GDP: Explanation: Europe is facing worrying economic stagnation with a GDP of 0.7%. Japan's growth is also weak at 0.5%, which limits the space for overly aggressive rate hikes. Score EUR: -1 Score JPY: -1
🏭 PMI Data: Explanation: EUR PMI is neutral (weighted 50.65). JPY shows manufacturing expansion with a weighted PMI of 52.66. Score EUR: 0 Score JPY: +1
⚖️ Risk Sentiment: Explanation: Market is currently in a neutral regime; EUR is semi-cyclical and JPY is a safe-haven, but no significant risk-off flows are present. Score EUR: 0 Score JPY: 0
🗞️ News Catalyst: Explanation: Recent EUR CPI came in at 1.9% vs 2.0% expected, a moderate negative surprise. JPY benefits from exceptional hawkish policy momentum. Score EUR: 0 Score JPY: 0
Currency Score Summary:
Total Score EUR: -1 ( ) Total Score JPY: +2 ( )
Synthesis:
EUR (Weak, Score -1): The Euro is under pressure due to economic stagnation and a neutral central bank. JPY (Strong, Score +2): The Yen is strong, supported by a hawkish BOJ that stands out as an outlier in the G7. Conclusion: With this scenario, we are only looking for .
Going against this bias would be statistical suicide.
2. The Technical Setup (The "Where") 📉
Timeframe: 4h | Pair: EUR/JPY
The SMC Market Structure + Price Zones indicator gave us the confirmation we needed for our statistical edge.
Here is where the indicator makes the difference. Look at the dashboard on the right, numbers don't lie:
🚀 Continuation Rate (60%): We are exactly at the 60% threshold.
This tells us the market is in a healthy, directional trend.
Statistically, betting on continuation pays off more than looking for a reversal.
🔥 Streak (0) & Streak Pct: 2 We are at the start of a potential new leg after a period of correction.
It's a mature trend (we are in the 2nd percentile of trend extension), so watch those stop losses, but as long as the music plays, we dance.
🔄 Retest (85.4%): The indicator tells us that statistically, when price creates a new Break of Structure (BOS), it retraces into the previous zone 85.4% of the time.
Therefore, it pays to wait for a deep retracement into the supply zone to maximize our Risk/Reward ratio.
💥 BOS/Ret Rate (41.5%): This parameter tells us that once price retraces inside the previous zone, it has a 41.5% probability of reacting and creating a new BOS.
🎯 Extension Rate (1.82x): The algorithm projects an ambitious target.
We expect this move to extend 1.82 times the current pullback leg. That's where we'll take profit.
3. Execution Plan on Chart
Moving to the chart, the SMC Market Structure + Price Zones indicator supports us in pinpointing liquidity to define entry and stop loss:
Entry and Stop Loss: We place a limit entry in the Supply Zone 4h (Red Band) and the stop loss a few pips above the zone.
Take Profit: We leverage the asset's statistical analysis offered by the Extension Rate and place the target by measuring with Fibonacci at 1.8x relative to the pullback leg.
Trade Parameters:
Entry Price: 185.416 Stop Loss: 186.181 Take Profit: 178.850
⚠️ Disclaimer: This analysis is based on a proprietary algorithm and is shared exclusively for educational and didactic purposes.
It does not constitute financial advice or investment solicitation in any way. Trading involves significant risk.

AUD/CHF Market Analysis: Macro + Structure [MaB]1. The Macro Context (The "Why") 🌍
Hi traders! Before looking at the candles, let's look at the money. My fundamental scoring table speaks clearly: there is a huge differential that we cannot ignore.
Key Factor Analysis: 🏦 Rate Expectations: Explanation: The RBA is neutral at 3.6% in the G7 context, offering an interesting carry. The SNB is at 0.0%, the lowest rate among major currencies. Score AUD: +1 Score CHF: -1 🎈 Inflation: Explanation: AUD inflation is at 3.4%, sitting above target but with a justified stance. CHF inflation is at 0.02%, effectively in a state of de facto deflation. Score AUD: +1 Score CHF: -1 📈 Growth/GDP: Explanation: Australia shows robust 2.3% growth. Switzerland's growth is moderate at 1.2%, which is acceptable for their economy. Score AUD: 0 Score CHF: 0 🏭 PMI Data: Explanation: AUD weighted PMI is 51.8 (Expansion). Swiss manufacturing PMI has collapsed to 45.8, indicating strong contraction. Score AUD: +1 Score CHF: -1 ⚖️ Risk Sentiment: Explanation: The market regime is currently neutral for both pairs with no significant net flows. Score AUD: 0 Score CHF: 0 🗞️ News Catalyst: Explanation: No significant surprises on secondary data for AUD. The CHF PMI slump was already factored into the dedicated PMI metric. Score AUD: 0 Score CHF: 0
Currency Score Summary: Total Score AUD: +3 (Strong) Total Score CHF: -3 (Weak)
Synthesis: AUD (Strong, Score +3): Supported by attractive interest rates and expansionary PMI data. CHF (Weak, Score -3): Dragged down by zero rates, deflationary pressure, and a manufacturing collapse. Conclusion: With this scenario, we are only looking for Long positions. Going against this bias would be statistical suicide.
2. The Technical Setup (The "Where") 📉
Timeframe: 4H | Pair: AUD/CHF
The SMC Market Structure + Price Zones indicator gave us the confirmation we needed for our statistical edge. Look at the dashboard on the right, numbers don't lie:
🚀 Continuation Rate (63.2%): We are well above the 60% threshold. This tells us the market is in a healthy, directional trend. Statistically, betting on continuation pays off more than looking for a reversal. 🔥 Streak (2) & Streak Pct: We are at the 2nd consecutive impulse. It's a fresh move with room to develop, so as long as the music plays, we dance. 🔄 Retest (42.1%): The indicator tells us that statistically, when price creates a new Break of Structure (BOS), it retraces into the previous zone only 42.1% of the time. Therefore, we should try to enter before a deep retracement to avoid missing the move. 💥 BOS/Ret Rate (54.2%): This parameter tells us that once price retraces inside the previous zone, it has a solid probability of reacting and creating a new BOS. 🎯 Extension Rate (1.76x): The algorithm projects an ambitious target. We expect this move to extend 1.76 times the current pullback leg.
3. Execution Plan on Chart
Moving to the chart, the SMC Market Structure + Price Zones indicator supports us in pinpointing liquidity to define entry and stop loss:
Entry and Stop Loss: We place a limit entry in the Demand Zone 4H (Blue Band) and the stop loss a few pips below the zone at 0.53359. Take Profit: We leverage the asset's statistical analysis offered by the Extension Rate and place the target by measuring with Fibonacci at 1.76x relative to the pullback leg.
Trade Parameters: Entry Price: 0.53522 Stop Loss: 0.53359 Take Profit: 0.54831
⚠️ Disclaimer: This analysis is based on a proprietary algorithm and is shared exclusively for educational and didactic purposes. It does not constitute financial advice or investment solicitation in any way. Trading involves significant risk.

Gold Options Expiry: The $4,375 "Gravity" vs. StatisticalHey traders!
Tomorrow is a financial battleground for the gold market. It's the major monthly options expiry, and the numbers reveal a fascinating tug-of-war. Let’s break down the forces at play and what they mean for the price.
The Setup: Huge Open Interest
Looking at the latest data, we have over **126,000 open call contracts** and more than **155,000 open put contracts** set to expire. Here’s the breakdown:
Calls:
- In the Money (ITM): 105,859
- At the Money (ATM): 68
- Out of the Money (OTM): 20,572
- Total OI: 126,499
Puts:
- In the Money (ITM): 111
- At the Money (ATM): 47
- Out of the Money (OTM): 154,874
- Total OI: 155,032
That’s a massive pile of open interest, with most puts sitting deep out of the money—a sign that a lot of traders have been betting on a drop or hedge there bull trades.
But the story doesn't end here.
The "Gravity" of Max Pain
The Max Pain level is currently sitting at $4,375.
What is Max Pain? Think of it as the "house's" ideal price. Option sellers (market makers and institutions) collect premiums from buyers. They make the most money if options expire worthless. The Max Pain price is the strike where the maximum number of options (both puts and calls) expire worthless, causing the most financial "pain" to buyers and maximum profit for sellers.
The theory suggests that as expiry approaches, the price will be gravitationally pulled toward this level. If you take this theory at face value, gold should drop from its current to $4,375 by tomorrow's close.
But… Is That Even Possible?
Here’s where we need to pump the brakes. Statistically speaking, the odds of such a move are close to zero—and here’s why.
On developed markets, asset price moves are largely governed by well-known mathematical and statistical boundaries, especially the **expected volatility range**. Hedge funds and institutional traders have relied on these ranges for years to guide their decisions. The range is defined by standard deviations:
- 1st standard deviation:** Price stays within this range 68% of the time (up or down).
- 2nd standard deviation:** 95% probability.
- 3rd standard deviation:** 98% probability.
So, to seriously claim that gold will hit $4,375 by tomorrow’s close, you’d need to calculate the 3rd standard deviation from today’s settlement and see if $4,375 is even in the realm of possibility.
In my experience, I do these calculations right after the daily clearing and plot them on the current gold futures chart. (If you’re not up for the math, just follow my posts—I regularly share these volatility bands and show how well they work. Spoiler: price bounces or stalls at these levels with at least 70% effectiveness.)
Can Gravity Break the Leash?
Now, let's be data-driven analysts and combine our two forces:
Max Pain "Gravity" Target: $4,375.
Statistical "Leash" Range for Today(3rd SD): $4,855-5,300
The conclusion is immediate and powerful: The Max Pain level of $4.375 lies far outside the probable 3rd standard deviation statistical range.
For the price to reach $4,375, it would need to break not just the 1st, but likely the 2nd or even 3rd standard deviation boundary. While not impossible, this is a very low-probability event.
The Bottom Line: What to Expect
So, will gold collapse to $4,375 tomorrow? Statistically, the odds are heavily against it. The "leash" of volatility is too short.
The theory of Max Pain is a vital tool for identifying points of financial interest, but it's not a crystal ball. It works best when the Max Pain level falls inside the statistical volatility range. When it's outside, volatility almost always wins.
In a hot market like gold, where every dip is being bought, a low-probability statistical move becomes even less likely.
Instead of a crash to Max Pain, a more probable scenario is for the price to remain pinned within its statistical range (for today $4,855-5,300), possibly testing the lower bound of that range.
I hope this article has sparked your interest in diving deeper into these topics and prompted you to start incorporating statistical data into your trading decisions. This is precisely the kind of edge that is essential for successful practical trading
💰 Check our account bio for more ADVANTAGE! Trade Smart!

AUD/CAD Market Analysis: Macro + Structure [MaB]1. The Macro Context (The "Why") 🌍
Hi traders! Before looking at the candles, let's look at the money. My fundamental scoring table speaks clearly: there is a huge differential that we cannot ignore.
Key Factor Analysis:
🏦 Rate Expectations: Explanation: The RBA maintains a neutral stance with a prolonged holding trend at 3.6%, while the BOC is in a pause phase following an October cut, maintaining a dovish stance with potential for further cuts. Score AUD: 0 Score CAD: -1
🎈 Inflation: Explanation: Australian inflation is at 3.4%, above target but manageable, allowing the RBA to maintain its current stance. Canadian inflation is well-controlled at 2.22%, very close to the 2% target. Score AUD: +1 Score CAD: 0
📈 Growth/GDP: Explanation: Australia shows robust resilience with 2.3% growth despite high inflation. Canada's growth is more modest but sustainable at 1.6%. Score AUD: +1 Score CAD: 0
🏭 PMI Data: Explanation: AUD PMI is showing strong expansion at 54.2 (weighted). CAD Ivey PMI is at 51.9, indicating expansion and a strong recovery of +3.5 points. Score AUD: +1 Score CAD: +1
⚖️ Risk Sentiment: Explanation: Both currencies are currently in a neutral regime with no clear directional bias from risk sentiment. Score AUD: 0 Score CAD: 0
🗞️ News Catalyst: Explanation: No significant secondary data surprises for AUD recently, while CAD faces a weaker labour market with a high unemployment rate of 5.4%. Score AUD: 0 Score CAD: -1
Currency Score Summary:
Total Score AUD: +4 (Strong) Total Score CAD: -1 (Weak)
Synthesis:
AUD (Strong, Score +4): Resilient economy with solid growth and competitive rates for carry trade. CAD (Weak, Score -1): Mixed performance with a dovish BOC stance and a softening labour market weighing on the currency. Conclusion: With this scenario, we are only looking for Long positions. Going against this bias would be statistical suicide.
2. The Technical Setup (The "Where") 📉
Timeframe: 4H | Pair: AUD/CAD
The SMC Market Structure + Price Zones indicator gave us the confirmation we needed for our statistical edge. Here is where the indicator makes the difference. Look at the dashboard on the right, numbers don't lie:
🚀 Continuation Rate (67.7%): We are well above the 60% threshold. This tells us the market is in a healthy, directional trend. Statistically, betting on continuation pays off more than looking for a reversal.
🔥 Streak (1) & Streak Pct (2): We are at the early stages of a new impulse. It's a fresh trend move, giving us room to breathe and capture the expansion.
🔄 Retest (41.1%): The indicator tells us that statistically, when price creates a new Break of Structure (BOS), it retraces into the previous zone only 41.1% of the time. Therefore, it pays to be precise with entry placement in the identified demand zones.
💥 BOS/Ret Rate (61.3%): This parameter tells us that once price retraces inside the previous zone, it has a 61.3% probability of reacting and creating a new BOS.
🎯 Extension Rate (1.85x): The algorithm projects an ambitious target. We expect this move to extend 1.85 times the current pullback leg. That's where we'll take profit.
3. Execution Plan on Chart
Moving to the chart, the SMC Market Structure + Price Zones indicator supports us in pinpointing liquidity to define entry and stop loss:
Entry and Stop Loss: We place a limit entry in the Demand Zone 4H (Cyan Band) at 0.93584 and the stop loss a few pips below the zone at 0.93287.
Take Profit: We leverage the asset's statistical analysis offered by the Extension Rate and place the target by measuring with Fibonacci at 1.8x (conservative) to 1.85x relative to the pullback leg.
Trade Parameters:
Entry Price: 0.93584 Stop Loss: 0.93287 Take Profit: 0.96109
⚠️ Disclaimer: This analysis is based on a proprietary algorithm and is shared exclusively for educational and didactic purposes. It does not constitute financial advice or investment solicitation in any way. Trading involves significant risk.

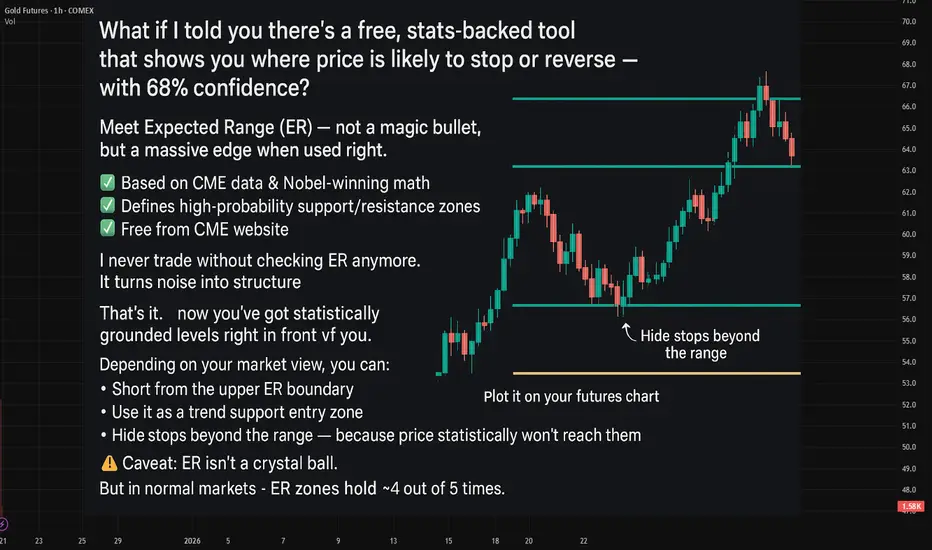
Last week Expected Ranges levels in actionQuick Recap: Last week Expected Ranges levels in action
What is Expected Range Volatility (ER)?
The Expected Range (ER) is a framework that helps traders understand how much an asset is likely to move within a specific timeframe. Based on CME market data and Nobel Prize-winning calculations, price movements within the expected volatility corridor have a 68%-95% probability of staying within those boundaries.
Crude Oil - 6 reactions to levels🔥
EUR - 4 reactions to levels
BTC - 3 reactions
GOLD - 1 reaction to levels
It's really an amazing tool to enhance your market entry💲
!!! - It doesn't guarantee trades every day.
!! it's better to combine it when working with the trend and when there's a clear sideways movement.
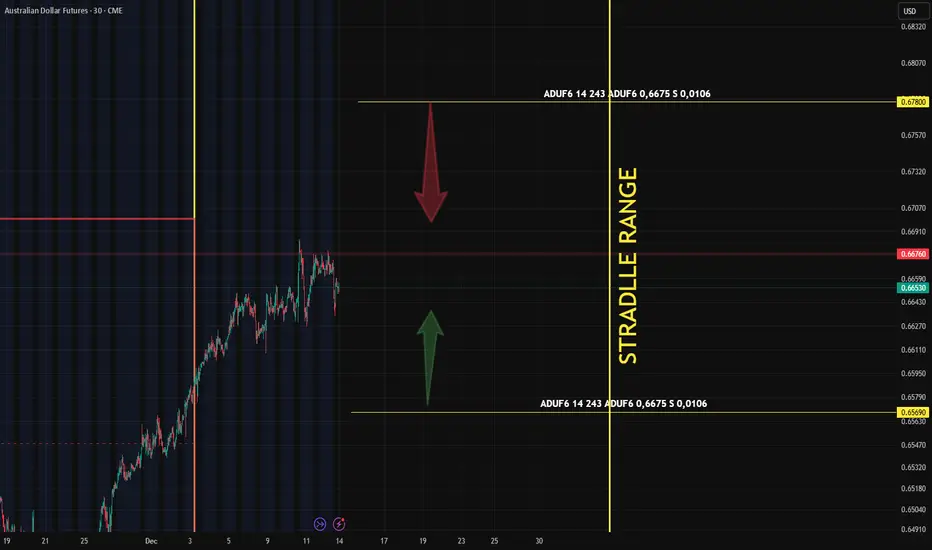
AUD Buy & Sell Levels (Statistical Based)📌 AUD ER Levels for Monday
Worth noting: a Straddle has been placed right at the second tier of key support/resistance levels.
Not massive — ~$200K in premium — but straddles on AUD are rare.
This one deserves attention.
When a straddle aligns with ER boundaries, as it does now, those edges become high-probability reaction zones — ideal for limit entries and stop-loss placement.
📌 Bottom line:
If the Aud soars or crashes next week — and with a packed news calendar ahead, volatility is likely —
we’ll know exactly where to place our limits…
and hide our stops.
Are you using ER? Or still guessing support/resistance?
P.S. Transparency first. No hype. Just real results.
EUR/USD: 92.6% Probability Short SetupMost traders stare at price. We measure the behavior driving it.
On November 10th, Structure Lab's data showed an 89.5% probability EUR/USD would reach the 50% retracement of the prior internal leg. Price hit all three statistical levels we identified — 1.21%, 1.65%, and 1.78% — with tradeable reactions at each.
Now the math points down.
Here's what the data says:
The 1.78% level is likely the high of our Phase B (Pro Swing + Counter Internal) pullback. Phase B complete. Phase C ready to fire.
From here, a Phase C short has:
74% probability of breaking the previous internal low at 1.14687
92.6% probability of hitting the EQ (50% retracement / halfway point) of the last move up
Swing structure remains bullish — this is still the pullback phase. But internal structure is set to push lower.
Green lines mark our downside statistical targets.
📊 1-hour timeframe — price as behavior, not noise.
More high-probability setups dropping every week—follow for statistical edges you won't find anywhere else.
Want the full breakdown? Entry trigger, invalidation, and scaling strategy? Drop a "📊" in the comments and I'll share the complete game plan.
Let me know what you want to see more of. 👇

Swiss Franc: Approaching Key ER SupportThe Swiss franc is now testing the lower boundary of the Expected Range (ER) — a zone for potential pause or bounce.
Also
this ER level aligns perfectly with a visible liquidity cluster (marked with arrow) .
📌 In other words:
It's not only a statistical support — it’s a confluence = higher probability reaction.

When the Data Says EUR/USD Is 89.5% Likely to Go Higher…Most traders stare at price.
We measure the behavior driving it.
What happens when you data-mine market structure itself?
You stop guessing — and start seeing probabilities behind every move.
Structure Lab’s data shows an 89.5% probability that EUR/USD reaches the 50% retracement (EQ) of the prior internal leg — sitting above current price.
Here’s what the data says:
– Swing structure remains bullish (last BOS to the upside)
– Internal structure turned bearish to form the pullback, bottoming Nov 5 in a Phase C configuration (Counter Swing + Pro Internal)
– Now in Phase B (Pro Swing + Counter Internal), pushing higher
Monday printed an inside day — full range inside Friday’s high-low.
Price is drifting lower, stacking buy-side liquidity with descending highs — the kind of structure that often fuels the next impulse.
Three high-probability statistical levels rest above:
1.21%
1.65%
1.78%
(measured from the recent internal low)
Here’s the kicker — 80% of Phase B legs take 5–9 days to complete.
We’re only 2 days in.
The math leans higher.
📊 1-hour timeframe — price as behavior, not noise.
More high-probability setups dropping every week—follow for statistical edges you won't find anywhere else.
Want the full breakdown? Entry trigger, invalidation, and scaling strategy? Drop a "📊" in the comments and I'll share the complete game plan.
Let me know what you want to see more of. 👇

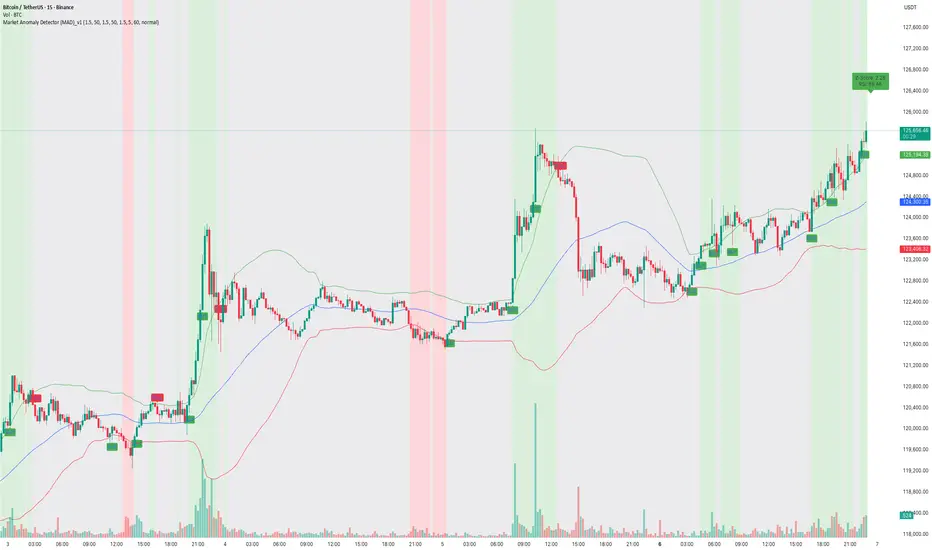
How to capture trend using MAD Indicator!📝 Description:
Watch how the Market Anomaly Detector (MAD) precisely captured the start of the Bitcoin breakout on the 15-minute chart — with no lag, early confirmation, and clear signals.
This BTC/USDT rally was flagged using:
• ✅ Z-Score Spike + RSI confirmation
• ✅ Volume Thrust + Trend Strength Filter
• ✅ Dynamic Zone Coloring for Visual Clarity
• ✅ Trade Cooldown Filter to avoid signal noise
💡 The green background highlights anomaly confirmation zones, while red indicates potential fakeouts or traps.
In this rally:
• The MAD indicator identified the compression breakout
• Maintained bullish zone with no false exit
• Generated a clean trend-following environment using adaptive logic.
🔍 Why MAD Works:
The MAD Indicator isn’t just about spotting anomalies — it adapts based on:
• Market volatility and relative volume
• Internal momentum using z-score logic
• Confirmation from RSI & EMAs
• A cooldown filter to prevent overtrading in choppy zones
📈 Perfect for scalpers, intraday traders, and short-term swing setups on crypto and stocks.
Targeting 1.185: Strategies for Navigating Euro Volatility!A few thoughts on the results of the analysis of Friday's stock exchange reports on the euro/dollar pair
We noticed a portfolio that has entered the market with a target of 1.185, and only have 12 days until expiration. With the current volatility at 10.23, the future price at expiration is expected to be in the range of 1.0993 to 1.1849 — a 95% probability. Interesting, right?
Now, let’s consider two possible scenarios.
The first option : if the price is rapidly moving towards 1.185, it might be wise to think about selling the asset. Why? Because this price will act as a strong resistance level. Two reasons:
First , the expected price range is based on a mathematical formula and statistical data. Second , using leverage embedded in options that are deep out of the money (i.e., far from the current price) presents an excellent opportunity to create a synthetic short position without any risk, even if the market continues to move upward! Sounds unreal? Start learning about options, and a new world of opportunities will open up for you. Your perspective on risk and opportunities will change dramatically!
OK, now let's get back to the point of the post. The second option : if the price consolidates above 1.1436 on the futures, this could signal a buying opportunity.
Taking into account other factors (you can dig deeper using our website's data), the current sentiment is quite bullish and the continuation of the uptrend seems more likely than a correction.
Which path will you choose? Share your thoughts in the comments!
That’s where our market research comes in. Think of it as your “bias detector.” We’ve developed and use it daily to get a second opinion on trades. It’s like having a pro trader whisper, “Hey, this isn’t looking good— think twice.”.
P.S. No pressure, just a chance to trade smarter! No Valuable Data, No Edge!

Why Should You Care About ER?🚀 Hey Traders! Have You Ever Felt Lost in the Chaos of Market Fluctuations?
What if I told you there’s a powerful tool that can help you cut through the noise and give you a statistical edge to predict SUPPORT and RESISTANCE movements with confidence?
Let me take 5 minutes of your time to introduce you to something that could transform your trading game: Expected Range Volatility (ER) .
What is Expected Range Volatility (ER)?
The Expected Range (ER) is a framework that helps traders understand how much an asset is likely to move within a specific timeframe. Based on CME market data and Nobel Prize-winning calculations, price movements within the expected volatility corridor have a 68% probability of staying within those boundaries.
💡 Key Insight: When the price approaching certain levels, there’s a 68% chance the price won’t break through those boundaries. This means you can use ER as a powerful filter to identify more precise entry and exit points for your trades.
Why Should You Care About ER?
When I first discovered the ER tool, it felt like stumbling upon a gold mine in the trading world. Here’s why:
It’s free and available on the CME exchange’s website.
It’s underutilized —95% of traders don’t even know it exists.
It provides statistical clarity in a world full of uncertainty.
I remember the first time I used ER in my analysis—it completely changed the way I approached intraday trading. Now, I never make a trade without checking the ER data. It’s become an essential part of my strategy.
How to Use ER in Your Trading
1️⃣ Input the Data: Head over to the CME website, plug in the necessary parameters, and get your ER values.
2️⃣ Set Boundaries: Use the ER range as a guide to set potential support and resistance levels.
3️⃣ Filter Trades: Only take trades that align with the ER framework to improve your precision.
A recent example is the Japanese yen futures market.
Don't be confused by the fact that we take futures levels, it can easily be plotted on a spot chart for forex market (the dollar/yen).
Limitations to Keep in Mind
While ER is a powerful tool, it’s not a crystal ball. Here are some limitations:
Market Dynamics: Short-term price movements can be unpredictable due to sentiment, news, or economic events. ER provides a statistical estimate, but it doesn’t guarantee outcomes.
Assumptions: The formula assumes price movements follow a log-normal distribution , which may not hold true in all market conditions.
Your Turn: Are You Using ER in Your Strategy?
💭 Here’s the million-dollar question: Are you leveraging the power of Expected Range Volatility in your trading? If not, why not start today?
💬 Share your thoughts in the comments below:
Do you currently use ER or similar statistical tools?
Want to Dive Deeper?
If you’re ready to take your trading to the next level, don’t miss out on our all-in-one resource designed to help you master tools like ER and other valuable sources to gain market edge!
🔥 Remember:
No Valuable Data = No Edge!
