A Thesis Of A Trade: Developing A Story For Each TradeThe plan is the same, but each pair has a different story and different thesis. Previously, I have reported that I open a batch of trades and closing them all when I reach a certain profit percentage based on the Stochastic Plan.
Last week the batch stayed negative, but all are still within the plan and not a single one broke the idea of the reason why they were opened. This opened the door for me to start treating each trade on its own instead of opening and closing batches. This is something that I wanted to implement but did not have the heart for it, especially that this is the first time for me to trade the scary daily time frame.
Today is Monday, and accidentally it is the 1st of the month, and the 1st of December. This month I am going to try to keep at the methodology of treating each trade independently and create a thesis for each trade.
Such a methodology with a thesis for each trade allows, as one of the comments of one of my previous videos here suggested, to create structural Stop Loss and Take Profit points. The thesis will tell a story of the pair. Why I opened the trade and where do I see it going based on the stochastic trigger and the chart elements.
The thesis will also show when is the thesis going to be negated and no more stands and therefore needs to be stopped even at a loss. A break of thesis means that the reason why a trade was opened no longer exists and I need to get out of it.
In the same manner, the thesis will look at the chart elements and see potential areas where the price might stop moving in my direction and this is again a point where I would close the trade in my favor.
Everyday now I feel closer to reaching a solid Forex trading plan that I can depend on, and the day of funding a live account is getting closer. I am looking at funding an account by the end of this month to start the year 2026 trading live.
Stochasticoscillator

Improving My Win Loss Ratio In Forex Trading Achieved With 9.92%Not only I was able to achieve my Win Loss Ratio but I was able to make 9.92% profit in three weeks.
Improving my win loss ration in Forex Trading in this manner was amazing. Even when I started the improvements I didn't imagine I will turn the table 180 degrees. I was going to accept my Win Loss ratio to skew towards the loss side. With a good RRR the balance would still increase. But the result that I got is that my Win Loss is now 17:11 while before was something like 4:14. I don't have the exact old Win Loss ration anymore as the formula was damaged.
The search for a solid Forex Trading Plan is not over yet. The plan that I have is still scary and very risky, as it does not have any Stop Loss or Take Profit in it. I open several positions and then close them all as one batch once they reach an acceptable percentage of the current balance.
With the current method of closing the whole batch I am still leaving money on the table, and since I am trading the daily timeframe, a position trigger does not come easily. Trading this time frame is really scary and intimidating not to mention that I am trading it without any stop loss or take profit.
Unfortunately, I still didn't find a way to include those protections yet, but next week I will try to solve the challenge of leaving money on the table. Next week I will start dealing with each trade as a thesis of its own. Each trade will have it own story. Once the story approaches its end I will close the trade whether it is winning or losing.
Meaning, the thesis that opened the trade needs to change to close the trade. I am testing if I will have the stomach for such a scary ride.

My Steps On how To Improve Forex Trading Win / Loss Ratio In this video we talk about the three elements of the new plan that I have designed based on different types of schools and educational sources.
The plan elements consist of SMC (Smart Money Concepts), Classical School (Support & Resistance, Trend Lines, Febonacci Retracement (not all the time)), and the Stochastic Indicator.
The stochastic is of two timeframes, One is weekly and the other is daily but both are shown on the daily timeframe. This is something that I loved here about TradingView; is the ability to show an indicator of a different timeframe.
Last week I opened a couple of positions based on the new plan, but one of them was opened with haste and not totally adhered to my trading Plan rules.
I show the exact trading rules that I am using and how this will affect my risk management plan.

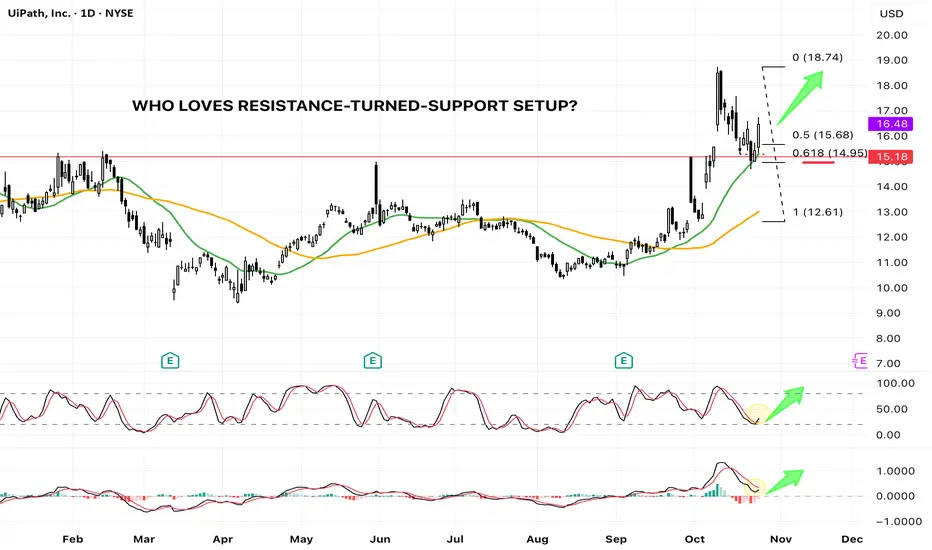
PATH - Textbook R/S Flip at Key Fib & MA Support (Bullish Setup)UiPath ( NYSE:PATH ) spent the majority of 2025 range-bound, oscillating between the $10 and $15 marks. This consolidation phase ended dramatically in early October, when the price decisively breached the long-standing 2025 horizontal resistance at approximately $15.
The breakout led to a swift rally, tagging a new year-to-date high of $18.74 . Following this strong move, the stock began a healthy retracement, pulling back to test the very level that had previously acted as resistance—the classic Resistance-Turned-Support (R/S Flip) setup.
The Confluence of Support
This current pullback is resting on a powerful confluence of technical supports, significantly increasing the probability of a bullish continuation:
1. Horizontal Support: The previous major resistance line (around $15) now acts as a crucial horizontal support.
2. Moving Average Support: The price is testing the 20-day Simple Moving Average (SMA 20, Green Line) . Importantly, this is the first time the price has pulled back to the SMA 20 since the bullish SMA 20/SMA 50 Golden Cross , signaling a strong trend retest.
3. Fibonacci Golden Pocket: The retracement has landed perfectly into the 0.618 Fibonacci Retracement level (from the $12.61 swing low to the $18.74 swing high), a statistically significant reversal zone often called the "Golden Ratio."
Momentum Indicators Confirm Bullish Bias
Beyond the price action, our auxiliary indicators are flashing constructive signals:
* Stochastic: The Stochastic oscillator is reversing from the oversold territory and is showing a clear bullish cross , indicating waning selling pressure and the start of a new upward momentum cycle.
* MACD: The Moving Average Convergence Divergence (MACD) indicator is attempting a bullish cross above the zero line , a powerful sign of increasing positive momentum.
Conclusion
The confluence of price action and indicator signals presents a high-probability bullish setup. The market is currently rewarding the successful test of the R/S flip at the 0.618 Fib and SMA 20 support.
While this setup suggests a strong likelihood for the next leg higher, traders must remember that trading involves probabilities. A clearly defined stop-loss is essential to manage risk should the market invalidate this robust support zone.
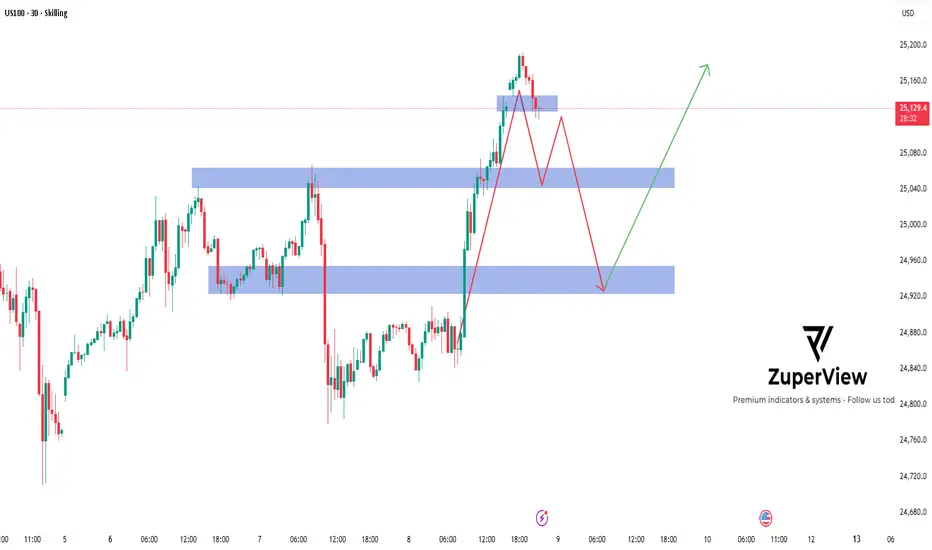
US100: Potential reversal from overbought zone
Symbol: SKILLING:US100
Timeframe: 30 Minutes
Indicators: OB/OS Overlap (RSI, MFI, Stochastic) + S/R
________________________________________
🔍 Quick Summary
After a strong rally 🚀 from the 24,750–24,800 support area, US100 has reached the 25,280–25,300 resistance zone — where multiple oscillators are showing overbought signals.
This suggests potential profit-taking or a technical correction may occur soon.
________________________________________
📊 Price Structure
• Price formed a temporary top after tapping the overbought area, with clear rejection candles near resistance.
• A pullback toward the first support zone around 25,000–25,050 could occur before the next move.
• If selling pressure continues, the next target area lies near 24,800–24,850, where previous structure and demand overlap 📉.
________________________________________
🧩 Technical Highlights
• OB/OS Overlap: RSI, MFI, and Stochastic are all in overbought territory (3/3 alignment) — a strong early signal of potential short-term exhaustion.
• Price Action: A minor double top or bearish divergence may be forming if momentum indicators continue to decline.
• Key Zones: Blue zones on the chart mark areas of potential buyer reaction (demand).
________________________________________
🧭 Scenario Outlook
Main Scenario (🔻 Pullback Expected):
Price could retrace toward 25,000–24,850 before buyers attempt a rebound.
Alternative Scenario (🚀 Continuation):
If the price holds above 25,100 and breaks 25,280, the bullish momentum might continue short-term.
________________________________________
⚙️ Risk Note
This analysis is for educational purposes only and not financial advice.
Always manage risk carefully and align your trade plan with your own strategy 📘💡.
Market conditions can change rapidly — stay flexible and objective!
Please like and comment below to support our traders. Your reactions will motivate us to do more analysis in the future 🙏✨
Harry Andrew @ ZuperView
How to Trade with Stochastics in TradingViewMaster Stochastics using TradingView’s charting tools in this comprehensive tutorial from Optimus Futures.
The Stochastic Oscillator is a momentum indicator that helps traders identify potential turning points in the market by comparing the current closing price to the recent high–low range. It’s designed to show when momentum may be shifting from buyers to sellers — or vice versa.
What You’ll Learn:
- Understanding the Stochastic Oscillator as a momentum tool plotted from 0 to 100
- How the %K line represents the current close relative to the recent high–low range
- How the %D line acts as a moving average of %K and serves as a signal line
- Key thresholds: readings above 80 suggest overbought conditions, while below 20 suggest oversold conditions
- Why overbought and oversold levels are not automatic buy or sell signals — and how strong trends can keep Stochastics extended
- Identifying bullish and bearish crossovers between %K and %D
- Spotting bullish and bearish divergence between price and momentum
- Using Stochastics to confirm trend direction across different timeframes
- How to add Stochastics on TradingView via the Indicators menu
- Understanding the default settings (14, 3, 3) and how adjusting them affects responsiveness
- Practical examples on the E-mini S&P 500 futures chart
- Applying Stochastics across multiple timeframes — daily, weekly, or intraday — for confirmation signals
This tutorial will benefit futures traders, swing traders, and technical analysts who want to incorporate Stochastics into their trading process.
The concepts covered may help you identify momentum shifts, potential reversal zones, and trend confirmations across different markets and timeframes.
Learn more about futures trading with TradingView:
optimusfutures.com
Disclaimer
There is a substantial risk of loss in futures trading. Past performance is not indicative of future results. Please trade only with risk capital. We are not responsible for any third-party links, comments, or content shared on TradingView. Any opinions, links, or messages posted by users on TradingView do not represent our views or recommendations. Please exercise your own judgment and due diligence when engaging with any external content or user commentary.
This video represents the opinion of Optimus Futures and is intended for educational purposes only.
Chart interpretations are presented solely to illustrate objective technical concepts and should not be viewed as predictive of future market behavior. In our opinion, charts are analytical tools — not forecasting instruments.

Is Palantir (PLTR) Entering a Consolidation Phase? A Technical aTechnical Analysis: Palantir Technologies (PLTR) Amid Overbought Signals and Valuation Gaps
Palantir Technologies Inc. (NASDAQ: PLTR) has experienced significant volatility in recent sessions, reflecting growing uncertainty among investors regarding its valuation and technical positioning. The stock closed at $173.07, down by 7.47%, after testing its resistance area near $186. Both daily and weekly technical indicators are now suggesting that a potential short-term correction could be underway.
Weekly Chart Outlook: Approaching Resistance After a Prolonged Rally
From the weekly timeframe, NASDAQ:PLTR has been trending upward since early April, supported by consistent higher lows and strong momentum in the technology sector. The recent breakout above the $160–$165 zone confirmed bullish sentiment, but the latest candlestick formation shows rejection near $186, indicating profit-taking pressure.
The Stochastic RSI on the weekly chart is hovering in the overbought zone, signaling that the rally may be losing strength. While this does not necessarily imply an immediate reversal, it often precedes a consolidation phase or a short-term pullback. Volume patterns also show a slight decline compared to the early phase of the uptrend, reinforcing the possibility of slowing momentum.
Additionally, the price is now slightly extended from its key moving averages, suggesting that any correction toward the $160–$165 support zone would still maintain the longer-term bullish structure.
Daily Chart Confirmation: Stochastic RSI and MACD Turning Cautious
Read full analysis on my website :
darrismanresearch com

Oil at the crossroads - buy zone or bear trap?Technically , WTI is testing the lower boundary of a converging wedge, hovering around the identified buy zone. Holding above 62–63 is critical for bulls, as a breakdown would expose targets at 61.30 and 58.80. Conversely, a rebound from current levels could trigger a move toward 70.50 and even 77.60 if momentum builds. The daily stochastic hints at a potential reversal to the upside, suggesting that a short-term bounce may be in play.
Fundamentally , the outlook remains tense: weak demand from China and global economic uncertainty are weighing on prices, while OPEC+ continues to maintain control over supply. U.S. inventory swings, with alternating builds and exports, add to volatility. Overall, the setup looks neutral with elevated risk - macro data could easily tip the balance either way.
Tactically , the market is facing a binary scenario: sustained strength above 63 opens the way to 70.50 and 77.60, while failure here brings 58.80–55.60 into focus.
In short, oil is at a crossroads and the next decisive move depends on whether bulls can hold the line.

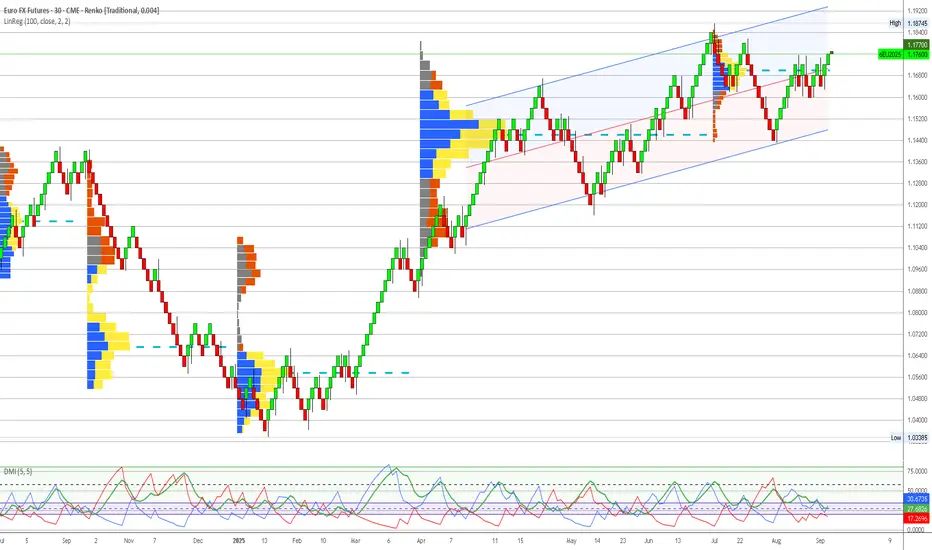
Euro Futures (6E) - Technical Analysis Report - 20250908Analysis Date: September 8, 2025
Current Price: 1.1742
Market Session: Post-Market Analysis
---
Executive Summary
Euro Futures presents the strongest technical setup among analyzed markets, with exceptional execution chart alignment despite moderate institutional positioning. The currency pair has emerged from a major bottoming pattern with validated bullish momentum signals across all timeframes. While institutional accumulation is less pronounced than in commodity markets, the technical breakout quality and central bank policy divergence create compelling risk/reward opportunities.
---
Quarterly Volume Profile Analysis
Institutional Positioning Intelligence
The quarterly volume profile (Q3 2025) reveals moderate but strategically positioned institutional activity in the Euro:
Primary Institutional Activity Zone: 1.1550-1.1700
Moderate blue volume concentration representing institutional positioning during major low formation
Current price (1.1742) trades at upper boundary of institutional accumulation zone
Volume profile shows classic bottoming pattern with accumulation at major support levels
Institutional activity concentrated around key technical support levels from previous cycles
Volume Profile Architecture:
Core Accumulation: 1.1580-1.1650 (primary institutional positioning)
Extended Support: 1.1450-1.1550 (secondary institutional interest)
Breakout Level: 1.1700-1.1750 (current resistance/breakout zone)
Void Zone: Above 1.1800 (minimal resistance, potential acceleration territory)
Resistance Structure Analysis:
1.1750-1.1800: Initial resistance with mixed volume activity
1.1850-1.1900: Moderate yellow volume indicating previous distribution
1.1950+: Historical distribution zones from earlier 2025 highs
Price Structure Context
Historical Pattern Recognition:
The current Euro setup displays textbook currency reversal characteristics following a major multi-month decline. The institutional accumulation at 1.1550-1.1700 represents strategic positioning by smart money during the formation of a significant low, typical of major currency cycle turning points.
Critical Structure Validation:
Institutional Floor: 1.1450 represents absolute lower boundary of smart money positioning
Volume Point of Control: 1.1620 shows peak institutional activity within accumulation zone
Breakout Validation: Current price above institutional accumulation confirms technical breakout
Risk Definition: Clear institutional boundaries provide precise risk management parameters
Central Bank Policy Context
Policy Divergence Supporting Euro Strength:
European Central Bank maintaining restrictive policy stance
Federal Reserve approaching policy pivot with potential dovish shift
Interest rate differential dynamics favoring Euro in medium term
Quantitative tightening policies supporting European currency fundamentals
---
Execution Chart Technical Analysis
Current Technical Configuration - EXCEPTIONAL BULLISH ALIGNMENT
DEMA Analysis - STRONGEST BULLISH SIGNAL IN ANALYZED MARKETS:
Black Line (Fast DEMA 12): Currently at 1.1742
Orange Line (Slow DEMA 20): Currently at 1.1712
Configuration: Perfect bullish crossover with expanding gap
Trend Bias: Strongest technical momentum across all analyzed markets
DMI/ADX Assessment - CONFIRMED TRENDING CONDITIONS:
ADX Level: 35+ indicating strong directional movement
+DI vs -DI: +DI clearly dominant over -DI with expanding spread
Momentum Direction: Confirming sustained bullish bias with conviction
Trend Strength: ADX rising confirms institutional and technical alignment
Stochastic Analysis - HEALTHY MOMENTUM STRUCTURE:
Tactical Stochastic (5,3,3): Bullish configuration with room for extension
Strategic Stochastic (50,3,3): Confirming longer-term bullish momentum shift
Divergence Analysis: No negative divergences, clean momentum structure throughout
Support and Resistance Levels
Immediate Technical Levels:
Current Support: 1.1710 (DEMA 20 orange line)
Key Support: 1.1680 (recent breakout consolidation)
Major Support: 1.1620 (institutional accumulation core)
Immediate Resistance: 1.1780 (near-term extension target)
Key Resistance: 1.1820 (major resistance zone)
Major Resistance: 1.1900 (significant distribution zone)
---
Trading Scenarios and Setup Criteria
Scenario 1: Continuation Long Setup (PRIMARY)
Optimal Conditions for Long Entry:
DEMA bullish maintenance: Black line remaining above orange line with gap expansion
DMI confirmation: +DI sustaining dominance over -DI with strengthening ADX
Breakout validation: Price holding above 1.1700 breakout level
Volume confirmation: Increased volume supporting upward momentum
Policy support: Central bank divergence maintaining fundamental backdrop
Entry Protocol:
Primary Entry: Current levels 1.1740-1.1760 (validated breakout zone)
Secondary Entry: 1.1710-1.1720 on any pullback to DEMA support
Position Sizing: Aggressive 2.5% account risk given exceptional technical setup
Stop Loss: Below 1.1680 (breakout failure)
Profit Targets:
Target 1: 1.1820 (first major resistance) - Take 40% profits
Target 2: 1.1900 (distribution zone approach) - Take 30% profits
Target 3: 1.1980-1.2000 (major resistance complex) - Trail remaining 30%
Scenario 2: Pullback Accumulation Setup (SECONDARY)
Conditions for Pullback Entry:
Price retracement to 1.1700-1.1720 breakout support zone
DEMA holding bullish configuration during pullback
Stochastic oversold providing tactical entry signal
Volume profile respect at breakout support levels
Pullback Setup Parameters:
Entry Range: 1.1700-1.1720 (breakout support zone)
Stop Loss: Below 1.1680 (breakout invalidation)
Targets: Same as primary scenario with enhanced risk/reward
Position Sizing: Maximum allocation given superior entry point
Scenario 3: Acceleration Breakout Setup (AGGRESSIVE)
Breakout Trading Framework:
Acceleration Level: Above 1.1800 (void zone entry)
Volume Confirmation: Significant volume expansion supporting breakout
Technical Validation: DEMA gap expansion with ADX above 40
Momentum Persistence: +DI expanding dominance over -DI
Acceleration Parameters:
Entry: 1.1805-1.1820 on confirmed acceleration
Stop: Below 1.1750 (failed acceleration)
Extended Targets: 1.1950, 1.2000, 1.2050+
Position Management: Trail stops using 0.004 structure levels
---
Risk Management Protocols
Position Sizing Guidelines
Aggressive Approach (Recommended for 6E):
Maximum Risk: 2.5% of account (increased allocation due to exceptional technical quality)
Contract Calculation: Account Size × 0.025 ÷ (Stop Distance × $12.50 per pip)
Example: $100,000 account with 60-pip stop = 33 contracts maximum
Rationale: Strongest technical setup justifies aggressive allocation
Stop Loss Hierarchy
Tactical Stop: 1.1710 (DEMA support)
Strategic Stop: 1.1680 (breakout support)
Emergency Stop: 1.1650 (institutional accumulation boundary)
Profit Management Framework
Systematic Profit Taking:
First Target (40%): Lock in profits at initial resistance zone
Second Target (30%): Capture extended move through distribution areas
Final Position (30%): Trail for potential acceleration beyond 1.2000
Trail Stop Method: Use 0.004 structure chart levels once in profit
---
Market Context and External Factors
Fundamental Catalysts Supporting Euro Strength
Central Bank Policy Dynamics:
ECB maintaining restrictive stance longer than Fed
Interest rate differential shifting in favor of Euro
Quantitative tightening supporting currency fundamentals
Inflation dynamics favoring European monetary policy
Economic Factors:
European energy security improvements reducing volatility
Manufacturing sector stabilization supporting economic outlook
Current account dynamics favoring Euro strength
Political stability improving investor confidence
Technical Market Structure
Currency Market Positioning:
Speculative positioning showing Euro oversold conditions reversing
Commercial hedger activity supporting Euro strength
Cross-currency relationships confirming Dollar weakness
Volatility patterns suggesting sustained directional move
---
Monitoring Checklist and Alert Levels
Daily Monitoring Requirements
DEMA Configuration: Maintain bullish black above orange relationship
Breakout Respect: Confirm price behavior above 1.1700 breakout level
Volume Analysis: Monitor for volume expansion on upward moves
Central Bank Events: ECB and Fed policy statements, economic data releases
Dollar Correlation: Monitor relationship with DXY and other major currency pairs
Critical Alert Levels
Bullish Escalation Alerts:
Break above 1.1800 with volume expansion
DEMA gap expansion beyond 30 pips
+DI moving above 40 with ADX persistence above 40
ECB hawkish policy statements supporting fundamental backdrop
Risk Management Alerts:
DEMA bearish crossover (black below orange)
Break below 1.1700 breakout support level
ADX declining below 25 indicating momentum loss
Fed policy pivot announcements affecting interest rate differential
---
Strategic Outlook and Conviction Assessment
Risk/Reward Analysis
Exceptional Setup Characteristics:
Risk: 60 pips to breakout support (1.1680)
Reward: 150+ pips to first major resistance (1.1900+)
Risk/Reward Ratio: 2.5:1 minimum, potential 4:1+
Probability Assessment: High (80%+) based on technical breakout quality
Portfolio Allocation Recommendation
Maximum Technical Conviction Positioning
Euro Futures represents the highest quality technical setup in the current market environment. The exceptional alignment of DEMA crossover, DMI momentum, and validated breakout above institutional accumulation creates optimal conditions for aggressive positioning. While institutional accumulation is less pronounced than in commodities, the technical execution quality and central bank policy support justify maximum allocation within risk parameters.
Allocation Framework:
Primary Portfolio Weight: 20-25% (maximum technical conviction)
Entry Method: Immediate positioning with scale-in capability on pullbacks
Hold Period: Expect 3-8 week position duration
Exit Strategy: Systematic profit-taking at technical resistance levels
---
Conclusion and Strategic Assessment
Euro Futures presents the strongest technical setup among all analyzed markets, with exceptional DEMA crossover quality and validated breakout above institutional accumulation. While the institutional positioning is less dramatic than commodity accumulation patterns, the technical execution signals are pristine and supported by favorable central bank policy dynamics. Current positioning above breakout support offers superior risk/reward characteristics with clearly defined parameters for both profit-taking and risk management.
Implementation Priority: Immediate aggressive positioning recommended - this technical setup quality represents the gold standard for momentum-based entries with institutional validation.
Next Review: Daily monitoring of DEMA configuration and breakout level respect
Position Management: Systematic profit-taking protocol with trailing stops at technical levels
---
Important Disclaimer
Risk Warning and Educational Purpose Statement
This analysis is provided for educational and informational purposes only and does not constitute financial advice, investment recommendations, or trading signals. All trading and investment decisions are solely the responsibility of the individual trader or investor.
Key Risk Considerations:
Futures trading involves substantial risk of loss and is not suitable for all investors
Past performance does not guarantee future results
Market conditions can change rapidly, invalidating any analysis
Leverage can amplify both profits and losses significantly
Individual financial circumstances and risk tolerance vary greatly
Professional Guidance: Before making any trading decisions, consult with qualified financial advisors, conduct your own research, and ensure you fully understand the risks involved. Only trade with capital you can afford to lose.
Methodology Limitations: Volume profile analysis and technical indicators are tools for market assessment but are not infallible predictors of future price movement. Market dynamics include numerous variables that cannot be fully captured in any single analytical framework.
The views and analysis presented represent one interpretation of market data and should be considered alongside other forms of analysis and individual judgment.
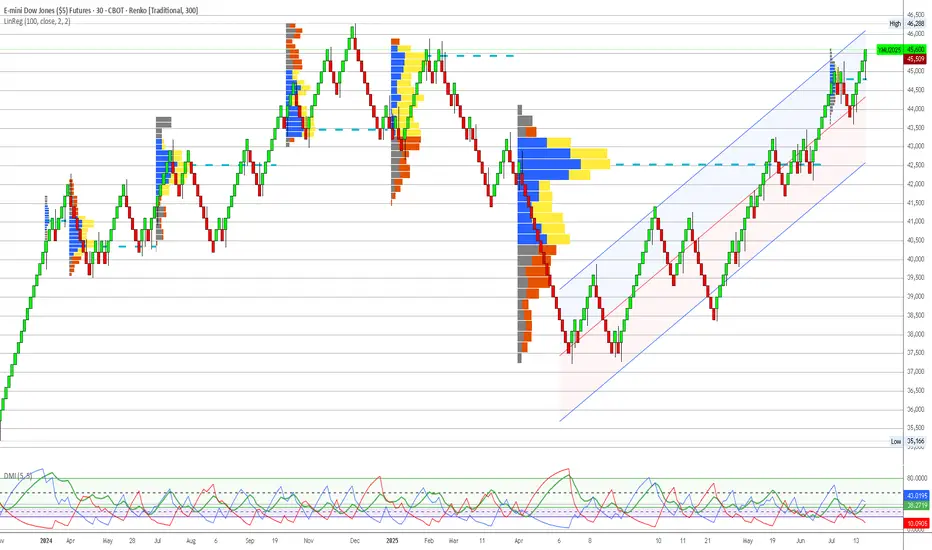
Dow Jones (YM) - Technical Analysis Report - 20250908Analysis Date: September 8, 2025
Current Price: 45,537
Market Session: Post-Market Analysis
---
Executive Summary
Dow Jones presents a moderately extended equity position with manageable risk characteristics compared to other major indices. While trading above institutional accumulation levels, the extension is less severe than S&P 500 or Nasdaq, making it the least dangerous of the equity exposures. However, institutional positioning analysis reveals limited upside potential with asymmetric risk favoring defensive strategies.
---
Quarterly Volume Profile Analysis
Institutional Positioning Intelligence
The quarterly volume profile (Q3 2025) reveals a concerning pattern typical of extended equity markets in late-cycle environments:
Primary Institutional Activity Zone: 42,000-43,500
Moderate blue volume concentration representing historical institutional positioning
Current price (45,537) trades approximately 2,000+ points above primary accumulation
Volume density significantly lighter than commodity accumulation patterns
Institutional activity appears distributed rather than concentrated
Extension Analysis:
Core Accumulation: 42,500-43,000 (peak institutional activity)
Extended Zone: 43,500-44,500 (moderate institutional interest)
Current Level: 45,537 (approximately 5-7% above institutional positioning)
Void Risk: Above 46,000 (minimal institutional support visible)
Resistance Structure Analysis:
45,800-46,200: Immediate resistance with mixed volume activity
46,500-47,000: Historical distribution zones from previous highs
47,500+: Complete institutional void representing extreme overextension
Price Structure Context
Historical Pattern Recognition:
The current Dow Jones setup displays classic late-cycle equity characteristics where price has methodically ground higher above institutional accumulation zones. Unlike the catastrophic voids seen in S&P 500 and Nasdaq, YM shows a more measured extension that may be sustainable in the near term.
Relative Risk Assessment:
Manageable Extension: 5-7% above institutional levels vs 15%+ in other indices
Blue-Chip Nature: Dow composition includes more defensive, dividend-paying companies
Institutional Memory: Historical support levels around 42,000-43,000 well-established
Risk Definition: Clear institutional boundaries provide defensive positioning reference
Sector Composition Considerations
Dow Jones Defensive Characteristics:
Utilities and consumer staples providing defensive anchor
Financial sector exposure to interest rate sensitivity
Industrial components reflecting economic cycle positioning
Technology weight lower than growth-focused indices
---
Execution Chart Technical Analysis
Current Technical Configuration - DETERIORATING MOMENTUM
DEMA Analysis - WARNING SIGNALS EMERGING:
Black Line (Fast DEMA 12): Currently at 45,537
Orange Line (Slow DEMA 20): Currently at 45,480
Configuration: Bullish but narrowing gap indicating momentum loss
Trend Bias: Technical momentum weakening despite bullish configuration
DMI/ADX Assessment - MOMENTUM DETERIORATION:
ADX Level: Declining from previous highs, currently around 25-30
+DI vs -DI: +DI losing dominance, -DI starting to gain ground
Momentum Direction: Showing signs of exhaustion after extended advance
Trend Strength: Weakening ADX suggests institutional conviction fading
Stochastic Analysis - OVERBOUGHT CONDITIONS:
Tactical Stochastic (5,3,3): Overbought territory with negative divergence
Strategic Stochastic (50,3,3): Extended levels showing momentum fatigue
Divergence Analysis: Price making new highs while momentum indicators lag
Support and Resistance Levels
Critical Technical Levels:
Current Resistance: 45,800 (near-term extension limit)
Key Resistance: 46,200 (major resistance zone)
Major Resistance: 46,800 (dangerous overextension territory)
Immediate Support: 45,200 (DEMA cluster)
Key Support: 44,500 (institutional extension boundary)
Major Support: 42,500-43,000 (primary institutional accumulation)
---
Trading Scenarios and Setup Criteria
Scenario 1: Defensive Profit-Taking Setup (PRIMARY)
Optimal Conditions for Position Reduction:
DEMA momentum loss: Gap narrowing between black and orange lines
DMI deterioration: -DI gaining on +DI with weakening ADX
Stochastic overbought: Both timeframes showing exhaustion signals
Volume analysis: Declining volume on any advance attempts
Resistance respect: Failure to break above 46,000 cleanly
Profit-Taking Protocol:
Primary Action: Reduce positions by 50-75% at current levels
Secondary Reduction: Complete exit on any bounce to 46,000+
Stop Management: Trail stops using 300-point intervals
Cash Allocation: Redirect capital to commodity opportunities
Scenario 2: Range-Trading Setup (SECONDARY)
Conditions for Tactical Range Trading:
Defined range: 44,500-45,800 (institutional boundary to resistance)
DEMA maintaining bullish bias within range
Volume profile respect at key levels
ADX below 25 indicating sideways consolidation
Range Trading Parameters:
Long Zone: 44,500-44,800 (institutional boundary approach)
Short Zone: 45,600-45,800 (resistance approach)
Stop Distance: 300-450 points maximum
Position Size: Reduced allocation (1% account risk maximum)
Scenario 3: Breakdown Short Setup (AGGRESSIVE)
Short Entry Conditions:
DEMA bearish crossover: Black line breaking below orange line
Support violation: Break below 44,500 institutional boundary
Volume confirmation: Increased volume supporting breakdown
DMI alignment: -DI gaining clear dominance over +DI
Short Setup Parameters:
Entry Range: 44,200-44,400 on confirmed breakdown
Stop Loss: Above 45,000 (failed breakdown)
Targets: 43,000, 42,500, 42,000 (institutional accumulation zones)
Risk Management: Tight stops given counter-trend positioning
---
Risk Management Protocols
Position Sizing Guidelines
Conservative Approach (Strongly Recommended):
Maximum Risk: 1% of account (reduced from standard due to extension risk)
Contract Calculation: Account Size × 0.01 ÷ (Stop Distance × $5)
Example: $100,000 account with 400-point stop = 50 contracts maximum
Rationale: Extended positioning requires defensive allocation
Stop Loss Hierarchy
Tactical Stop: 45,000 (execution chart support cluster)
Strategic Stop: 44,500 (institutional extension boundary)
Emergency Stop: 43,800 (institutional accumulation approach)
Portfolio Management Framework
Defensive Positioning Strategy:
Current Holdings: Reduce exposure by 50-75%
New Positions: Avoid until return to institutional levels
Capital Reallocation: Redirect to commodity opportunities (NG, CL)
Monitoring Frequency: Daily assessment of momentum deterioration
---
Market Context and External Factors
Fundamental Considerations Affecting Dow Performance
Economic Cycle Positioning:
Federal Reserve policy uncertainty affecting financial sector components
Industrial sector sensitivity to economic slowdown concerns
Consumer discretionary weakness impacting retail components
Utility sector providing defensive characteristics in uncertain environment
Sector Rotation Implications:
Value vs growth rotation potentially favoring Dow components
Dividend yield advantage in higher interest rate environment
Defensive sector weighting providing relative outperformance potential
International exposure through multinational components
Technical Market Structure
Relative Performance Analysis:
Outperforming S&P 500 and Nasdaq on risk-adjusted basis
Less extended from institutional levels than growth indices
Better volume profile support at key technical levels
Defensive sector composition providing downside protection
---
Monitoring Checklist and Alert Levels
Daily Monitoring Requirements
DEMA Configuration: Watch for gap narrowing or bearish crossover
Institutional Respect: Monitor behavior at 44,500 extension boundary
Volume Analysis: Track volume patterns on any advance attempts
Sector Rotation: Monitor defensive vs growth sector performance
Correlation Analysis: Track relationship with bond yields and dollar strength
Critical Alert Levels
Risk Escalation Alerts:
DEMA bearish crossover below 45,400
Break below 44,500 institutional extension boundary
Volume breakdown with accelerating selling pressure
ADX rising with -DI dominance confirming bearish momentum
Defensive Action Triggers:
Any failure to break above 46,000 on multiple attempts
Stochastic negative divergence with price at new highs
Sector rotation away from Dow components toward defensives
Federal Reserve policy announcements affecting interest rate expectations
---
Strategic Outlook and Risk Assessment
Risk/Reward Analysis
Asymmetric Risk Profile:
Upside Potential: Limited 500-800 points to dangerous overextension
Downside Risk: 2,000+ points to institutional accumulation zones
Risk/Reward Ratio: Unfavorable 1:3+ downside vs upside
Probability Assessment: Moderate (40%) for further upside, High (70%) for correction
Portfolio Allocation Recommendation
Defensive Positioning Required
Dow Jones represents the least dangerous equity exposure in current market conditions but still requires defensive management. The 5-7% extension above institutional levels, while manageable compared to other indices, suggests limited upside potential with significant correction risk. Priority should be placed on systematic profit-taking and capital reallocation to higher-conviction commodity opportunities.
Allocation Framework:
Current Portfolio Weight: Reduce to 5-8% maximum (from previous levels)
Entry Method: Avoid new positions until institutional level return
Hold Period: Short-term tactical only, exit on weakness
Exit Strategy: Systematic reduction on any bounce attempts
---
Conclusion and Strategic Assessment
Dow Jones offers the best risk profile among equity indices but remains fundamentally challenged by extension above institutional positioning. The defensive sector composition and less severe overextension provide relative safety, but the asymmetric risk profile strongly favors capital preservation over growth seeking. Current conditions warrant defensive positioning with readiness to exit entirely on any momentum deterioration.
Strategic Priority: Capital preservation and systematic risk reduction while maintaining readiness for complete exit if institutional extension boundaries are violated.
Next Review: Daily monitoring of momentum indicators and institutional level approach
Position Management: Systematic profit-taking with defensive stop management
---
Important Disclaimer
Risk Warning and Educational Purpose Statement
This analysis is provided for educational and informational purposes only and does not constitute financial advice, investment recommendations, or trading signals. All trading and investment decisions are solely the responsibility of the individual trader or investor.
Key Risk Considerations:
Futures trading involves substantial risk of loss and is not suitable for all investors
Past performance does not guarantee future results
Market conditions can change rapidly, invalidating any analysis
Leverage can amplify both profits and losses significantly
Individual financial circumstances and risk tolerance vary greatly
Professional Guidance: Before making any trading decisions, consult with qualified financial advisors, conduct your own research, and ensure you fully understand the risks involved. Only trade with capital you can afford to lose.
Methodology Limitations: Volume profile analysis and technical indicators are tools for market assessment but are not infallible predictors of future price movement. Market dynamics include numerous variables that cannot be fully captured in any single analytical framework.
The views and analysis presented represent one interpretation of market data and should be considered alongside other forms of analysis and individual judgment.
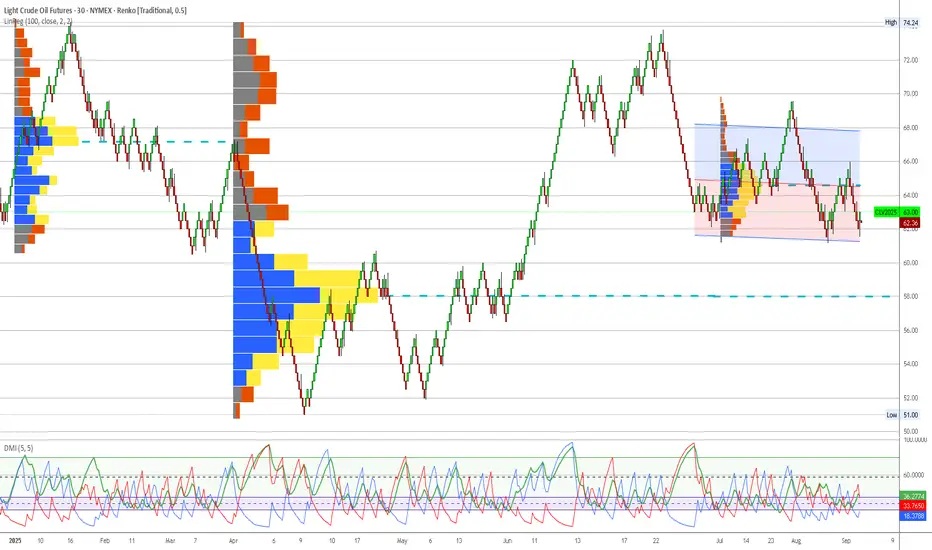
WTI Crude Oil (CL) - Technical Analysis Report - 20250908Analysis Date : September 8, 2025
Current Price : $62.25
Market Session : Pre-Market Analysis
Executive Summary
WTI Crude Oil presents a complex trading scenario with strong institutional support at current levels offset by concerning technical deterioration on the execution timeframe. The quarterly volume profile reveals massive smart money accumulation in the $62-64 zone, yet recent DEMA bearish crossover signals potential near-term weakness. This analysis provides a comprehensive framework for navigating this conflicted setup.
Quarterly Volume Profile Analysis
Institutional Positioning Intelligence
The quarterly volume profile (Q3 2025) reveals critical institutional positioning patterns that provide strategic context for all tactical decisions:
Primary Institutional Accumulation Zone: $62.00-$64.50
Massive blue volume concentration representing institutional accumulation
Heaviest volume density occurs at $62.50-$63.50 range
Current price ($62.25) sits at the lower boundary of this critical zone
Volume profile width indicates sustained institutional interest over extended period
Secondary Support Levels:
$60.50-$61.50: Moderate blue volume representing backup institutional support
$58.00-$59.00: Minimal volume suggesting limited institutional interest
Below $58.00: Complete volume void indicating institutional evacuation zone
Resistance Structure Analysis:
$65.00-$66.50: First institutional resistance zone with mixed volume
$68.00-$70.00: Heavy yellow volume indicating institutional distribution
$70.00+: Historical distribution zone from Q2 2025 peak
Price Structure Context
Historical Pattern Recognition:
The current positioning mirrors successful institutional accumulation patterns observed in previous commodity cycles. The width and intensity of the $62-64 blue volume zone suggests this represents a major strategic positioning by institutional participants, similar to the Natural Gas accumulation pattern that preceded its successful reversal.
Critical Structure Points:
Institutional Floor: $62.00 represents the absolute lower boundary of smart money positioning
Volume Point of Control: $63.25 shows peak institutional activity
Breakout Level: $64.50 marks the upper boundary requiring institutional continuation
Void Zone: $58-60 represents dangerous territory with minimal institutional backing
Execution Chart Technical Analysis
Current Technical Configuration
DEMA Analysis - CRITICAL WARNING SIGNAL:
Black Line (Fast DEMA 12): Currently at $62.25
Orange Line (Slow DEMA 20): Currently at $62.50
Configuration: Bearish crossover confirmed (black below orange)
Trend Bias: Technical momentum now bearish despite institutional support
DMI/ADX Assessment:
ADX Level: 40+ indicating strong directional movement
+DI vs -DI: -DI gaining dominance over +DI
Momentum Direction: Confirming the DEMA bearish bias
Trend Strength: High ADX suggests this technical shift has conviction
Stochastic Analysis:
Tactical Stochastic (5,3,3): Oversold territory providing potential bounce signal
Strategic Stochastic (50,3,3): Still showing bearish momentum
Divergence: Mixed signals between timeframes creating uncertainty
Support and Resistance Levels
Immediate Technical Levels:
Current Resistance: $62.75 (DEMA 20 orange line)
Key Resistance: $63.25 (institutional volume POC)
Major Resistance: $64.00 (upper institutional boundary)
Immediate Support: $61.75 (recent swing low)
Critical Support: $61.25 (institutional floor approach)
Emergency Support: $60.50 (secondary institutional zone)
Trading Scenarios and Setup Criteria
Scenario 1: Bullish Reversal Setup
Required Conditions for Long Entry:
DEMA recrossover: Black line must cross back above orange line
DMI confirmation: +DI must regain dominance over -DI
ADX maintenance: Strong directional reading above 25-30
Volume respect: Price must hold above $62.00 institutional floor
Stochastic alignment: Both tactical and strategic stochastics showing bullish divergence
Entry Protocol:
Primary Entry: $62.50-$63.00 upon DEMA bullish recrossover
Secondary Entry: $62.00-$62.25 if institutional floor holds with technical improvement
Position Sizing: 2% account risk maximum given conflicted signals
Stop Loss: Below $61.50 (institutional support violation)
Profit Targets:
Target 1: $65.00 (first institutional resistance) - Take 50% profits
Target 2: $67.00 (major resistance zone) - Take 25% profits
Target 3: $68.50-$70.00 (distribution zone) - Trail remaining 25%
Scenario 2: Bearish Breakdown Setup
Short Entry Conditions:
DEMA bearish continuation: Black line accelerating below orange line
Volume violation: Price breaking below $62.00 institutional floor
DMI confirmation: -DI expanding lead over +DI
ADX persistence: Maintaining strong directional bias
Short Setup Parameters:
Entry Range: $61.50-$61.75 on institutional support breakdown
Stop Loss: Above $62.75 (failed breakdown)
Targets: $60.00, $58.50, $57.00 (volume void zones)
Risk Management: Tight stops given counter-institutional positioning
Scenario 3: Range-Bound Consolidation
Sideways Trading Framework:
Range Definition: $62.00-$64.50 (institutional accumulation zone)
Long Zone: $62.00-$62.50 (lower boundary)
Short Zone: $63.75-$64.50 (upper boundary)
Stop Distance: 0.5-0.75 points ($500-$750 per contract)
Profit Target: Opposite range boundary
Risk Management Protocols
Position Sizing Guidelines
Conservative Approach (Recommended):
Maximum Risk: 1.5% of account (reduced from standard 2% due to technical/institutional conflict)
Contract Calculation: Account Size × 0.015 ÷ (Stop Distance × $10)
Example: $100,000 account with $0.75 stop = 200 contracts maximum
Stop Loss Hierarchy
Tactical Stop: $61.75 (execution chart support)
Strategic Stop: $61.50 (institutional boundary approach)
Emergency Stop: $60.75 (institutional floor violation)
Time-Based Risk Controls
Monitoring Requirements:
Daily: DEMA relationship and institutional level respect
4-Hour: DMI momentum shifts and ADX strength
Hourly: Stochastic divergence patterns
Exit Timeline: 10 trading days maximum if no clear resolution
Market Context and External Factors
Fundamental Considerations
Supply/Demand Dynamics:
OPEC+ production decisions impacting supply outlook
US Strategic Petroleum Reserve policies
China demand recovery prospects
Refinery maintenance season effects (September-October)
Geopolitical Factors:
Middle East tension levels affecting risk premiums
US-Iran relations impacting supply disruption concerns
Russia-Ukraine conflict ongoing effects on global energy flows
Seasonal Patterns
September-October Considerations:
End of summer driving season typically bearish for demand
Hurricane season potential for supply disruptions
Heating oil demand preparation potentially supportive
Refinery turnaround season creating temporary supply tightness
Monitoring Checklist and Alert Levels
Daily Monitoring Requirements
DEMA Status: Track black vs orange line relationship
Institutional Respect: Confirm price behavior at $62.00 floor
Volume Analysis: Monitor any changes in accumulation patterns
External Events: EIA inventory reports, Fed policy statements
Correlation Analysis: Monitor relationship with dollar strength and equity markets
Critical Alert Levels
Bullish Alerts:
DEMA bullish recrossover above $62.50
Strong bounce from $62.00 institutional floor
+DI reclaiming dominance over -DI
Break above $64.50 with volume confirmation
Bearish Alerts:
Break below $62.00 institutional floor
DEMA gap expansion (black line diverging from orange)
Volume breakdown below secondary support at $60.50
ADX above 50 with strong -DI dominance
Conclusion and Strategic Outlook
WTI Crude Oil presents a classic conflict between institutional positioning and technical momentum. The quarterly volume profile provides unambiguous evidence of major institutional accumulation at current levels, yet execution chart technical deterioration cannot be ignored. This scenario requires heightened vigilance and reduced position sizing until technical and institutional signals realign. The institutional floor at $62.00 represents the critical decision point - respect of this level with technical improvement offers exceptional risk/reward opportunities, while violation signals potential deeper correction despite smart money positioning.
Strategic Recommendation: Defensive positioning with readiness to capitalize on either directional resolution. Prioritize capital preservation while maintaining alert status for high-probability setups upon signal alignment.
Next Review: Daily assessment of DEMA configuration and institutional level respect
Document Status: Active monitoring required - conflicted signals demanding careful attention
Important Disclaimer
Risk Warning and Educational Purpose Statement
This analysis is provided for educational and informational purposes only and does not constitute financial advice, investment recommendations, or trading signals. All trading and investment decisions are solely the responsibility of the individual trader or investor.
Key Risk Considerations:
Futures trading involves substantial risk of loss and is not suitable for all investors
Past performance does not guarantee future results
Market conditions can change rapidly, invalidating any analysis
Leverage can amplify both profits and losses significantly
Individual financial circumstances and risk tolerance vary greatly
Professional Guidance: Before making any trading decisions, consult with qualified financial advisors, conduct your own research, and ensure you fully understand the risks involved. Only trade with capital you can afford to lose.
Methodology Limitations: Volume profile analysis and technical indicators are tools for market assessment but are not infallible predictors of future price movement. Market dynamics include numerous variables that cannot be fully captured in any single analytical framework.
The views and analysis presented represent one interpretation of market data and should be considered alongside other forms of analysis and individual judgment.
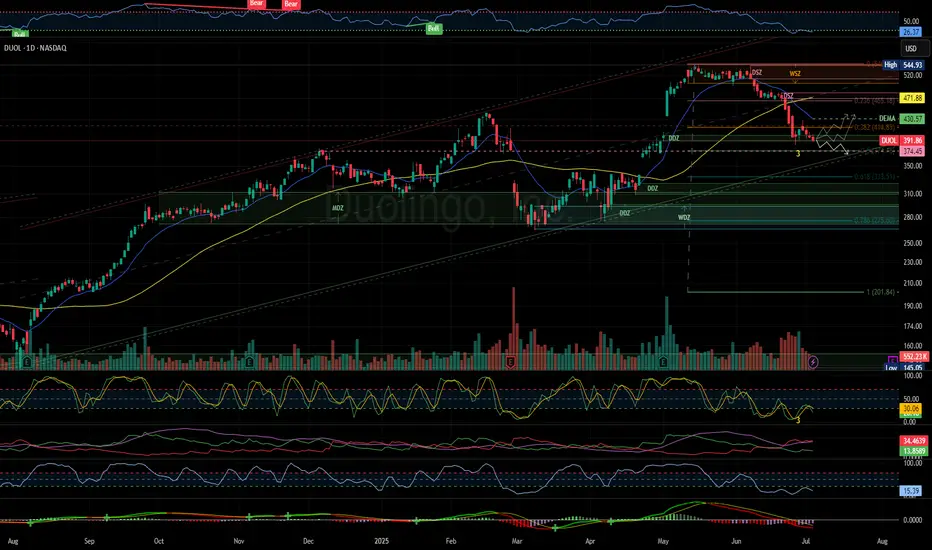
DUOL probable continues bearish for CCSDUOL 1D: at mid DDZ which coincides with FibR- 0.382. Just below price gap.
There is no sign of a reversal yet. Early next week , expect to confirm this to determine potential CCS.
Just covered a price gap with Fib-R 0.382 and likely bo would test 0.5 FibR, just before lower price-gap. BO here likely cover gap to test 0.618 typically high probability of demand side increasing.
Bo would test 0.786 for a deep correction which c
Potential target is DDZ above WDZ or DDZ in WDZ.
SMI vs. Stochastic: Which One Gives You the Edge?Momentum indicators are essential tools in every trader’s arsenal—but not all are created equal. While the Stochastic Oscillator has been a go-to for decades, the Stochastic Momentum Index (SMI) offers a more refined and reliable way to read market momentum.
In this post, we’ll break down the key differences between these two indicators, how we use them at Xuantify , and why the SMI might just give you the edge you’ve been looking for.
🧠 How We Use It at Xuantify
We’re always looking for tools that offer greater precision and less noise . While the Stochastic Oscillator is one of the most commonly used tools for spotting overbought and oversold conditions, the Stochastic Momentum Index (SMI) gives us a clearer, smoother view of momentum —especially in volatile or choppy markets.
We use the SMI to refine our entries and exits , particularly when trading breakouts or reversals. MEXC:ETHUSDT.P
⭐ Key Features
Stochastic Oscillator : Measures the closing price relative to the high-low range. Simple and responsive. Great for spotting short-term reversals.
Stochastic Momentum Index (SMI) : Measures the distance of the current close from the midpoint of the high-low range. Smoother and more centered around zero. Better at filtering out false signals.
💡 Benefits Compared to Other Indicators
Stochastic Oscillator vs. SMI:
Signal Smoothness: Moderate vs. High
Noise Filtering: Low vs. Excellent
Centered Oscillation: No vs. Yes (around 0)
Best Use Case: Range-bound markets vs. Trend shifts & momentum confirmation
False Signal Risk: Higher vs. Lower
The SMI is especially useful when you want to avoid whipsaws and get a more reliable read on momentum .
⚙️ Settings That Matter
Stochastic Oscillator : %K = 14, %D = 3
SMI : Length = 14, Signal Smoothing = 3, Double Smoothing = 3
You can adjust the SMI smoothing values to match the volatility of the asset— lower smoothing for fast markets , higher for slower ones.
📊 Enhancing Signal Accuracy
Enhance SMI signals by combining them with:
Trend filters like EMAs or Supertrend
Volume confirmation
Support/resistance zones
Divergence spotting for early trend reversals
This layered approach helps us avoid false positives and stay aligned with the broader trend .
🧩 Best Combinations with This Indicator
SMI + EMA Crossovers: Confirm momentum with trend direction
SMI + RSI Divergence: Spot early reversals with confluence
SMI + Volume Profile: Validate momentum near key price levels
⚠️ What to Watch Out For
Lag in fast markets: SMI’s smoothing can delay signals slightly
Over-optimization: Avoid excessive tweaking of parameters
Not ideal alone: Best used with confluence tools for confirmation
🚀 Final Thoughts
The Stochastic Oscillator is a classic for a reason—but the Stochastic Momentum Index is a refined evolution . We’ve found that SMI gives us cleaner signals , better momentum clarity , and fewer false alarms —especially when paired with smart filters.
If you're looking to upgrade your momentum toolkit , the SMI might just be your edge.
🔔 Follow us for more educational insights and strategy breakdowns!
We break down indicators, strategies, and market psychology to help you trade smarter—not harder.

Gold Bulls Taking a Breather?Gold has been in an overall uptrend since late January, steadily climbing with strong bullish momentum. After peaking around $3,440 in early April, price pulled back and found support near $3,171, bouncing from that level and now approaching resistance around $3,300.
Recently, price has shown signs of recovery, but the move still hasn’t broken the downtrend from the previous highs. The current area near $3,300–$3,365 is critical. If Gold can break and hold above this zone, it may retest the $3,440 high. But if price gets rejected again, a pullback toward $3,171 or even $2,972 is possible.
Technical indicators are sending mixed signals. The RSI is around 57, showing moderate bullish strength, but not overbought. However, the Stochastic is in overbought territory with a bearish crossover forming, which could mean a short-term dip is coming. Gold is still trading above all major moving averages, which supports a longer-term bullish outlook.
The bigger picture favors bulls, especially because of recent economic and geopolitical news. The U.S. Dollar has weakened after Moody’s downgraded the U.S. credit rating and concerns grew over a massive new tax-cut bill. Tensions between the U.S. and China, as well as ongoing conflicts in Gaza and Ukraine, have also driven safe-haven demand. Meanwhile, traders are betting on potential rate cuts later in 2025, which tends to boost Gold.
Key levels to watch:
Resistance: $3,300 and $3,440
Support: $3,171 and $2,972
Bias Summary:
Upward Bias: Weak USD, rising geopolitical risk, safe-haven demand, Fed rate cut expectations, price above major moving averages, aggressive central bank buying
Neutral Bias: RSI mid-range, price near resistance
Downward Bias: Stochastic overbought with bearish crossover, potential lower high formation, hidden bearish divergence.
Overall Bias: Bullish Long-term, Bearish potential short term – Fundamentals support further upside, but caution is needed near resistance for retracements.

[Strategy] Trend Re-Entry Strategy using a Stoch and Zero Lag MATrend re-entries can be hard. The difficult part is knowing if price will continue to pull back or will it shift back into the original direction.
This is a strategy with some extra notes to help you understand
1. The Original entry
2. The Re-Entry
3. Is my trend ending
For this you'll need two indicators:
The Zero Lag Multi Timeframe Moving Average
and The Stocashi + Caffeine Crush
In the video I show you how to adjust the settings for a 5 minute chart on both indicators.
Long Entry rules:
You have 3 MAs. The longest one is your support and resistance
The other two are your "trading" and "trending" MAs
If price is above your support and resistance, your trading and trending should be right side up.
If price close in between trading and trending, the stocashi should be at a low point.
It needs to arrive at this low point by previous crossing down through its midline.
**If it did not cross down through its midline, there is no entry here**
Once price closes above the trading MA, you should have a rising stocashi from its valid low point.
During this uptrend, each time price pulls back in between the trading and trending MAs, the Stocashi should be at a valid low point.
Re-enter your long trade as long as:
Stocashi made a valid low
Price is closing above the trading MA
Trading MA is above Trending MA
Trending MA is above Support and Resistance MA.
You can reverse all of these instructions for taking short trades.
Potential Market Flip
If you are getting consistent invalid lows on Stocashi while price is in a correct position, this means you are losing your trend, and you should wait for your price to close below the Support and Resistance MA.
At this point your Trading and Trending MAs should be upside down. They do not always have to be BELOW the Support and Resistance MA.

$PEPE - Price Action, MACD, RSI, Stoch RSII have had accumulated some Pepe back in May of 2023. I have not sold any and am looking to exit my position sometime this year.
I have charted up the divergence between Price action making lower lows while RSI and MACD have made higher lows. I have gone back through the past to find 3 different examples of divergences resulting in trend shifts from being bullish to bearish. Then after the bearish correction with some time you can see that there is a consolidation period. RSI MACD And Stoch RSI resets. Price RSI and MACD then diverge and after sometime price will base or then break out of a base resulting into a higher leg up.
Pepe has been a very well performing Crypto Coin and has yet to make a higher high this year. Last time was in dec of 2024.
I am currently looking for continued consolidation, Divergence of Price action RSI and MACD which I see some development of and I expect that in the near future we will see another leg Higher. What I will look for is a break out either above or below the consolidation and see how that correlates to the indicators I am starting off using this year. I do expect a higher leg up given the current environment of a President, Regulators and sentiment Leaning PRO Crypto.

What Indicators Do Traders Use for Scalping? What Indicators Do Traders Use for Scalping?
Scalping is a fast-paced trading style where traders aim to take advantage of small price movements within short timeframes. Such traders often rely on technical indicators to make quick decisions. This article explores some of the most popular scalping indicators, providing insights into how they can help traders spot opportunities in fast-moving markets.
Understanding Scalping Indicators
As you know, scalping is a trading strategy where traders aim to take advantage of small price movements by executing numerous trades within short timeframes, often closing trades within a few minutes. This approach requires swift decision-making and precise timing.
Technical indicators are essential tools in this context, as they provide real-time data and insights into market trends, momentum, and volatility. Using these indicators, traders can identify optimal entry and exit points, potentially enhancing their ability to navigate the rapid pace of the market.
Below, we’ll break down five indicators for scalping. You’ll find these scalping indicators in MT4 and MT5, TradingView. Also, you can get started in seconds with FXOpen’s free TickTrader trading platform.
Moving Averages
Moving averages (MAs) are considered by some to be the best indicator for scalping, smoothing out price data to help identify trends by calculating the average price over a specific period. In scalping, where quick decisions are crucial, certain types of moving averages can be useful.
Exponential Moving Average (EMA)
Unlike the Simple Moving Average (SMA), which assigns equal weight to all data points, the EMA gives more significance to recent prices, making it more responsive to current market movements. This responsiveness is advantageous for scalpers. For instance, a 9-period EMA reacts swiftly to recent price changes, potentially providing timely signals for entry and exit points.
Hull Moving Average (HMA)
Developed by Alan Hull, the HMA further reduces lag and enhances smoothness compared to traditional moving averages. It achieves this by weighting recent prices more heavily and using a unique calculation method. The HMA's ability to closely follow price action while minimising lag makes it a valuable indicator for scalpers.
Applying Moving Averages in Scalping
- Crossover Strategy: Scalpers often use two EMAs of different lengths to identify potential trading opportunities. A common approach involves a fast EMA (e.g., 5-period) and a slow EMA (e.g., 15-period). When the fast EMA crosses above the slow EMA, it may indicate a bullish trend, suggesting a potential buying opportunity or a chance to close a short trade. Conversely, when the fast EMA crosses below the slow EMA, it may signal a bearish trend, indicating a potential selling opportunity or moment to close a long trade.
- Trend Confirmation: The EMA and HMA can be used to confirm trends identified by other indicators. For example, if the moving average is sloping upwards, it may confirm an uptrend, supporting decisions to enter long positions. If it's sloping downwards, it may confirm a downtrend, supporting decisions to enter short positions.
You can find these scalping indicators in TradingView and FXOpen’s TickTrader platform.
Relative Strength Index (RSI)
The Relative Strength Index (RSI) is a well-known scalping indicator that measures the speed and change of price movements, oscillating between 0 and 100. Traditionally, an RSI above 70 indicates overbought conditions, while below 30 suggests oversold conditions.
In scalping, traders often adjust the RSI from its typical length of 14 to shorter periods, such as 7 or 9, to capture rapid price swings occurring over minutes. This adjustment makes the RSI more sensitive to recent price changes, providing timely signals for quick trades.
Applying RSI in Scalping
- Overbought/Oversold Levels: When the RSI moves beyond 70 or drops below 30, traders watch for potential reversal points. However, scalpers may focus on the RSI’s movement back into the 30-70 range as an early sign of momentum shifting.
- Divergences: Scalpers also look for divergence between price movement and the RSI. For example, if the price reaches a new high but the RSI does not, it may signal a weakening trend and possible reversal. This divergence can be an effective tool for anticipating quick market shifts.
- Midpoint (50 Level): The 50 level serves as a midpoint, indicating the balance between gains and losses. An RSI crossing above 50 may suggest bullish momentum, while dropping below 50 can indicate bearish momentum. Scalpers use this midpoint to assess the prevailing market trend.
Bollinger Bands
Bollinger Bands are a technical analysis tool comprising three lines: a simple moving average (SMA) in the middle, with upper and lower bands set at a specified number of standard deviations from the SMA. These bands expand and contract based on market volatility, providing a visual representation of price fluctuations.
In scalping, traders often adjust Bollinger Bands to shorter timeframes, such as 1-minute or 5-minute charts, to capture quick price movements. A common approach involves setting the SMA period to 7-10 and the standard deviation to 1.5-2, potentially enhancing sensitivity to short-term market changes.
Applying Bollinger Bands in Scalping:
- Bollinger Squeeze: When the bands contract, indicating low volatility, it often precedes significant price movements. Scalpers watch for a breakout above or below the SMA to identify potential trading opportunities.
- Reversal: Price breaching the upper band may suggest overbought conditions, while below the lower band may indicate oversold conditions. Scalpers use these signals to anticipate potential price reversals.
Stochastic Oscillator
The Stochastic Oscillator is a momentum indicator that compares an asset’s closing price to its price range over a specific period, typically 14. It includes the %K line, the current closing price relative to the range, and the %D line, a moving average of %K. The scale runs from 0 to 100, where readings over 80 suggest overbought levels, and those under 20 point to oversold levels.
In scalping, traders may adjust the Stochastic Oscillator to shorter settings, such as 5,3,3, to increase sensitivity to rapid price movements. This adjustment can help in capturing short-term market fluctuations.
Applying the Stochastic Oscillator in Scalping:
- Overbought and Oversold Conditions: When the %K line crosses the %D line in the overbought (above 80) or oversold (below 20) zones, it can signal a potential reversal. Scalpers use these crossovers as quick alerts for shifts in momentum, helping them to act swiftly in volatile markets.
- Crossovers: Besides extreme conditions, traders also monitor crossovers between %K and %D. A %K line crossing above %D from a lower level can suggest an upward move, while a downward crossover may hint at a short-term price decline.
- Divergence: If the price makes a new high/low but the Stochastic Oscillator does not, it may signal a weakening trend, indicating a potential reversal.
Moving Average Convergence Divergence (MACD)
The Moving Average Convergence Divergence (MACD) is considered one of the top forex indicators for scalping. It’s a momentum indicator that reflects the relationship between two moving averages. It comprises the MACD line (the difference between the 12-period and 26-period exponential moving averages), the signal line (a 9-period EMA of the MACD line), and a histogram, which illustrates the gap between the two lines.
Scalpers prefer to adjust these settings to 3, 10, and 16, respectively, to make the MACD more responsive to rapid price movements.
Applying MACD in Scalping:
- Crossovers: When the MACD line crosses above the signal line, it may indicate bullish momentum; a crossover below suggests bearish momentum. Scalpers monitor these crossovers to identify potential entry and exit points.
- Histogram Analysis: The histogram represents the difference between the MACD and signal lines. An expanding histogram indicates strengthening momentum, while a contracting histogram reflects weakening momentum. Scalpers use these changes to gauge the intensity of price movements.
- Divergences: A divergence occurs when the price moves in one direction while the MACD line moves in the opposite. For example, if the price reaches a new low but the MACD does not, it may reflect a potential upward reversal. Scalpers watch for such divergences to anticipate shifts in market direction.
Combining Indicators for Scalping Strategies
Combining multiple indicators can enhance scalping strategies by providing a more comprehensive view of market conditions. Each indicator offers unique insights, and their combined use can help filter out false signals and confirm trading opportunities. Here are some pairings:
- EMA and RSI: Utilising the Exponential Moving Average to identify trend direction alongside the Relative Strength Index to gauge momentum can help traders confirm the strength of a trend before making decisions. For instance, if the EMA indicates an uptrend and the RSI is above 50, it may suggest strong bullish momentum.
- Bollinger Bands and Stochastic Oscillator: Bollinger Bands measure volatility, while the Stochastic Oscillator identifies overbought or oversold conditions. When prices touch the upper or lower bands and the Stochastic Oscillator reflects overbought or oversold conditions, it may indicate potential reversal points.
- MACD and RSI: The Moving Average Convergence Divergence (MACD) highlights momentum changes, and the RSI indicates overbought and oversold conditions. Using them together can help confirm potential entry or exit points. For example, if the MACD shows bullish momentum and the RSI is rising but not yet overbought, it may signal a buying opportunity.
Common Challenges When Using Indicators in Scalping
Scalping with indicators offers valuable insights, but there are some challenges traders should be aware of:
- False Signals: Rapid market movements can trigger misleading signals, causing traders to act prematurely.
- Overtrading: Relying too heavily on short-term indicators can lead to excessive trades, increasing transaction costs.
- Market Noise: High volatility and frequent price fluctuations can make it difficult to distinguish genuine trends from random market "noise."
- Lagging Indicators: Some indicators may react too slowly, causing traders to miss opportunities.
The Bottom Line
Scalping requires quick decisions and the right tools, and indicators like the EMA, RSI, and MACD can help traders navigate fast-moving markets. Found the best scalping indicator that suits your style? Open an FXOpen account to access four advanced trading platforms and start building your scalping strategy today with low-cost, high-speed trading conditions.
FAQ
What Is the 1-Minute Scalp Strategy?
The 1-minute scalp strategy involves making rapid trades on a 1-minute chart. Traders look for small price movements and enter multiple trades within a short period, often using scalp trading indicators like the EMA or RSI for quick signals.
What Is the 5-Minute Scalping Strategy?
The 5-minute scalping strategy focuses on capturing short-term price movements on a 5-minute chart. Traders typically combine trend and momentum indicators, like the MACD and Bollinger Bands, to make fast, informed decisions.
Which Stocks Are Good for Scalping?
The choice depends on the trader’s risk tolerance, trading approach, experience, and toolkit. However, according to theory, stocks with high liquidity, tight spreads, and significant daily volume are good for scalping. Popular choices include tech giants like Apple (AAPL) and Tesla (TSLA), as they offer frequent price fluctuations. But at the same time, they bear higher risks.
What Is the Best EMA for Scalping?
There is no best exponential moving average for scalping. However, traders often use a pair of EMAs, such as a 9- or 5-period and 21- or 15-period, to quickly respond to price changes in scalping. These EMAs help identify trend direction and momentum.
How Can You Use RSI for Scalping?
In scalping, the RSI is often set to shorter periods, like 7 or 9, to catch signals quickly. Traders watch for the RSI to cross key levels (30 or 70) and form a divergence with a price chart to spot potential reversals.
This article represents the opinion of the Companies operating under the FXOpen brand only. It is not to be construed as an offer, solicitation, or recommendation with respect to products and services provided by the Companies operating under the FXOpen brand, nor is it to be considered financial advice

1-Minute Scalping Trading Strategies With Examples1-Minute Scalping Trading Strategies With Examples
Scalping is a popular trading style capitalising on rapid, small price movements within minutes. 1-minute scalping strategies are often used by traders but require precise execution and solid understanding of technical indicators. This article explores four 1-min scalping strategies, detailing the indicators used alongside specific entries and exits.
Understanding 1-Minute Scalping
1-minute scalping is a fast-paced trading style focusing on taking advantage of small price movements within a minute timeframe. Traders using this approach rely on 1-minute charts to make quick, multiple trades throughout the trading session. The primary goal is to accumulate potential small gains that might add up to larger returns over time.
A scalp trading strategy requires a solid understanding of technical analysis and market conditions. Scalpers typically use indicators, price action patterns, and trend analysis to identify short-term market movements and potential entry and exit points. The rapid nature of 1-minute scalping demands precision and discipline, as even a slight delay can impact the trade outcome.
One of the key advantages of 1-minute scalping is the ability to generate frequent trading opportunities, which can be particularly appealing during volatile market conditions. However, it also comes with higher risks due to the speed and frequency of trades, meaning risk management plays a significant role.
Scalpers must also be aware of transaction costs, as frequent trading can lead to significant fees, which can erode potential returns. Choosing a broker with low commissions, tight spreads, and fast execution speeds is essential to maximise a scalping forex strategy’s potential. FXOpen provides an ideal environment for scalping trading strategies, with commissions from $1.50 per lot, spreads from 0.0 pips, and ultra-fast execution. Open an account!
Four 1-Minute Scalping Strategies
Now, let’s take a closer look at four 1-minute trading strategies. To apply these strategies, see how they work in practice, and access each of these 1-minute scalping indicators, consider following along in FXOpen’s free TickTrader trading platform.
Strategy 1: VWAP + MACD
Indicators Used
- VWAP (Volume Weighted Average Price): VWAP calculates the average price a security has traded at throughout the day, based on both volume and price. It helps traders understand the trend and identify potential support and resistance levels.
- MACD (Moving Average Convergence Divergence): MACD is an indicator that visualises the relationship between two moving averages. MACD settings for a 1-minute chart are standard: the MACD line is derived from the difference between the 12-period and 26-period exponential moving averages (EMA), while the signal line is a 9-period EMA of the MACD line.
VWAP and MACD work well together by providing both trend and momentum analysis. VWAP helps identify the overall trend and significant price levels, while MACD offers insights into momentum changes. This combination can help traders determine entries by confirming trends and potential reversals.
Entry
- Traders typically look for the price to close through the VWAP, with the MACD turning from positive to negative or vice versa. This coincides with the signal line crossing over the MACD line.
- Alternatively, another common entry point is when the price uses the VWAP as a level of support or resistance, confirmed by the MACD turning from positive to negative or vice versa.
These triggers will likely occur within a few candles of each other, typically within 4 or 5 candles.
Stop Loss
- Stop losses are often set just beyond a recent high or low swing point, which helps potentially protect against losses if the market moves unexpectedly.
Take Profit
- Traders commonly take profits when the signal line crosses the MACD line in the opposite direction, and the histogram switches from positive to negative or vice versa. This approach allows traders to take advantage of momentum shifts and potentially lock in gains as the trend changes.
- However, some may prefer to exit at a significant support or resistance level in order to maximise potential gains.
Strategy 2: Keltner Channels + RSI
Indicators Used
- Keltner Channels: A volatility-based envelope set above and below an exponential moving average. The channels are typically set to two average true range (ATR) values away from the EMA. They help identify overbought and oversold conditions and potential breakouts.
- RSI (Relative Strength Index): A momentum oscillator that gauges the rate and extent of price changes. It ranges between 0 and 100, where readings above 70 signal overbought conditions, and readings below 30 indicate oversold conditions. RSI can also indicate bullishness when it crosses above 50 and vice versa.
The Keltner Channels and RSI strategy leverages volatility and momentum to identify effective trading opportunities. By combining the channels, which offer insights into breakouts, with the RSI, which gauges momentum, traders can uncover trading opportunities on the 1-minute chart.
Entry
- Traders often look for two or more closes outside of the Keltner Channel and ideally strong and/or consecutive green (bullish) or red (bearish) candles.
- This is confirmed by the RSI recently breaking above 50 for bullish signals or below 50 for bearish signals.
The combination of strong price action and momentum change helps traders identify potential trend continuations.
Stop Loss
- Stop losses are commonly set beyond the opposite side of the Keltner Channel to potentially protect against adverse price movements.
- For a higher risk-reward ratio, traders might place stop losses beyond a nearby swing candle.
Take Profit
- Traders typically take profits when the price crosses back beyond the Keltner Channel's midpoint or reaches the opposite side of the channel, indicating a potential exhaustion of the current move.
- Alternatively, profits may be taken when RSI moves beyond 70 (overbought) or below 30 (oversold), signalling potential reversals in price direction.
Strategy 3: ALMA + Stochastic
Indicators Used
- ALMA (Arnaud Legoux Moving Average): ALMA is a moving average that aims to smooth price data while reducing lag. The settings used are 21 for the window size, 0.85 for the offset, and 6 for the sigma. This combination helps in identifying the trend with greater precision.
- Stochastic Oscillator: The Stochastic measures the location of the close relative to the high-low range over a set period. Settings of 21, 1, 3 are used to capture momentum and potential reversal points. A figure above 80 signals overbought conditions, while below 20 indicates the opposite.
Combining ALMA with the Stochastic Oscillator allows traders to identify potential reversals in trends. ALMA provides a smoothed view of the price trend, while the Stochastic Oscillator offers momentum-based signals, helping to confirm the strength of a move.
Entry
- Traders look for the price to close through the ALMA, ideally with a strong close, which suggests a potential trend change.
- This is confirmed by the Stochastic Oscillator crossing below 80 for a bearish signal or above 20 for a bullish signal, indicating momentum alignment with the trend.
Note that price may fluctuate above and below the ALMA in ranging conditions and produce false signals.
Stop Loss
- Stop losses are typically set beyond the nearest swing point, which helps to potentially protect against adverse price movements.
Take Profit
- Traders typically take profits when the Stochastic reaches the opposite territory (e.g., from above 80 to below 20 for a bearish move), indicating a potential exhaustion of the current trend.
- Alternatively, profits may be taken at identified areas of support or resistance, where price action historically reacts, providing a logical exit point.
Strategy 4: RSI + Bollinger Bands
Indicators Used
- RSI (Relative Strength Index): For this strategy, RSI setting for a 1-minute chart is a length of 4, with overbought and oversold boundaries at 80 and 20, respectively. These RSI settings for the 1-minute chart help in identifying short-term overbought and oversold conditions.
- Bollinger Bands: Bollinger Bands settings for a 1-minute chart are a 20-period simple moving average (middle band) and two outer bands set at a standard deviation level of 2 from the middle band. They help identify periods of high and low volatility as well as potential reversal points.
The combination of RSI and Bollinger Bands allows traders to identify potential short-term reversals in the market. The Bollinger Bands provide a dynamic range for price action, while the RSI helps confirm overbought or oversold conditions, improving the accuracy of entry and exit points.
Entry
- Traders often enter when the RSI crosses below 80 from above or above 20 from below, signalling an exit from potential overbought or oversold conditions.
- This entry is confirmed when the price is also touching or breaching the Bollinger Band, indicating the likelihood of a short-term reversal.
Stop Loss
- Stop losses are typically set beyond a nearby swing point or just outside the Bollinger Band, providing potential protection against significant adverse price movements and giving the trade room to develop.
Take Profit
- Traders commonly take profits when the price touches the opposing Bollinger Band, suggesting a potential end to the current price move.
- Alternatively, some may take profits when the RSI crosses into the opposing overbought or oversold territory, indicating a shift in momentum.
The Bottom Line
Mastering a 1-minute scalping strategy can potentially enhance your trading performance. To take advantage of these techniques, consider opening an FXOpen account. As a regulated broker, FXOpen offers access to over 600 markets for scalping, supported by commissions as low as $1.50 and spreads from 0.0 pips. With the right tools and strategies, you can navigate today’s fast-paced trading environment effectively.
FAQ
What Is the 1-Minute Timeframe Trading Strategy?
The 1-minute timeframe trading strategy involves making multiple trades within a single minute, aiming to capture small price movements. Traders use a 1-min scalping strategy to identify quick trading opportunities and rely heavily on technical indicators for entry and exit points.
Which Indicator Is Best for 1-Minute Scalping?
There is no single best 1-minute scalping strategy indicator; it comes down to preference and experience. However, popular choices include the Moving Average Convergence Divergence (MACD), Relative Strength Index (RSI), Bollinger Bands, and the Volume Weighted Average Price (VWAP). Combining several indicators can potentially provide more reliable signals.
What Is the Best Timeframe for Scalping Crypto*?
The best timeframe for scalping crypto* depends on the trader's preference and strategy. While a 1-minute crypto* scalping strategy offers rapid trades and numerous opportunities, some traders prefer slightly longer frames like the 5-minute or 15-minute charts to balance speed and cryptocurrency* market noise.
What Is the Stochastic Setting for 1-Minute Scalping?
For 1-minute scalping, the Stochastic Oscillator is typically set to the standard settings of 14, 1, 3. These settings help capture short-term momentum changes, providing timely signals for entry and exit points. Adjustments can be made based on the trader's specific strategy and market conditions.
*At FXOpen UK, Cryptocurrency CFDs are only available for trading by those clients categorised as Professional clients under FCA Rules. They are not available for trading by Retail clients.
This article represents the opinion of the Companies operating under the FXOpen brand only. It is not to be construed as an offer, solicitation, or recommendation with respect to products and services provided by the Companies operating under the FXOpen brand, nor is it to be considered financial advice.

What Are Leading Trading Indicators, and How Can You Use ThemWhat Are Leading Trading Indicators, and How Can You Use Them in Trading?
Leading indicators are essential tools for traders aiming to analyse market movements. This article explains what leading indicators are, how they work, and their practical application across different asset classes. Read on to discover how tools like RSI, Stochastic Oscillator, On-balance Volume, and Fibonacci retracements can enhance your trading strategy.
What Are Leading Technical Indicators?
Technical indicators are divided into leading and lagging. Leading indicators in trading are tools used to identify potential price movements before they occur. Lagging indicators confirm trends after they begin, helping traders validate price movements. The difference between leading and lagging indicators is that leading indicators aim to give traders an edge by signalling when a new trend or reversal might be on the horizon while lagging indicators confirm trends after they've developed.
Leading trading indicators work by analysing price data to identify patterns or extremes in buying and selling behaviour. For instance, popular leading indicators like the Relative Strength Index (RSI) and the Stochastic Oscillator measure momentum in a market. These indicators help traders spot overbought or oversold conditions, where RSI tracks recent price movements relative to historical performance, while the Stochastic Oscillator compares a security's closing price to its price range over a set period.
However, it’s important to note that leading indicators can produce false signals, meaning they may suggest a price move that doesn’t materialise. Because of this, traders often combine them with other technical analysis tools, such as support and resistance levels, or use them alongside lagging indicators to validate the signals they receive.
Types of Leading Indicators in Trading
Leading indicators are divided into various types, each serving a unique role in analysing potential market movements. Three common types include momentum indicators, oscillators, and volume indicators:
- Momentum Indicators: These track the speed or rate of price changes. They are used to assess the strength of a trend and determine potential reversals when the momentum slows. Momentum indicators help traders when an asset is overbought or oversold.
- Oscillators: These indicators fluctuate between fixed values (usually 0 and 100) to reflect the market’s current momentum. They help traders pinpoint potential reversals by highlighting when an asset is overbought or oversold. Oscillators are particularly useful in range-bound markets where price movement is confined within support and resistance levels.
- Volume Indicators: These focus on the amount of trading activity, rather than price movement. By analysing the flow of volume in or out of an asset, traders can gauge the strength behind price movements. Increasing volume in the direction of a trend often confirms its continuation, while the divergence between volume and price can indicate potential reversals.
Below, we’ll take a look at a list of leading indicators. If you’d like to explore these indicators alongside dozens more, head over to FXOpen’s free TickTrader trading platform.
Relative Strength Index (RSI)
The Relative Strength Index (RSI) is one of the most popular leading indicators examples. RSI is a momentum oscillator that helps traders evaluate the strength of an asset’s price movements. Developed by J. Welles Wilder, it measures the speed and change of price actions over a set period—typically 14 candles—on a scale from 0 to 100.
The primary signals RSI produces revolve around overbought and oversold conditions. When the indicator breaks above 70, it suggests that an asset may be overbought, reflecting the potential for a reversal or correction. Conversely, when RSI falls below 30, it signals that an asset may be oversold, which can indicate a potential recovery. These thresholds provide traders with insight into whether the price has moved too far in one direction and is poised for a change.
RSI can also highlight trend reversals through divergence. If the price of an asset continues to rise while the RSI drops, it indicates bearish divergence, signalling potential weakening momentum. On the other hand, bullish divergence occurs when the price falls, but the RSI rises, suggesting that the downward trend may be losing strength.
Another useful RSI signal is when it crosses the 50-level. In an uptrend, RSI remaining above 50 can confirm momentum, while in a downtrend, staying below 50 reinforces bearish sentiment.
However, RSI is not foolproof. During a strong trend, the indicator can signal overbought or oversold for a long while and lead to false signals. This is why it’s often paired with other indicators to confirm signals.
Stochastic Oscillator
The Stochastic Oscillator is a momentum-based indicator that assesses the relationship between an asset's closing price and its price range over a specific number of periods, typically 14. It consists of two lines: the %K line, the primary line, and the %D line, which is a moving average of %K, providing smoother signals.
This oscillator ranges from 0 to 100, with readings above 80 indicating overbought conditions and those below 20 signalling oversold conditions. Traders utilise these signals to determine potential reversals in price. For example, when the oscillator rises above 80 and then drops below it, a potential sell signal is generated. Conversely, when it falls below 20 and climbs back above, it might indicate a buy opportunity.
The Stochastic Oscillator also provides crossover signals, where the %K line crosses above or below the %D line. A bullish crossover occurs when %K rises above %D, indicating that upward momentum may be increasing. A bearish crossover happens when %K falls below %D, suggesting that momentum is shifting downward.
In addition to overbought/oversold and crossovers, the Stochastic Oscillator can identify divergence, which signals potential trend reversals. A bullish divergence occurs when the price makes a lower low, but the oscillator shows a higher low, indicating a weakening downward momentum. On the other hand, a bearish divergence happens when the price makes a higher high, but the oscillator makes a lower high, suggesting the uptrend might be losing steam.
While the Stochastic Oscillator can be powerful in range-bound markets, it can be prone to false signals in trending markets.
On-Balance Volume (OBV)
On-Balance Volume (OBV) is an indicator that tracks the flow of trading volume to assess whether buying or selling pressure is dominating the market. It was introduced by Joseph Granville in 1963, and its primary concept is that volume precedes price movements. This makes OBV a useful tool for analysing potential trend reversals. While the absolute value of OBV is not crucial, its direction over time provides insight into the market’s underlying sentiment.
OBV offers several key signals:
- Trend Direction: A rising OBV supports an upward price trend, indicating strong buying pressure, while a falling OBV reflects a downtrend with selling pressure.
- Divergence: Traders use OBV to identify a divergence between price and volume. If the price is making new highs while OBV is falling, it suggests a weakening trend, potentially signalling a reversal. Conversely, rising OBV with falling prices can hint at a potential bullish reversal.
- Breakouts: OBV can also be used to spot potential breakouts. For instance, if OBV rises while prices are range-bound, it may indicate an upcoming upward breakout.
However, like any indicator, OBV has limitations. It can produce false signals in choppy markets and is used alongside other technical tools, such as Moving Averages or support and resistance levels, to improve reliability.
Fibonacci Retracement
Fibonacci retracements are a technical analysis tool that helps traders pinpoint potential support and resistance levels during price fluctuations. The tool is based on the Fibonacci sequence, a series of numbers that produce key ratios like 23.6%, 38.2%, 61.8%, and 78.6%. These percentages represent levels where the price of an asset might retrace before continuing its trend.
Traders apply Fibonacci retracement by selecting two extreme points on a price chart, such as a recent high and low. The tool then plots horizontal lines at the Fibonacci levels, indicating possible areas where the price might pause or reverse. For example, in an uptrend, a price pullback to the 38.2% level could signal a buying opportunity if the trend is likely to resume.
Fibonacci retracements are often used in conjunction with other indicators, such as the MACD or RSI, to confirm signals and enhance reliability. While they provide valuable insight into potential turning points, it's crucial to remember that these levels aren't guarantees—prices may not always behave as expected at these points, especially in volatile markets.
How Traders Use Leading Indicators in Practice
Traders use leading indicators to gain insights into potential price movements before they occur, helping them position themselves early in a trend. Here’s how leading indicators are typically applied:
- Identifying Overbought or Oversold Conditions: Indicators like RSI or Stochastic Oscillator are used to spot extreme price levels. When these indicators signal that a market is overbought or oversold, traders analyse the situation for potential trend reversals.
- Combining Indicators for Confirmation: It’s common to pair multiple leading indicators to strengthen signals. For example, a trader might use both the RSI and OBV to confirm momentum shifts and avoid acting on false signals.
- Spotting Divergences: Traders look for divergence between an indicator and price action. For instance, if prices are rising, but the indicator is falling, it can suggest weakening momentum, signalling a potential downward reversal.
- Clear Entry and Exit Points: Leading indicators often provide clear entry and exit points. For instance, the Stochastic Oscillator signals a bearish reversal and entry point when it crosses back below 80, with traders typically exiting the trade when the indicator crosses above 20. Likewise, Fibonacci retracements can provide precise levels where a trend might stall or reverse.
Potential Risks and Limitations of Leading Indicators for Trading
While leading indicators offer valuable insights into potential price movements, they come with risks and limitations.
- False Signals: One of the biggest challenges is that leading indicators can generate false signals, especially in volatile markets. For instance, an indicator might signal a reversal, but the price continues in its original direction, leading traders to take positions prematurely.
- Limited Accuracy in Trending Markets: It’s common that in strong trends, such indicators remain overbought or oversold for extended periods, causing traders to misinterpret momentum.
- Overreliance on One Indicator: No single indicator is foolproof. Relying heavily on one without considering other factors can lead to poor decisions. Traders need to combine leading indicators with other tools like support/resistance levels or trendlines to validate signals.
- Lagging in Fast-Moving Markets: Even though they are called "leading" indicators, they can sometimes lag in rapidly changing markets. By the time a signal is generated, the opportunity may have already passed.
The Bottom Line
Whether trading forex, commodities, or the stock market, leading indicators offer valuable insights to help traders anticipate potential price movements. By combining these tools with a solid strategy, traders can better navigate market conditions. To start implementing these insights across more than 700 markets, consider opening an FXOpen account and take advantage of our high-speed, low-cost trading conditions.
FAQ
What Are the Leading Indicators in Trading?
Leading indicators are technical analysis tools used to determine potential price movements before they happen. Traders use them to anticipate market shifts, such as reversals or breakouts, by analysing price momentum or trends. Common examples include the Relative Strength Index (RSI), Stochastic Oscillator, and Fibonacci retracement levels.
What Are the Three Types of Leading Indicators?
The three main types of leading indicators for trading are momentum indicators (e.g., Momentum (MOM) indicator), oscillators (e.g., Stochastic), and volume indicators (e.g., On-Balance Volume). These tools help determine market direction by assessing price action or trading volume.
Is RSI a Leading Indicator?
Yes, RSI (Relative Strength Index) is a leading indicator. Considered one of the potentially best leading indicators for day trading, it measures momentum by comparing recent gains and losses, helping traders spot overbought or oversold conditions before potential reversals.
This article represents the opinion of the Companies operating under the FXOpen brand only. It is not to be construed as an offer, solicitation, or recommendation with respect to products and services provided by the Companies operating under the FXOpen brand, nor is it to be considered financial advice.

DOGEUSD looks overextended from big-rises. Sell or buy Dip
If you follow the stochastic's at all, esp. on higher timeframes, if you don't well that is fine, but I will share my tip, you never want to see K line (generally blue) crossing down on the D line if you are in a Long position, but an even further bearish possible move is when the K-line crosses down on the 80 Stochastic's level.
Now the fundamentals of the indicator are similar to the Relative Strength Index (RSI), anything above 80 and staying above 80 will become further overbought in a situation where there has been too much recent buying demand orders executed and as such sellers will usually move-in, but traditionally not until k Crosses-down on 80, getting to 75 will probably seal the deal short for sellers as this crossing of K needs to be a sustained crossing and needs to be moving down, this would occur much slower on a daily timeframe of course. Drop to lower timeframes and see what the oversold/overbought condition is for Stochastic's on lower TF's because the more confluence you have with the Daily the better.
It does not necessarily have to be on the Daily, but bigger timeframes carry bigger profits, generally, depending on SL position and risk/reward. Often, the first TF to meet the setup will be a lower TF, but profits can be made on a Crossing of the Daily chart, it would mean the trade is probably safer in higher TF, by that I mean trade goes your way in your intended direction, in this instance Short.
But here is the controversy of Stochastic X-ups (bullish above 20 level) & X-downs (bearish on a break of 80 lower), they are not very reliable when you are going against the trend.
For example, the DOGEUSD crypto has had a massive run lately since bitcoin reached around 75k, despite being at a great price, I believe, its price is overextended and considerably above the 200ema daily, so it becomes a sort of mean reversion situation where sellers form an idea from Stochastic's RSI Price action etc, that it's price needs to cool a bit as its overbought and too much current demand has driven the price too high, but here is the thing, shorting- Doge when its in a bullish uptrend with price above EMA's especially 200 will not be easy.
So this method works better when you are trying to move price (down or up) in the direction of the trend and the path of least resistance. One of the main reasons is because the RSI and Stochastic's give a mixed message when the trend is not your friend. This is because momentum is still to the upside long when above the 80 level on Stochastic's and RSI, momentum is still to the bearish downside when Stochastic's' is below the 20 level. This continued momentum can last a long time in these extended zones above 80 (bullish momentum) or below 20 (bearish momentum) but usually at some point a diminishing momentum occurs as the market forms an opinion that the instrument is overbought > 80 or oversold < 20.
So, the Daily chart shows how price is tipping over, right now a lot of other TFs showing bearishness as well on Stochastic's.
I hope this helps your understanding, a bit long but its a lengthy topic.
By the way, I don't think I will be selling DOGEUSD despite the reasons above, BTCUSD chart does not share this quality of bears moving in, at least not last time I checked a few hours ago.

Fundamental & Technical analysis on USDZAR shorts Fundamental : Open Interest on the South African Rand is increasing which is a Bearish signal/confluence. Commercial (Hedgers) Short positions are also increasing which for Exotic pairs like USDZAR means they are covering their Longs and add yet another Bearish confluence. Non-Commercial is also increasing its Long positions which is once again Bearish since you have too see it from a 180 degree view point.
COT Report : cot-reports.com
Technical : On the Technical Analysis side of things we have the 5 EMA crossing down the 20 EMA at the same time that Momentum is negative and the Stochastic %K line is underneath the 50% line
Stop Loss & Take Profits : To determine my Stop Loss and Take Profits I use a Fib Retracement drawn from a recent significant Low to a recent High. My strategy uses the 0.236 Fib LVL as the Stop Loss, for this trade that means 18.51172 on the chart is my Stop. Take Profit #1 is at Fib LVL 1.272, Take Profit #2 is at Fib LVL 1.414, Take Profit #3 is at Fib LVL 1.618, Take Profit #4 is at Fib LVL 2, Take Profit #5 is at Fib LVL 2.272, and my final Take Profit which is #6 is at Fib LVL 2.618.

Bullish Alert: Tata Technologies|Strong Swing Trade Potential!📈 Bullish Alert: Tata Technologies Ltd. Shows Strong Swing Trade Potential! 🚀
Stock Analysis Report
Stock Name : Tata Technologies Ltd.
Timeframe: Daily
Current Market Price (CMP) : ₹1068
________________________________________
Trade Type
• Trade Type: Swing Trade
________________________________________
Technical Analysis
1. Trendline Breakout:
The stock has recently broken above a key trendline with increased volume, indicating a strong bullish signal.
Following the breakout, the stock has successfully retested the trendline, further
validating the upward momentum.
2. Indicators:
MACD: Buy signal confirmed.
Oscillator: Buy signal confirmed.
3. Moving Averages:
The price is currently trading above both the 50-day and 100-day moving averages, reinforcing the positive trend.
________________________________________
Target Prices
• T-1: ₹1115
• T-2: ₹1150
• T-3: ₹1180
________________________________________
Stop Loss
• SL: ₹1045
________________________________________
Summary : Tata Technologies Ltd. presents a strong swing trade opportunity. The stock exhibits a bullish trend supported by a recent trendline breakout, successful retest, and positive signals from key technical indicators. With the price trading above significant moving averages, potential target prices are set at ₹1115, ₹1150, and ₹1180, while a stop loss is recommended at ₹1045 to manage downside risk.
________________________________________
Disclaimer : " Please do not base your trades solely on the ideas mentioned above. Conduct your own research before making any trading decisions. We are not responsible for any financial losses that may result from applying this study or from taking any early entry or exit in trades. "

$EURGBP | Sell Trade | Market Exec |Technical Confluences:
Price action is bounced off an Interest Zone and created a newer low
Price is breaking through a support trendline
To note, Stochastics is moving into Oversold conditions but fundamentally, there is support for OANDA:EURGBP to be weaker
Fundamental Confluences:
This FX pair is a trade-related pair and normally doesn't move much against one another unless there is a change in fiscal or monetary front
In this sense, we got a gauge of how both central banks, ECB and BOE stance are. ECB is taking on a data dependent stance and is trying to resist cutting interest rates while BOE sent out a hawkish note the other day that majority of them do not want to cut rates
Naturally from a yield perspective, holding GBP compared to EUR is more attractive and this is what we are aiming for.
-----
Will be taking on a short OANDA:EURGBP position when market reopens on Monday.
This trade may take some time to complete as it there is normally not much action with this pair except during London's trading hours.
-----
