AVGO (Broadcom) Crash Alert | The Biggest Drop Is Just Starting “ AVGO (Broadcom ) is on the brink of a massive correction, with charts pointing toward a potential plunge into the $45–$23 zone — a brutal reset that could shake the entire semiconductor sector before the next bull cycle begins. ⚠️📉”
🔥 Summary:
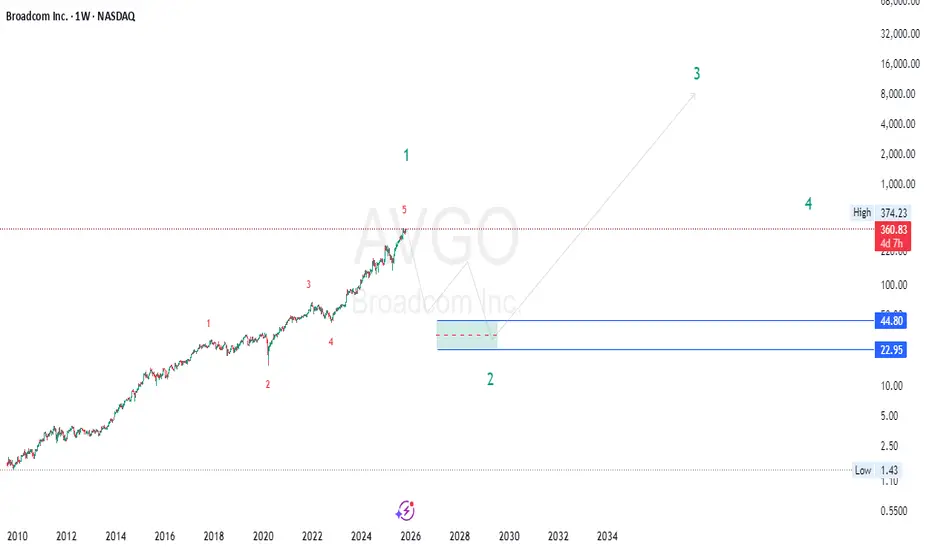
Broadcom (AVGO) might be entering a massive corrective phase after a historic rally. The charts suggest the bull run is pausing and a bear market retracement is about to unfold — potentially one of the biggest corrections in years. While long-term fundamentals remain strong, smart money could be preparing to buy much lower after this shakeout. ⚠️📉
🌊 Elliott Wave Breakdown
According to wave theory, AVGO has likely completed a full 5-wave impulse — marking the end of Cycle Wave 1 .
Now, the market is preparing for Cycle Wave 2 , a deep and time-consuming correction.
The expected retracement zone lies between $45–$23 , which corresponds with the 0.618–0.786 Fibonacci retracement of the entire 2010–2025 rally.
Wave 2s often create fear and disbelief, shaking out late buyers before the next mega rally (Wave 3).
In other words: this is not the end of the bull , but the start of a much-needed reset .
📉 Price Action & Market Structure
AVGO’s weekly structure shows clear exhaustion at the top — long wicks, slowing momentum, and divergence between price and volume.
The market structure shift (MSS) is forming:
Break of trendline support 🟠
Lower highs forming 🔻
Liquidity still sitting under 2022–2023 consolidation zones
All this signals that distribution is underway. Once liquidity under key swing lows gets tapped, a larger bearish trend can unfold.
🧠 Smart Money Concept (SMC) View
Smart Money is likely offloading at these premium prices.
Expect the following sequence:
💥 Liquidity grab above current highs (final trap)
⬇️ Break of structure confirming the downtrend
📉 Repricing toward discount zone ($45–$23)
🧱 Reaccumulation by institutions for the next macro leg
The bearish reprice phase may last several quarters or even years, but this is where smart money prepares for the next cycle , not retail FOMO.
💰 Fundamentals Meet Reality
Despite Broadcom’s strong fundamentals — AI infrastructure, chip dominance, software expansion — valuations have far outrun earnings .
A macro reset (higher rates, earnings compression, slowing AI hype) could drive a fundamental correction to align price with real growth.
Even great companies need bear markets to reload and revalue before resuming exponential growth.
🔮 The Big Picture
✅ Long-term bull trend is intact — but paused .
⚠️ Short-to-medium term: bear market correction is expected to start soon .
🎯 Key accumulation zone: $45–$23 (deep discount territory).
🚀 Post-correction, the next supercycle (Wave 3) could begin — targeting multi-thousand-dollar levels.
🦅 Summary Insight
“Smart money sells strength, not weakness. They’ll buy when fear peaks.”
AVGO’s parabolic bull wave has likely topped , and a multi-year corrective wave is next.
This is not the end — it’s the reset before a generational buying opportunity.
Brace for turbulence before the skies clear. 🌪️📉➡️🌤️🚀
“ Traders , this could be the setup of the decade. AVGO (Broadcom) is flashing every warning sign of a massive correction — our models point to the $45–$23 zone as the next major demand area. Don’t chase the top when smart money is preparing to buy the bottom. 📉💰
How deep do you think this correction goes? Drop your targets below 👇 and let’s see who catches the real reversal!”
— Team FIBCOS
#AVGO #Broadcom #StockMarket #BearMarket #Correction #WaveTheory #SmartMoney #ElliottWave #TechnicalAnalysis #TradingView #Fibcos #PriceAction #Investing #MarketCrash #StockAlert #Wave2 #MarketUpdate #ChartAnalysis #BearishSetup #TradeSmart
Stockalert
ChargePointAfter following our predictions, now CHPT is set to face 2 support points that can help it rise back up.
Market volatility is still high so lets wait and see how CHPT reacts to it!

TQQQ - TrendlineAs we all know, all the analysts and investors are talking about the market bubble that we are all in currently. And in our opinion, TQQQ is reaching its resistance line. It will need to cool-down sooner or later, we are currently waiting for it to pop the bubble and drop closer to the support line where we can buy it confidently. Good Luck to everybody and Stay Safe!

AIRBNB - Nice touch to the Support!AIRBNB, the future of the hospitality industry is reaching its first earnings report since the IPO!
-CCI looks bullish having the current price standing below the average.
-Chart looks bullish as well standing at a very close point to the support!
Wait for a reversal or a touch to the support, once either of them is done get in!
For the ones who are long-term on this, then, the current price is already a good entry.

BTCUSD - Bullish Rectangles in the game!Since Feb 1, BTC started forming another path for a bullish rectangle. Great demand for this boy, keeping a close eye on it! Safe trades friends!

Sumo Logic - Trend LineSumo Logic is a cloud-based machine data analytics company focusing on security, operations and BI usecases. It provides log management and analytics services that leverage machine-generated big data to deliver real-time IT insights. Recently adding Amazon to their customer's list, Sumo Logic takes a long-term buy position in our portfolio. In our opinion, Sumo has two ways to go at this point: Touch the resistance line and drop to the support, or go all the way back to support and then jump back. Either way if you haven't invested in Sumo Logic yet, wait for it to get closer to its support line and make a purchase then! Good Luck and Stay Safe!

FACEBOOK BUY RUNNING +3.8% - CHECK OUT RELATED IDEAS ! FB trade made a great move! Let us know if you're in !
BASED ON 1% RISK YOUR ACCOUNT WOULD BE RUNNING +3.8%
OUR STRATEGY EXPLAINED:
The entry price, SL and multiple TPs are shown on the chart.
Our back testing and money management strategy itself is holding until a reverse signal to ride a big trend, but as you will not see the next signal - manage the trade as you wish should you decide to enter.
What is our strategy?
Our strategy is a trend following strategy, can be used on any instrument and time frame. However, we have hard coded specific parameters for when trading the H1 time frame, so we can back up over 4200 previous trades to confirm our edge from previous data. This gives us confidence in execution and belief in our trading strategy for the long term.
The strategy simply sits in your trading view, so you will see exactly what we see - the trade, entry price, SL and multiple TPs (although we hold until opposite trade as this is the most profitable longer term plan), lot size, etc.
This could be on your phone trading view app, or laptop of course.
The hard work is done, so we have zero chart work time, no analysis, no time front of the chart doing technical analysis - technical analysis is very subjective - you may see different things at different times - how do you have a rigid trading plan on a H&S shoulder pattern? Your daily routine, diet, sleep, exercise can affect what you 'see' and your decision making, this doesn't happen when a strategy is coded like this; what we do have is a mechanical trading strategy...
What does this mean?
It means, we are very clear on our entry and our exit and use strict risk management (this is built in - put in your account size, set your risk in % or fixed amount and it will tell you what lot size to trade!) so we have no ego with our position and we are comfortable with all outcomes - its simply just another trade. This free's our mindset from worry and anxiety as we take confidence from knowing our edge is there and also that we have used sensible risk management.
The strategy itself can be used as a live trading journal too - how cool is that? The strategy will confirm and support every open and closed position - so its quite easy to follow.
We just have to do what Percy does.
Please see our related ideas below for more information to explain what we do and how it can help you.

