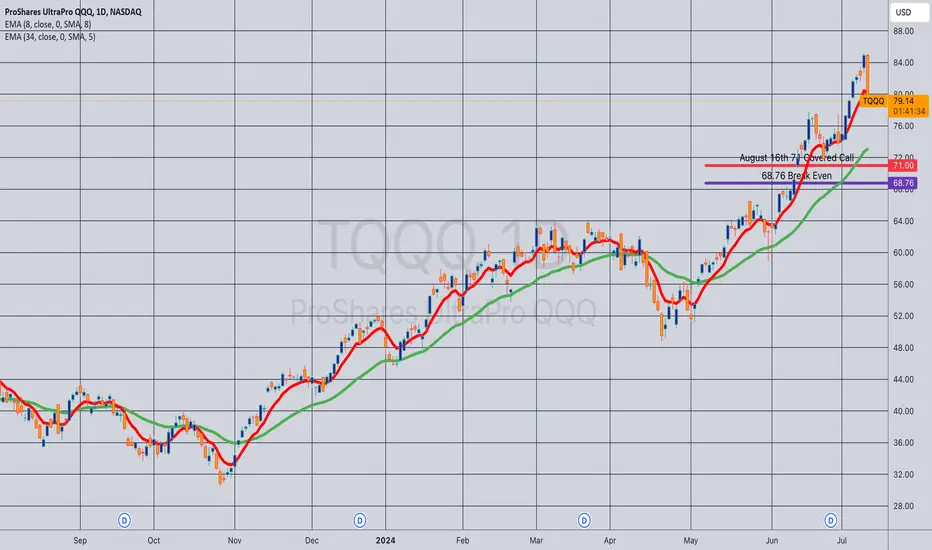
Opening (IRA): TQQQ August 16th 71 Covered Call... for a 68.76 debit.
Comments:
Buying stock and selling a -75 delta call against to emulate the delta metrics of a 25 delta short put with the built-in defense of the short call. As usual, this only makes sense in a cash secured environment where you don't get much BP relief going with the shor
Key stats
About ProShares UltraPro QQQ
Expense ratio
0.88%
Home page
Inception date
Feb 9, 2010
TQQQ is a levered fund that delivers 3x exposure only over a one-day holding period of NASDAQ-100 stocks. The underlying index includes 100 of the largest non-financial companies listed on NASDAQ based on market capitalization. Historically, technology companies have dominated TQQQs underlying index, so, its future performance might be closely tied to the performance of the tech industry. The fund uses a mathematical approach to determine the type, quantity and mix of investment positions that it believes will produce daily returns consistent with its investment objective. Like many levered products, the fund is not a buy-and-hold ETF as it's a very short-term tactical instrument.
Classification
What's in the fund
Exposure type
Electronic Technology
Technology Services
Government
Cash
Stock breakdown by region
Opened (IRA): TQQQ Sept 20th 58 Monied Covered Call... for a 54.85 debit.
Comments: Added to my position at a strike/break even better than what I currently have on.
Metrics:
Buying Power Effect/Break Even: 54.85/share
Max Profit: 3.15 ($315)
ROC at Max: 5.74%
50% Max: 1.58 ($158)
ROC at 50% Max: 2.87%

Opening (IRA): TQQQ August 16th 73 Monied Covered Call... for a 70.80 debit.
Comments: High IV at 55%. Buying a one lot and selling a -75 call against in the August 16th monthly to emulate the delta metrics of a 25 delta short put, but with built-in short call defense. I looked at doing something in the 45 DTE wheelhouse, which would be the August

Opening (IRA): TQQQ Sept 20th 63 Monied Covered Call... for a 59.60 debit.
Comments: High IVR/high IV at 68.7/63.1%. Selling the -75 delta call against stock to emulate the delta metrics of a 25 delta short put, but with the built-in defense of the short call.
Additionally, adding at strikes/break evens better than what I've current got on (the Au

TQQQ: over bought, wait for the negative divergence.Hello,
TQQQ is over bought with RSI above 80.
But not yet done with rally.
Look for the Negative divergence in RSI for shorting.
Tech is in super bull phase, be careful with puts/shorts.
Let's see if it can come down to fill those gaps.
Happy trading

Opening (IRA): TQQQ July 19th 58 Monied Covered Call... for a 55.95 debit.
Comments: Going monied here, selling the -75 call against stock to emulate a 25 delta short put metrics while having built-in intraexpiry defense via the short call. More patient people will probably wait for weakness ... .
I'll generally look to roll out the short call on

Opening (IRA): TQQQ July 19th 53 Short Put... for a 1.77 credit.
Comments: Adding a short put element to my TQQQ covered call on weakness.

Opening (IRA): TQQQ June 28th 53 Monied Covered Call... for a 51.52 debit.
Comments: Re-upping in the June 28th expiry with a monied covered call, as there is no July yet. Selling the -75 delta call against a one lot to emulate the delta metrics of a 25 delta short put to have built-in defense via the short call and to take advantage of call side

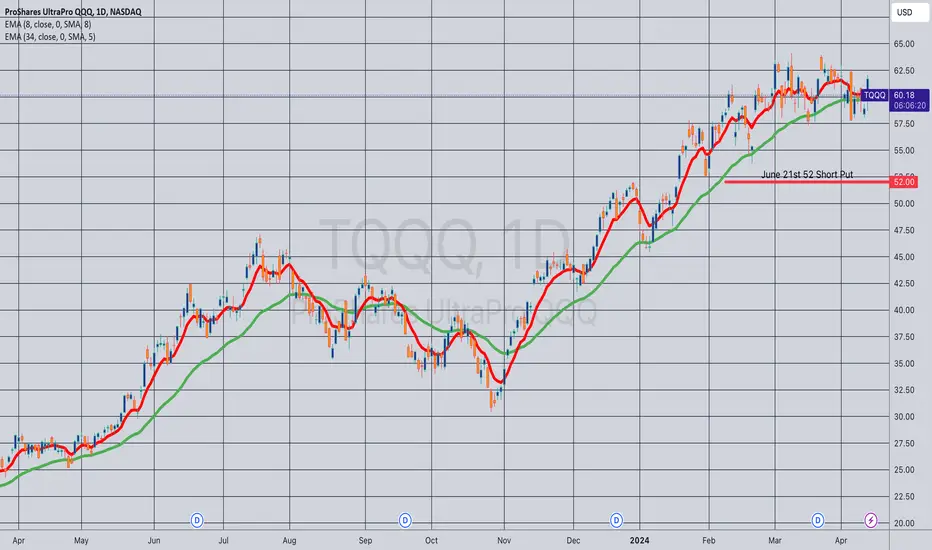
Opening (IRA): TQQQ June 21st 52 Short Put... for a 2.49 credit.
Comments: Adding to my TQQQ position on weakness ... . This is a bit longer-dated than I like to go with shorter duration premium selling, which I like to keep in that 45 DTE wheelhouse, but May has now only 35 days in it, and I like to stick to monthlies in all but the mos
Opened (IRA): TQQQ May 17th 55 Monied Covered CallBought a one lot of shares and sold an in-the-money -75 delta call to emulate a 25 delta short put to take advantage of call IV skew and to have built-in pro via the short call.
Metrics:
Break Even/Cost Basis in Shares: 52.71
Max Profit: 2.29 ($229)
ROC %-age at Max: 4.34%
ROC %-age at 50% Max: 2.

See all ideas