NASDAQ is on the verge of collapse.Nasdaq (NDX) completed its 'Santa rally' on December 26 and since then it's been pulling back, breaking below the 1D MA50 (blue trend-line), despite today's early rise in the aftermath of Maduro's capture over the weekend.
Technically, it is repeating the Cycle Top formation of 2021. That was achieved under a Lower Highs trend-line, which as soon as the very first week of 2022, started a violent correction that extended well beyond the 1D MA200 (orange trend-line), making a first stop on the 2.618 Fibonacci extension, before a dead-cat-bounce kicked in.
Right now, the latest Lower High was that 'Santa rally' and since we've just started the first week of 2026, there are high probabilities that a new collapse will begin. Even the 1D RSI comes to confirm this, being very similar to that of late 2021.
If the market repeats the 2022 Bear Cycle, then we are looking at a first Low at 21000 (Fib 2.618) by March.
---
** Please LIKE 👍, FOLLOW ✅, SHARE 🙌 and COMMENT ✍ if you enjoy this idea! Also share your ideas and charts in the comments section below! This is best way to keep it relevant, support us, keep the content here free and allow the idea to reach as many people as possible. **
---
💸💸💸💸💸💸
👇 👇 👇 👇 👇 👇
Stockindex

S&P500 This is the level that confirms the Bear Cycle.The S&P500 (SPX) has reached a point where it could be on the verge of initiating a new Bear Cycle as the price action that led to the end of 2025 (mostly Q4) has been very similar with the one in late 2021 that kick-started the 2022 Bear Cycle.
What confirmed that Bear Cycle was the market closing a 1W candle below the 1D MA100 (red trend-line). This is extremely critical as it has already proven its role as a catalyst during the most recent short-term pull-back in November, where it held upon tested on the week of November 17 2025 and thus rebounded. This is exactly what took place in November 2021, with the index eventually closing a 1W candle below the 1D MA100 almost 2 months later on the week of January 17 2022. That confirmed the 2022 Bear Cycle as the sell-off was accelerated and in just 1 week, the market even hit the 1W MA50 (blue trend-line).
The structure between the two fractals is so far very similar, with a huge 1W RSI Bearish Divergence (Lower Highs against price's Higher Highs) leading the index towards a potential Top. If the price action continues to repeat that of 2022, then we are looking at the very real possibility of a -27.60% overall correction within roughly 12 months time, with the first potential Target being the 1W MA200 (orange trend-line) around 5350 and second the full -27.60% extension at 5050. Those two levels technically form the potential Buy Zone for the next Bull Cycle.
The metric though that cannot be ignored as far as long-term buying is concerned, is the 1W RSI, which has historically given optimal buy opportunities when it turned oversold (i.e. 30.00 or below). If this level is hit before any of the above two Targets, we will be turning into long-term buyers again regardless.
---
** Please LIKE 👍, FOLLOW ✅, SHARE 🙌 and COMMENT ✍ if you enjoy this idea! Also share your ideas and charts in the comments section below! This is best way to keep it relevant, support us, keep the content here free and allow the idea to reach as many people as possible. **
---
💸💸💸💸💸💸
👇 👇 👇 👇 👇 👇

NASDAQ: Support at 25.333? Be Prepared To Buy!Welcome back to the Weekly Forex Forecast for the week of Jan. 5 - 9th.
In this video, we will analyze the following FX market: NASDAQ (NQ1!) NAS100
The NASDAQ is inn a narrowing range, but bullish overall. Last week it closed a bearish Weekly candle.
Is the weakness over? The answer is not obvious, but there are structural clues that show price may find support at the +OB highlighted in the video. Let's see if the market shows respect to the order block and uses it as support for higher prices.
If the market continues to trade into the +OB, then we can short it towards the fractal low.
But we must wait for the market to tip its hand. Right?
Enjoy!
May profits be upon you.
Leave any questions or comments in the comment section.
I appreciate any feedback from my viewers!
Like and/or subscribe if you want more accurate analysis.
Thank you so much!
Disclaimer:
I do not provide personal investment advice and I am not a qualified licensed investment advisor.
All information found here, including any ideas, opinions, views, predictions, forecasts, commentaries, suggestions, expressed or implied herein, are for informational, entertainment or educational purposes only and should not be construed as personal investment advice. While the information provided is believed to be accurate, it may include errors or inaccuracies.
I will not and cannot be held liable for any actions you take as a result of anything you read here.
Conduct your own due diligence, or consult a licensed financial advisor or broker before making any and all investment decisions. Any investments, trades, speculations, or decisions made on the basis of any information found on this channel, expressed or implied herein, are committed at your own risk, financial or otherwise.

DOW JONES Triangle started a Bullish Leg.Dow Jones (DJI) has been trading within a Triangle pattern on the short-term, with the price making a Higher Low on Wednesday on its bottom. With the 4H RSI rebounding just after it breached below the 30.00 oversold barrier, we expect the pattern to start its new Bullish Leg now.
A +1.30% rise to test its top (Lower Highs trend-line), would still be a minimum based on all the Bullish Legs that preceded. As a result, our short-term Target (unless the 4H MA50 rejects the uptrend) is 48650.
---
** Please LIKE 👍, FOLLOW ✅, SHARE 🙌 and COMMENT ✍ if you enjoy this idea! Also share your ideas and charts in the comments section below! This is best way to keep it relevant, support us, keep the content here free and allow the idea to reach as many people as possible. **
---
💸💸💸💸💸💸
👇 👇 👇 👇 👇 👇

S&P500 rejection can cause a very bearish start to 2026.The S&P500 index (SPX) hit last Friday its Higher Highs trend-line and got rejected, so far not aggressively.
The 1D RSI rejection though on a Lower Highs trend-line that goes as back as the September 22 High, illustrates a massive Bearish Divergence (Lower Highs against price's Higher Highs), has the potential to accelerate the decline first to the 1D MA100 (red trend-line) and then the lower Support Zone.
As long as the Higher Highs trend-line holds, we expect the index to target 6510 (top of Support Zone) at least within January 2026.
---
** Please LIKE 👍, FOLLOW ✅, SHARE 🙌 and COMMENT ✍ if you enjoy this idea! Also share your ideas and charts in the comments section below! This is best way to keep it relevant, support us, keep the content here free and allow the idea to reach as many people as possible. **
---
💸💸💸💸💸💸
👇 👇 👇 👇 👇 👇

NASDAQ Will this rejection lead to a bearish 2026 opening?Nasdaq (NDX) just got rejected on the Lower Highs trend-line that started after its October 30 All Time High (ATH). With the 4H RSI also rejected on its own Lower Highs trend-line and the 4H MACD forming a Bearish Cross already, we expect this to be the start of a new Bearish Leg, similar to the previous two that followed such Lower Highs rejections.
As a result, the most likely scenario as long as this trend-line remains intact, is for the index to approach the 1D MA100 (red trend-line) again. We expect it to hit at least 24800.
---
** Please LIKE 👍, FOLLOW ✅, SHARE 🙌 and COMMENT ✍ if you enjoy this idea! Also share your ideas and charts in the comments section below! This is best way to keep it relevant, support us, keep the content here free and allow the idea to reach as many people as possible. **
---
💸💸💸💸💸💸
👇 👇 👇 👇 👇 👇

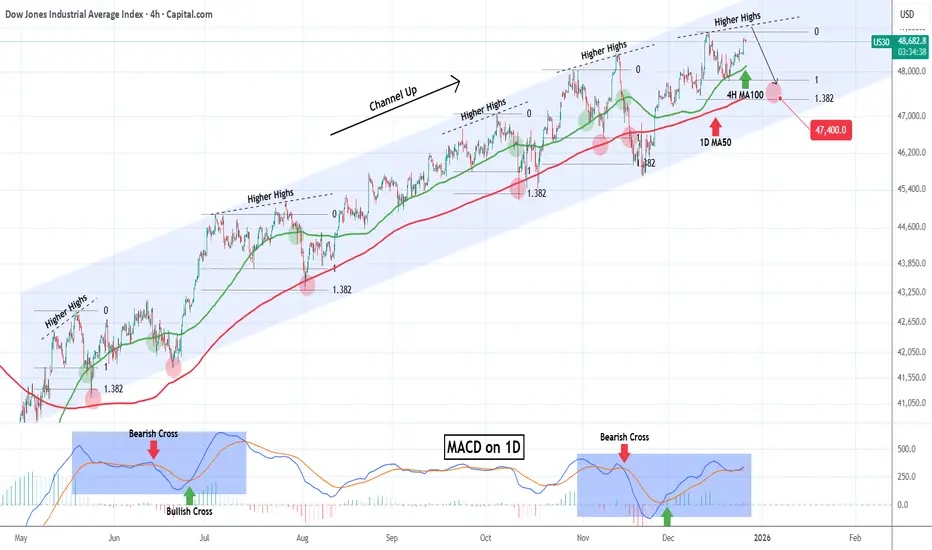
DOW JONES headed towards a rejection.Dow Jones (DJI) has been trading within a nearly 8-month Channel Up and is close to its All Time High (ATH) after rebounding last week on its 4H MA100 (green trend-line).
This pattern is cyclical and every time the latter support broke after a medium-term rally from its 1D MA50 (blue trend-line), the index got rejected on a Higher Highs trend-line and corrected back to the 1D MA50. Even the 1D MACD is printing a sequence similar to June - July.
As a result, we expect the new year to find Dow on its 1.382 Fibonacci extension at 47400 at least, which is the Fib level that every such correction pulled back to.
---
** Please LIKE 👍, FOLLOW ✅, SHARE 🙌 and COMMENT ✍ if you enjoy this idea! Also share your ideas and charts in the comments section below! This is best way to keep it relevant, support us, keep the content here free and allow the idea to reach as many people as possible. **
---
💸💸💸💸💸💸
👇 👇 👇 👇 👇 👇
NASDAQ One final Santa push??Nasdaq (NDX) is rebounding today on its 1H MA50 (blue trend-line), capitalizing on the short 6-day Channel Up that it's been trading in.
With a 1H MACD Bullish Cross confirming the start of the new Bullish Leg, we can expect at least a +2.11% rise (similar to the 1st Bullish Leg) on this one, targeting 25900, as part of the final 'Santa rally' push.
---
** Please LIKE 👍, FOLLOW ✅, SHARE 🙌 and COMMENT ✍ if you enjoy this idea! Also share your ideas and charts in the comments section below! This is best way to keep it relevant, support us, keep the content here free and allow the idea to reach as many people as possible. **
---
💸💸💸💸💸💸
👇 👇 👇 👇 👇 👇

S&P500 mini Santa Rally up next on a 1H Golden Cross.S&P500 (SPX) is about to complete a Golden Cross today on the 1H time-frame. The last time it did that was on November 25, almost 1 month ago, while trading on the first Bullish Leg of the current Channel Up pattern.
Following the 1H Golden Cross, the index rallied to the 1.236 Fibonacci extension level, before turning sideways. As a result this could be the mini Santa Rally that the market is waiting, targeting 6920.
---
** Please LIKE 👍, FOLLOW ✅, SHARE 🙌 and COMMENT ✍ if you enjoy this idea! Also share your ideas and charts in the comments section below! This is best way to keep it relevant, support us, keep the content here free and allow the idea to reach as many people as possible. **
---
💸💸💸💸💸💸
👇 👇 👇 👇 👇 👇

DAX Just confirmed the start of a very strong Bear Cycle.DAX (DE40) has been practically trading sideways since June 2025, a fair range on short-term time-frames but a tight one on long-term ones such as the 1M (monthly) that we are looking at today.
We posted this chart 2 months ago warning of a potential multi-year Top for the market's 16-year Channel Up (this time we view it on 1M instead on 1W) and only last month, it hit its 1W MA50 (blue trend-line) for the first time since the April low.
We don't need to mention again the specifics of this pattern's cyclical behavior, such as why Phase 3 seems to have already topped due to hitting the 1.618 and 2.236 Fibonacci extensions on two different measurements. Those where analyzed extensively on the previous publication.
But what we do want to bring to you is that the 1M RSI has been trading downwards since hitting its 80.00 Resistance, a level that was last tested in 2007! This is a clear Bearish Divergence on a wide scale and couple with the fact that the 1M MACD just completed a Bearish Cross, all the basic conditions for a Cycle Top have been met. As you can see, since the 2008 U.S. Housing Crisis, every 1M MACD Bearish Cross was formed on a market Top and signaled an aggressive correction.
As a result, we expect 2026 to be a Bear Cycle, and Phase 4 historically has corrected to at least the 0.382 Fibonacci retracement level, while also hitting the 1W MA200 (orange trend-line). Our 18800 long-term Target fulfills both conditions. Notice also that the 1M RSI has a 14-year Support trend-line as well at 39.00. If this gets hit, it is historically the most optimal signal to buy for the long-term regardless of the price the market will be at the moment.
---
** Please LIKE 👍, FOLLOW ✅, SHARE 🙌 and COMMENT ✍ if you enjoy this idea! Also share your ideas and charts in the comments section below! This is best way to keep it relevant, support us, keep the content here free and allow the idea to reach as many people as possible. **
---
💸💸💸💸💸💸
👇 👇 👇 👇 👇 👇

DOW JONES Multi-month Bear Cycle to 40000 starting.Dow Jones (DJI) has been trading within a 16-year Channel Up since the 2008 Housing Crisis and approximately every 3.5 years (44 months) it tops and starts a technical correction/ Bearish Leg.
All of those Bear Cycles essentially since October 2011 have eventually pulled-back to the 1M MA50 (blue trend-line) at roughly he 0.382 Fibonacci retracement level. Only once time the 1M MA50 broke significantly and that was in March 2020 during the COVID flash crash, which eventually found Support on the 1M MA100 (green trend-line).
As a result, we expect Dow to start its Bear Cycle in 2026. From the current high the 0.382 Fib stands at exactly 40000, which based on its trajectory is where the 1M MA50 is headed by Q3 2026.
---
** Please LIKE 👍, FOLLOW ✅, SHARE 🙌 and COMMENT ✍ if you enjoy this idea! Also share your ideas and charts in the comments section below! This is best way to keep it relevant, support us, keep the content here free and allow the idea to reach as many people as possible. **
---
💸💸💸💸💸💸
👇 👇 👇 👇 👇 👇

S&P500 Will it have a big correction in 2026 back to 5500?The S&500 (SPX) has been trading within a massive 16-year Channel Up since the 2008 U.S. Housing Crisis. Within this pattern it has been repeating various shorter fractals as you can see on this chart it is one that truly stands out.
That's the necessity of the market to correct back to its 1W MA200 (orange trend-line) every time it reaches a Top after an exhaustion rally. With the 1W RSI on a Lower Highs Bearish Divergence (against the price's Higher Highs), there is no better time to consider a market top, thus a strong correction, especially after such a non-stop exhaustion rally since the April 2025 Low.
Based on the 1W MA200 trajectory, we make a fair estimate that contact can be achieved around the 5500 level, which will be our next long-term buy on stocks. Alternatively, if the 1W RSI approaches the 30.00 oversold level, without the index touching 5500, it will be a good idea to Buy regardless of the price.
---
** Please LIKE 👍, FOLLOW ✅, SHARE 🙌 and COMMENT ✍ if you enjoy this idea! Also share your ideas and charts in the comments section below! This is best way to keep it relevant, support us, keep the content here free and allow the idea to reach as many people as possible. **
---
💸💸💸💸💸💸
👇 👇 👇 👇 👇 👇

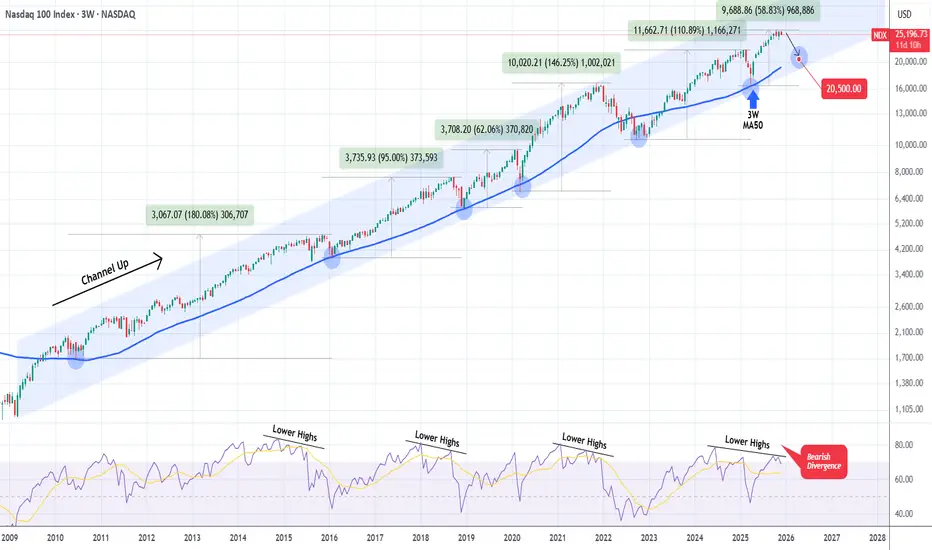
NASDAQ Time to correct hard until it reaches this level again.Exactly 6 months ago (June 20, see chart below), we posted the following analysis on Nasdaq (NDX), which helped us ride the rally following the April 07 2025 market low:
The reasoning behind this was that Nasdaq's low was on its 3W MA50 (blue trend-line), a key Support level which since 2009 and the start of the market's dominant multi-year Channel Up following the 2008 Housing Crisis, has offered 5 perfect long-term buy entries upon contact, only breaking once during the 2022 Inflation Crisis.
Now that the 3W RSI is displaying a Lower Highs Bearish Divergence (against the price's Higher Highs) that has been formed on another 3 prior Cycle Tops, we expect the market to start reversing soon for another cyclical correction. Technically another Bearish Leg for the dominant Channel Up.
Naturally, we expect it to reach at least the 3W MA50 again. Based on its trajectory, it is possible for contact to be made around 20500. Keep in mind again that absolute pricing isn't the important thing here, timing is. The most optimal time to buy based on this high accuracy model, is upon contact with the 3W MA50, regardless of the price it is at, so don't get fixed on 20500, but it is a fair projection based on the trend.
---
** Please LIKE 👍, FOLLOW ✅, SHARE 🙌 and COMMENT ✍ if you enjoy this idea! Also share your ideas and charts in the comments section below! This is best way to keep it relevant, support us, keep the content here free and allow the idea to reach as many people as possible. **
---
💸💸💸💸💸💸
👇 👇 👇 👇 👇 👇
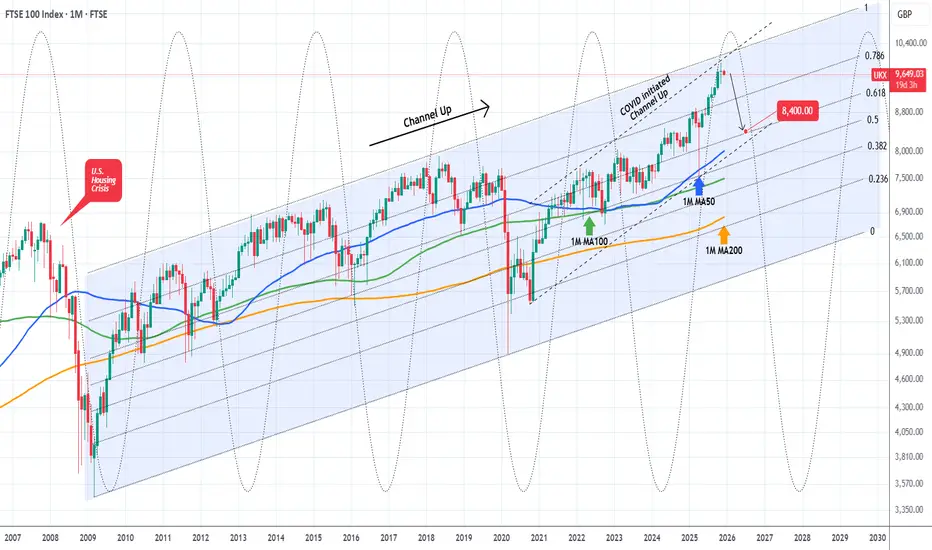
FTSE 100 Is starting a brutal 2026 Bear Cycle.Last time we looked at FTSE 100 (UK100) was 3 months ago (September 19, see chart below) where we gave a strong buy signal at the bottom of its 7-month Channel Up, which methodically hit our 9700 Target:
This time we are switching to the longest time-frame possible, the monthly (1M) as a key development has taken place. We switch our long-term stance to bearish as the index almost hit last month the top of its 16-year Channel Up, which started at the bottom of the 2008 U.S. Housing Crisis, and closed a very volatile November candle flat.
The use of the Sine Waves make the picture even clearer as they point out almost exactly every major Cycle Top since the 2008 Housing Crisis (5 such Cycle including that). And we are on one of them.
At the same time, the index also hit the top of the 5-year Channel Up that started shortly after the COVID crash bottom. Every correction (Bear Cycle/ Bearish Leg) within this pattern hit the 1M MA50 (blue trend-line) and rebounded. With the exception of the COVID flash crash which even broke below its 1M MA200 (orange trend-line), every other Bear Cycle since June 2012, hit the 1M MA100 (green trend-line) and rebounded.
As a result, we are expecting 2026 to be a strong Bear Cycle for FTSE, hitting at least its 1M MA50 at 8400, which is the bottom of the COVID Channel Up as well as the 0.618 Fibonacci retracement level of the post 2008 Channel Up.
---
** Please LIKE 👍, FOLLOW ✅, SHARE 🙌 and COMMENT ✍ if you enjoy this idea! Also share your ideas and charts in the comments section below! This is best way to keep it relevant, support us, keep the content here free and allow the idea to reach as many people as possible. **
---
💸💸💸💸💸💸
👇 👇 👇 👇 👇 👇
DAX Hidden Sell Signal on this 4H Golden Cross?DAX (DE40) has been trading within a Channel Up (green) since its 1W MA50 (red trend-line) market bottom and yesterday it formed a 4H Golden Cross. That is technically a bullish pattern but in the past 5 months, every such formation (3 in total) has been an indication of a market Top, thus a bearish signal.
More specifically, the most it took for DAX to form a top after a 4H Golden Cross within this time-frame, has been 4 days. And as you can see it's also been similar Channel Up patterns that peaked after this Cross, on an identical Lower Highs trend-line like the one that the index is about to test.
What's even more striking is that every sell-off that followed the Tops was exactly -5.15%. Identical on all 3 occasions. As a result, it is possible for DAX to decline as low as 23050 following the upcoming top. Since however the 1W MA50 is involved this time as a Support, you may want to book profits there earlier, around 23300, if you see it acting as a Support with strong buying pressure.
---
** Please LIKE 👍, FOLLOW ✅, SHARE 🙌 and COMMENT ✍ if you enjoy this idea! Also share your ideas and charts in the comments section below! This is best way to keep it relevant, support us, keep the content here free and allow the idea to reach as many people as possible. **
---
💸💸💸💸💸💸
👇 👇 👇 👇 👇 👇

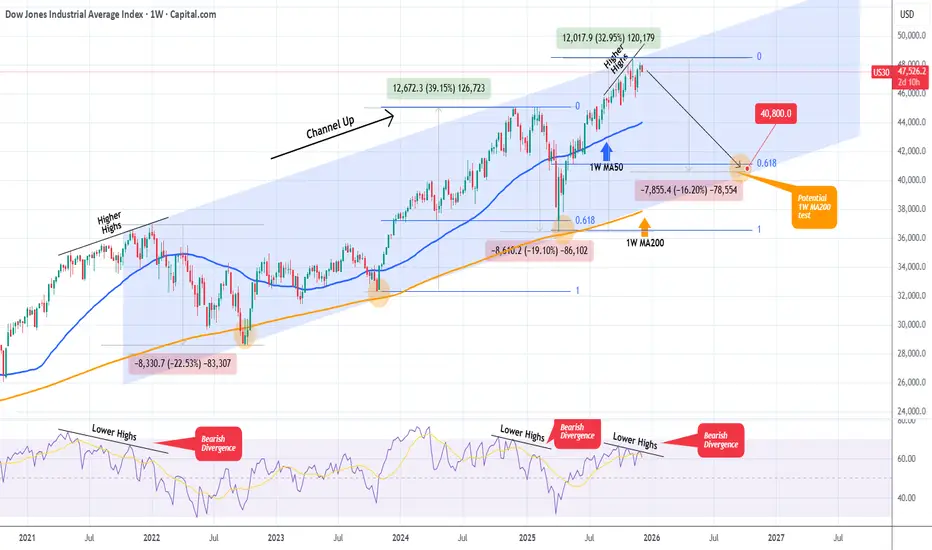
DOW JONES Is it starting a new Bear Cycle towards 40800?Dow Jones (DJI) has been trading within a 4-year Channel Up since the start of the 2022 Inflation Crisis. One month ago it hit the top of this pattern and hasn't made a new High since.
This is increasingly alarming as the 1W RSI is on a Bearish Divergence under Lower Highs against the market's Higher Highs. Every time this took place within this pattern, the index corrected heavily and attempted a 1W MA200 (orange trend-line) test.
As a result, if Dow fails to make a new High, we expect the bearish sentiment to intensify and start a new Bear Cycle (Bearish Leg for the Channel Up) towards its 1W MA200 and the 0.618 Fibonacci retracement level, which was the Target of the previous correction. Based on that it is possible for the index to hit 40800 at the bottom of the Channel Up.
---
** Please LIKE 👍, FOLLOW ✅, SHARE 🙌 and COMMENT ✍ if you enjoy this idea! Also share your ideas and charts in the comments section below! This is best way to keep it relevant, support us, keep the content here free and allow the idea to reach as many people as possible. **
---
💸💸💸💸💸💸
👇 👇 👇 👇 👇 👇
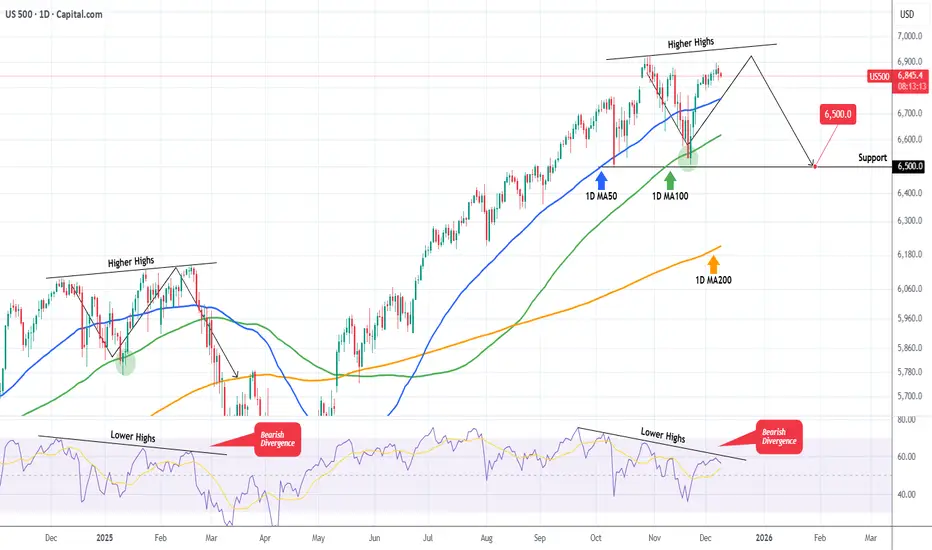
S&P500 The Bearish Divergence that may spoil the party.S&P500 (SPX) is extending a strong rally following the rebound on its 1D MA100 (green trend-line) almost 3 weeks ago. As we pointed out in a previous analysis, the price action of the past 2 months has been identical to the pattern after November 19 2024.
We are currently on the same 1D MA100 rebound towards the Higher Highs trend-line but the key development is that the 1D RSI on both fractals shows a huge Bearish Divergence, being on Lower Highs.
In February 2025 that led to the start of a strong correction in the stock markets. So as long as the 1D RSI Bearish Divergence holds, the S&P500 currently risks a technical correction towards at least the first Support level of 6500.
---
** Please LIKE 👍, FOLLOW ✅, SHARE 🙌 and COMMENT ✍ if you enjoy this idea! Also share your ideas and charts in the comments section below! This is best way to keep it relevant, support us, keep the content here free and allow the idea to reach as many people as possible. **
---
💸💸💸💸💸💸
👇 👇 👇 👇 👇 👇
NASDAQ formed its 1st 4H Golden Cross in 7 months!Nasdaq (NDX) completed last Friday its first 4H Golden Cross formation in more than 7 months (since May 01). This is taking place while the index is inside a Channel Up, making a V-shaped recovery from the November 21 Low.
The last time all the above conditions were fulfilled was exactly during the May Golden Cross. With the 4H MA200 (orange trend-line) as its Support, the index eventually hit its previous All Time High (ATH).
As we've entered the Fed week, we can finally see this move to the ATH Resistance, so our short-term Target on Nasdaq remains 26200.
---
** Please LIKE 👍, FOLLOW ✅, SHARE 🙌 and COMMENT ✍ if you enjoy this idea! Also share your ideas and charts in the comments section below! This is best way to keep it relevant, support us, keep the content here free and allow the idea to reach as many people as possible. **
---
💸💸💸💸💸💸
👇 👇 👇 👇 👇 👇

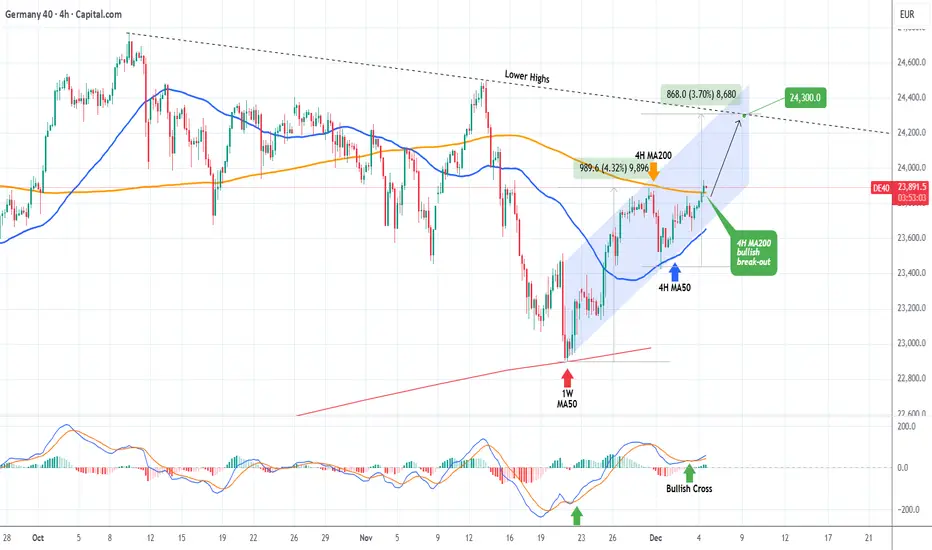
DAX Strong 4H break-out targeting 24300.DAX (DE40) has been trading within a Channel Up since the November 20 bottom on the 1W MA50 (red trend-line) and today it made a massive step upwards as it broke above its 4H MA200 (orange trend-line) for the first time in 3 weeks.
With the 4H MA50 (blue trend-line) established as the Support on the previous Higher Low, we expect this Bullish Leg to hit at least the 2-month Lower Highs trend-line at 24300.
---
** Please LIKE 👍, FOLLOW ✅, SHARE 🙌 and COMMENT ✍ if you enjoy this idea! Also share your ideas and charts in the comments section below! This is best way to keep it relevant, support us, keep the content here free and allow the idea to reach as many people as possible. **
---
💸💸💸💸💸💸
👇 👇 👇 👇 👇 👇
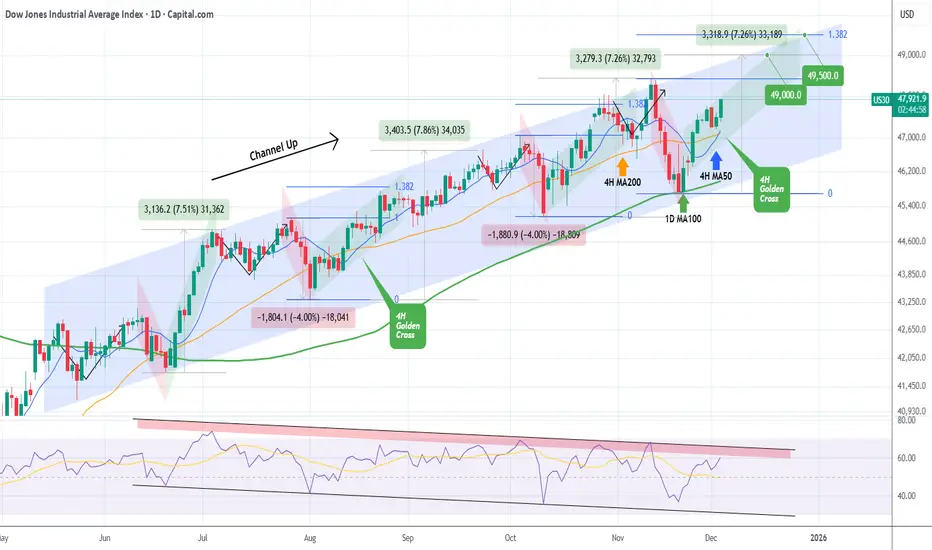
DOW JONES formed its first 4H Golden Cross since August. BullishDow Jones (DJI) has been trading within a 6-month Channel Up and today it formed its first 4H Golden Cross since August 15. Coming off a Higher Low bottom 2 weeks ago on the 1D MA100 (green trend-line), we are currently on the new Bullish Leg of the pattern.
The last one rose by +7.26%, roughly the % amount of the previous two as well, so our immediate Target remains 49000 as we've shown on last weeks analysis.
This time we also see an over-extended Target if the end-of-year rally lasts a bit longer, on the 1.382 Fibonacci extension at 49500, as this level has been hit on every Bullish Leg of this pattern.
If the 1D RSI though hits its Lower Highs Zone (red) earlier, it might be a good idea technically to book profits before those Targets are reached.
---
** Please LIKE 👍, FOLLOW ✅, SHARE 🙌 and COMMENT ✍ if you enjoy this idea! Also share your ideas and charts in the comments section below! This is best way to keep it relevant, support us, keep the content here free and allow the idea to reach as many people as possible. **
---
💸💸💸💸💸💸
👇 👇 👇 👇 👇 👇
S&P500 Next stop.. 6925The S&P500 index (SPX) is about to complete the Right Shoulder of the Inverse Head and Shoulders (IH&S) pattern that took it from the bottom of the 1D MA100 (green trend-line) contact to having recovered the 0.786 Fibonacci level of the whole correction.
The next technical Target is of course the 6925 All Time High (ATH). Since however we are about to form a 4H MA50/100 Bullish Cross, a technical pull-back is expected as both previous such crosses since August 13, resulted into a short-term Top.
If the IH&S completes its technical expansion, then after this correction, a test of the 2.0 Fibonacci extension at 7200 is possible.
---
** Please LIKE 👍, FOLLOW ✅, SHARE 🙌 and COMMENT ✍ if you enjoy this idea! Also share your ideas and charts in the comments section below! This is best way to keep it relevant, support us, keep the content here free and allow the idea to reach as many people as possible. **
---
💸💸💸💸💸💸
👇 👇 👇 👇 👇 👇

NASDAQ Santa Rally already underway.Nasdaq (NDX) has made a strong V-shaped recovery on its 1D MA100, as projected on our previous analysis and is extending the uptrend above the 4H MA200 (orange trend-line).
The rally may need a relief pull-back towards its 4H MA50 (blue trend-line) but technically, the seasonal end-of-the-year 'Santa Rally' is already underway.
V-shaped recovery and Inverse Head and Shoulders patterns typically target their 2.0 Fibonacci extensions. That is currently at 26600.
---
** Please LIKE 👍, FOLLOW ✅, SHARE 🙌 and COMMENT ✍ if you enjoy this idea! Also share your ideas and charts in the comments section below! This is best way to keep it relevant, support us, keep the content here free and allow the idea to reach as many people as possible. **
---
💸💸💸💸💸💸
👇 👇 👇 👇 👇 👇

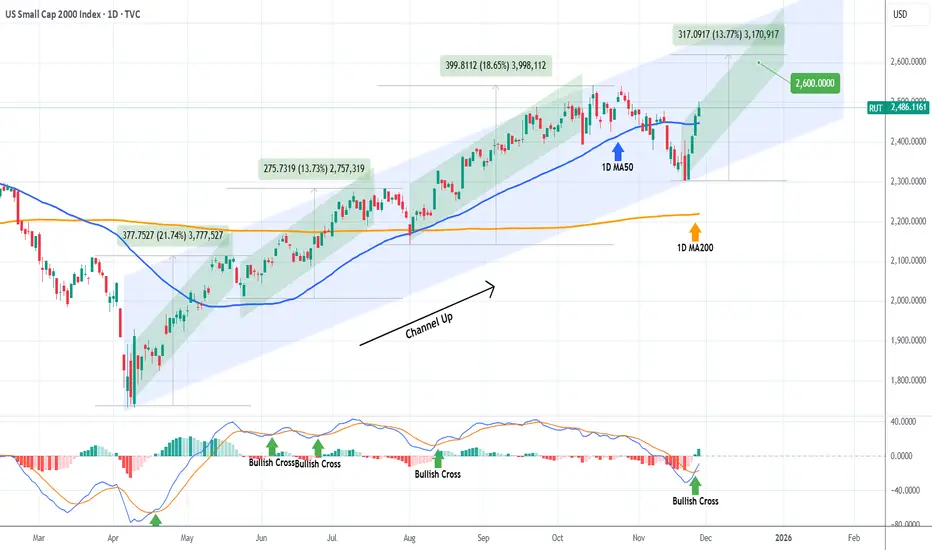
RUSSELL targeting 2600 on this Bullish Leg.Russell 2000 (RUT) has been trading within an 8-month Channel Up since the April 07 market bottom and following its latest correction (Bearish Leg), it recovered this week its 1D MA50 (blue trend-line), having already started the new Bullish Leg.
The minimum rise a Bullish Leg had within this pattern has been +13.73%. As a result, we expect the current one to hit at least 2600. Notice also the 1D MACD Bullish Cross, which has always been a confirmation of a new rally.
---
** Please LIKE 👍, FOLLOW ✅, SHARE 🙌 and COMMENT ✍ if you enjoy this idea! Also share your ideas and charts in the comments section below! This is best way to keep it relevant, support us, keep the content here free and allow the idea to reach as many people as possible. **
---
💸💸💸💸💸💸
👇 👇 👇 👇 👇 👇