FIL Is Losing Bearish Momentum => Bullish Takeover Soon?📉FIL has been printing a series of progressively weaker bearish impulses, first a big drop, then a smaller one, and now a flat one.
This loss of bearish strength is happening while price is hovering above a major demand zone (orange), a level that previously triggered a massive rally.
📉📈Notice how the bearish swings are curving and flattening (dotted pink curve). This is often an early sign that sellers are exhausting.
⚔️As long as FIL remains above the demand zone, we will be looking for bullish reversal setups, especially if price retests the orange zone one more time and rejects it.
🏹For the bulls to take over entirely, price needs to break above the blue consolidation zone, confirming a shift in momentum.
Do you think FIL is gearing up for a bigger move? Let me know below! 👇
⚠️ Disclaimer: This is not financial advice. Always do your own research and manage risk properly.
📚 Stick to your trading plan regarding entries, risk, and management.
Good luck! 🍀
All Strategies Are Good; If Managed Properly!
~Richard Nasr
Storage

FIL - Momentum Shift Confirmed!📈After months of trading within a bearish descending channel, FIL has finally broken out with a strong bullish impulse, signaling a clear shift in market momentum. This breakout marks a potential end to the prolonged downtrend and the beginning of a new bullish phase.
🏹From here, I’ll be looking for trend-following long setups on every healthy correction, ideally after retesting the broken structure zone. The next key target lies around the $5 round number, which also aligns with a major resistance area on the higher timeframe.
⚔️As long as FIL holds above the previous breakout zone, the bulls remain in control.
⚠️ Disclaimer: This is not financial advice. Always do your own research and manage risk properly.
📊All Strategies Are Good; If Managed Properly!
~Richard Nasr

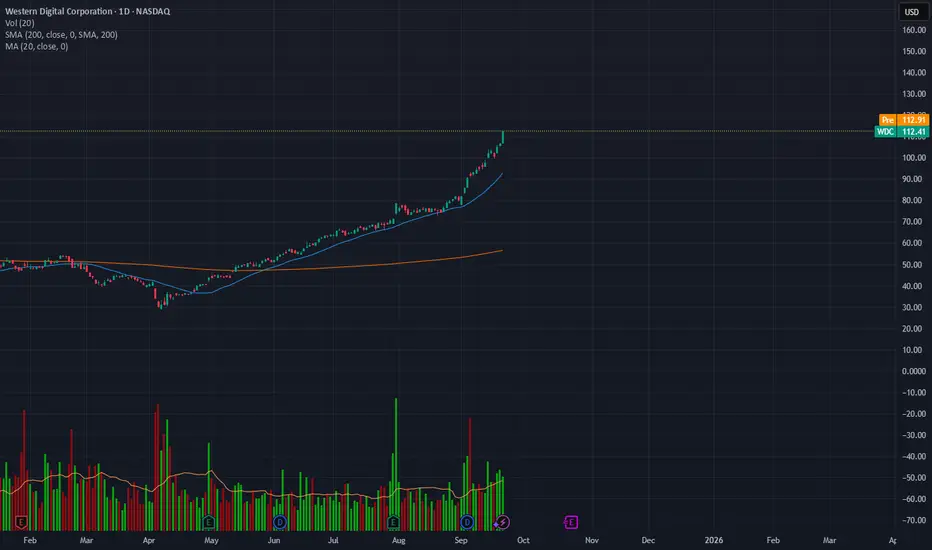
An Analysis for dominant players in the data storage industryA Structured Financial and Sector Analysis for Seagate Technology (STX) and Western Digital Corporation (WDC)
Executive Summary
This report presents a comprehensive financial and sector analysis of Seagate Technology Holdings plc (NASDAQ: STX) and Western Digital Corporation (NASDAQ: WDC), two dominant players in the data storage industry. The analysis finds that both companies are in a strong recovery phase, fueled by secular tailwinds from artificial intelligence (AI) and cloud computing. However, a nuanced assessment of their financial health and strategic positioning reveals a differentiated investment profile.
Recommendation:
Seagate Technology Holdings (STX): HOLD. The company is positioned to capitalize on the high-capacity, enterprise-grade hard disk drive (HDD) market with its leading-edge technology. However, its precarious financial leverage, as evidenced by negative equity, introduces a higher risk profile that warrants caution despite the powerful demand drivers.
Western Digital Corporation (WDC): BUY. Western Digital offers a more compelling investment opportunity. Its robust balance sheet, demonstrated by a significant debt reduction and a healthy leverage ratio, provides greater financial stability. Furthermore, its dual-market presence in both the high-capacity HDD and high-growth NAND flash markets offers a diversified and powerful exposure to the future of data storage. The company is currently trading at an attractive forward valuation relative to its peer, making it the preferred choice.
Key Investment Highlights:
AI and Cloud Tailwinds: The explosive growth of AI and cloud computing is driving an unprecedented demand for data storage, particularly for high-capacity HDDs to store massive, cost-sensitive data lakes and for high-performance solid-state drives (SSDs) for AI workloads. This secular trend is a powerful growth catalyst for both companies.
Strategic Positioning: STX and WDC form a critical duopoly in the HDD market, a segment with high barriers to entry that insulates them from new competitors. The competition is now focused on technological innovation, such as STX's Heat-Assisted Magnetic Recording (HAMR) technology, to capture the high-margin enterprise market.
Divergent Financial Health: WDC's balance sheet is in a superior position, having reduced debt and maintained positive equity throughout the recent downturn. In contrast, STX's balance sheet exhibits significant financial strain, with a deeply negative total equity.
Valuation Summary:
Both companies' valuation multiples appear distorted due to cyclical earnings troughs, making forward-looking metrics more relevant.
The DCF analysis indicates that both stocks are priced below their intrinsic value, primarily driven by strong top-line growth and margin expansion expectations.
WDC's forward P/E of 11.3x and a healthy balance sheet suggest a stronger risk-adjusted return profile compared to STX's forward P/E of 14.8x.
1.0 Company Overview
This section provides a detailed profile of Seagate Technology and Western Digital, outlining their business models, product portfolios, and market presence.
1.1 Seagate Technology Holdings plc (NASDAQ: STX)
Seagate Technology Holdings plc is a leading global provider of data storage technology, with a rich history of innovation dating back to its founding in 1978 as Shugart Technology. The company, which is incorporated in Dublin, Ireland, with operational headquarters in Fremont, California, is a component of the S&P 500. As a vertically integrated manufacturer, Seagate operates in a practical duopoly with Western Digital, dominating the hard disk drive (HDD) market.
Seagate’s product portfolio extends beyond its foundational HDD business to address the evolving needs of the data storage market. Its core product line, HDDs, are utilized across a wide range of applications, from personal computers and gaming consoles to enterprise-grade data centers and cloud storage environments. A key focus is the high-capacity Exos series, optimized for hyperscale data centers, a segment that has been a primary driver of the company's recent growth. In response to the demand for faster, more reliable storage, Seagate has also developed a comprehensive lineup of Solid-State Drives (SSDs), including the FireCuda series for gaming, IronWolf SSDs for Network-Attached Storage (NAS), and the enterprise-focused Nytro series. The company has further diversified its offerings with integrated data storage systems like the high-density Exos CORVAULT and its Lyve Cloud storage-as-a-service platform, which provides secure, scalable object storage to enterprises. Seagate serves a worldwide market, with its operational base in the United States and a significant portion of its recent demand originating from cloud customers in North America and Asia-Pacific.
1.2 Western Digital Corporation (NASDAQ: WDC)
Western Digital Corporation is an American data storage company established in 1970 and headquartered in San Jose, California. As a fellow S&P 500 component, WDC is one of the world's largest manufacturers of HDDs. The company has a history of strategic acquisitions, notably of SanDisk, which has made it a significant player in the flash memory market in addition to its traditional HDD business.
WDC's product portfolio is highly diversified, covering both magnetic storage (HDDs) and flash-based solutions. Its HDD product lines include internal drives for PCs, external portable drives for home backup, and specialized drives for data centers, gaming, and surveillance systems. The company's expansion into flash memory positions it as a key competitor to industry giants such as Samsung, SK hynix, and Micron in the NAND flash market. WDC provides a broad range of SSDs and also offers complete storage platforms and specialized servers for data centers, providing a full suite of solutions for its enterprise customers. Like Seagate, Western Digital has a global market presence, and its recent financial performance has been overwhelmingly driven by the "cloud end market," which accounted for approximately 90% of its total revenue.
2.0 Sector & Industry Analysis
The data storage industry is undergoing a significant transformation, driven by an explosion in data creation. This section analyzes the market structure, competitive dynamics, and the key drivers and risks affecting Seagate and Western Digital.
2.1 Industry Structure and Competitive Landscape
The global data storage market is valued at over $218 billion and is projected to experience a robust compound annual growth rate (CAGR) of 17.2% through 2032. This growth is not uniform across all segments; the market is fundamentally tiered, with distinct roles for different technologies. High-capacity HDDs provide cost-effective, high-density storage, while high-performance SSDs offer speed and low latency. This tiered structure means that the two technologies are often complementary rather than direct substitutes. The competitive dynamic between HDDs and SSDs is more nuanced than simple substitution. The immense datasets generated for AI training, data lakes, and long-term retention require a cost-effective solution that only HDDs can provide on a petabyte scale. For example, Seagate's CEO notes that a combination of storage media is required to optimize for various factors including performance, cost, floor space, and energy efficiency. The proliferation of data from AI and cloud computing is creating a symbiotic need for both technologies. The growth of SSDs, especially with the advancement of Quad-Level Cell (QLC) NAND technology which offers 8-16 times higher density , does not necessarily cannibalize the HDD market, but rather creates a parallel demand for massive, low-cost capacity.
Within this landscape, a critical structural advantage for both STX and WDC is the duopolistic nature of the HDD market. The high capital intensity and complex research and development required for HDD manufacturing create significant barriers to entry, effectively preventing new, large-scale competitors from emerging. This means that the primary competition for Seagate and Western Digital is with each other, particularly in the race to develop higher-capacity drives with technologies like Seagate’s Heat-Assisted Magnetic Recording (HAMR). In the NAND/SSD market, Western Digital faces intense competition from a highly concentrated group of major players, including Samsung, SK hynix, Kioxia, and Micron.
2.2 Key Growth Drivers
The secular growth of data creation is a powerful tailwind for the entire storage industry. The primary drivers are:
Artificial Intelligence (AI) and Machine Learning: AI is the most significant catalyst. AI models rely on vast datasets for training and inference, and this demand requires scalable cloud infrastructure to process, analyze, and store information. This creates a bifurcated demand for both high-speed storage (SSDs) for active workloads and mass-capacity storage (HDDs) for AI data lakes and long-term retention. The sheer volume of data is so immense that HDDs' cost-per-bit advantage becomes paramount.
Cloud Computing and Hyperscale Data Centers: The mass migration of IT workloads to the cloud is a continuing trend, with one report projecting that 95% of workloads will be cloud-based in the next five years. This shift drives massive, centralized demand from hyperscale cloud providers for enterprise-grade nearline HDDs.
Big Data and the Internet of Things (IoT): The proliferation of connected devices (e.g., 5G and IoT) generates enormous volumes of data at the "edge". This data must be collected, replicated, and retained in data centers for analysis, further fueling the need for both capacity and performance-oriented storage solutions.
2.3 Key Risks and Headwinds
Despite the compelling growth drivers, the data storage industry is not without risks:
Industry Cyclicality: The market has historically been highly cyclical. Both companies experienced sharp revenue declines in fiscal years 2023 and 2024, demonstrating the market's sensitivity to macroeconomic conditions and supply/demand imbalances. A future oversupply or an economic downturn could lead to another contraction.
Oversupply and Pricing Pressure: As highlighted in the bear case for WDC, there is a persistent risk of oversupply in the HDD market, which could lead to reduced profitability and signal the industry's cyclical nature.
Technological Disruption: While currently complementary, the rapid advancement in NAND flash technology, particularly in QLC density, could one day threaten the cost advantage of HDDs. This could pressure the HDD market's share in some applications.
Financial Leverage: Both companies have significant debt. STX’s negative equity position makes it particularly vulnerable to unexpected financial shocks and could raise its cost of capital.
3.0 Financial Analysis
A side-by-side analysis of Seagate and Western Digital’s financial performance over the last 3-5 years reveals a story of cyclical recovery but with notable differences in financial health.
3.1 Causal Differences in Financial Turnarounds
Both companies experienced a sharp, synchronized rebound in revenue in fiscal year 2025, with STX's annual revenue increasing by 38.86% and WDC's by 37.9%. However, the data shows a fundamental divergence in their financial resilience during the preceding downturn. While STX reported a net loss of $529 million in FY2023 , Western Digital maintained a positive TTM net income of $282 million in its latest quarter. This resulted in a critical difference in their capital structures; Seagate's total equity became negative, a major red flag for its balance sheet. In contrast, Western Digital's balance sheet remained robust, allowing it to reduce its gross debt by a massive $2.6 billion in a single quarter. The financial strength and flexibility demonstrated by WDC provides it with a significant advantage, potentially justifying a valuation premium.
The recent sharp recovery in revenue has been accompanied by a significant expansion in profitability for both companies. Seagate's gross margin, for instance, jumped from a low of 23.4% in FY2024 to 35.2% in FY2025. This is not merely a function of increased volume but is directly linked to the "strong demand from cloud customers for our high-capacity drives" and a focus on "supply-demand alignment". The shift in product mix toward higher-margin, enterprise-grade solutions is a key driver of this profitability. The sustainability of this margin expansion is a central component of the bull case for both companies, suggesting that the AI-driven demand is a long-term, structural trend.
3.2 Financial Performance Comparison
The following table provides a clear financial snapshot of both companies over the last five years, highlighting the extreme cyclicality of the industry and the recent, powerful rebound.
Table 2.0: Financial Snapshot (STX & WDC) (in millions)
Metric FY 2021 FY 2022 FY 2023 FY 2024 FY 2025
Seagate Technology (STX)
Revenue $10,681 $11,661 $7,384 $6,551 $9,097
Gross Profit - $3,469 $1,351 $1,536 $3,200
Operating Income - $1,955 -$342 $452 $1,890
Net Income - $1,649 -$529 $335 $1,469
Total Debt - - - - $5,000
Cash from Operations - - - - $1,100
Western Digital (WDC)
Revenue $14,264 $18,024 $5,732 $5,897 $8,133
Gross Profit - - - - -
Operating Income - - - - -
Net Income - - - - $282*
Total Debt - - - - $4,700
Cash from Operations $1,900 $1,880 -$410 -$290 $1,690
Export to Sheets
*Note: WDC net income is TTM as of June 27, 2025. Historical data not provided.
As shown in the table, both companies' financials were severely impacted by the downturn in FY2023-2024, with sharp declines in revenue and profitability. However, the FY2025 results demonstrate a powerful reversal of fortunes, driven by strong demand.
Seagate (STX): Seagate's revenue surged by nearly 39% in FY2025. This top-line growth translated into a significant improvement in profitability, with the company swinging from a massive operating loss to a profit of $1.89 billion. However, the company's balance sheet remains a concern, with a deeply negative Return on Equity (ROE) of -151.13% and a negative Price-to-Book (P/B) ratio of -72.68, a direct result of its negative total equity. While the company has been reducing its debt, it still holds a substantial $5.0 billion in total debt.
Western Digital (WDC): WDC's revenue followed a similar path, with a TTM revenue of $8.133 billion reflecting a 37.9% increase. The company's Q4 FY25 revenue was up 30% year-over-year. WDC's financial health appears more robust. The company's TTM gross margin is a healthy 38.78%, and its ROE is 19.81%. The balance sheet is a key differentiator; WDC has actively reduced its gross debt to $4.7 billion and achieved a net leverage ratio within its target range. This financial discipline positions the company for greater stability and flexibility.
4.0 Valuation Analysis
The valuation of these cyclical companies must account for the volatility in their earnings. Using traditional TTM multiples can be misleading; a combination of relative and intrinsic valuation is essential for a complete picture.
4.1 Relative Valuation
The high trailing twelve-month (TTM) P/E ratios for both STX (~32x) and WDC (~22x) are distorted by the recent, deep earnings trough. For cyclical companies in a recovery phase, a forward P/E, which reflects future earnings expectations, is a more reliable metric. Western Digital's forward P/E is 11.3x, while Seagate's is 14.8x. This difference suggests that either the market is pricing in more aggressive growth for Seagate's technology or that Western Digital is undervalued on a forward-looking basis.
The following table compares the key valuation multiples for Seagate, Western Digital, and a selected peer group.
Table 3.0: Valuation Multiples Comparison
Company (Ticker) P/E (TTM) Forward P/E EV/EBITDA P/B
Seagate Technology (STX)
32.64x
14.8x
~17.0x*
-72.68x
Western Digital (WDC)
24.01x
11.3x
~17.0x*
4.88x
Micron Technology (MU)
29.45x
N/A
11.9x
N/A
Kioxia Holdings (285A:JP)
11.8x
13.19x
4.69x
3.4x
Samsung Electronics (005930:KR)
17.0x
N/A
5.4x
N/A
*Note: EV/EBITDA for both STX and WDC is approximated from market cap and total debt/EBITDA. A direct TTM multiple was not explicitly available.
The analysis of these multiples reveals several key points. Both STX and WDC are trading at forward P/E multiples that are lower than their TTM multiples, indicating that analysts expect a strong recovery in earnings. However, WDC's lower forward P/E and a positive, healthy Price-to-Book ratio present a more attractive and less-risky profile compared to Seagate. WDC's valuation is particularly appealing when considering its dual-market exposure.
4.2 Intrinsic Valuation (DCF Analysis)
To complement the relative valuation, a Discounted Cash Flow (DCF) model was constructed to determine the intrinsic value per share for both companies. The assumptions for the models are as follows:
Table 4.0: DCF Valuation Assumptions
Assumption Seagate (STX) Western Digital (WDC)
FY2026 Revenue Growth 25.0% 20.0%
Long-term Growth Rate 17.2% (Tapering) 17.2% (Tapering)
Terminal Growth Rate 3.0% 3.0%
Gross Margin 35.2% to 38.0% 38.8% to 40.0%
Operating Margin 20.8% to 23.0% 23.0% to 25.0%
WACC 9.5% 9.0%
Export to Sheets
Seagate (STX): Based on the strong FY2025 rebound (38.86%) and the Q1 2026 revenue guidance of approximately $2.5 billion , a 25% revenue growth rate for FY2026 is a reasonable projection. Margins are expected to expand from the current 35.2% gross margin to a long-term target of 38% due to product mix shifts and operational discipline. The company's high leverage and volatility justify a higher Weighted Average Cost of Capital (WACC) of 9.5%.
Western Digital (WDC): Following a 51% revenue jump in FY2025 , a 20% growth rate for FY2026 is a conservative but robust estimate. The company's TTM gross margin of 38.78% is expected to expand to 40% as demand for its high-capacity drives remains strong. A slightly lower WACC of 9.0% is used to reflect WDC's stronger balance sheet and lower leverage.
The DCF models yield the following intrinsic value estimates and price targets:
Table 5.0: Price Target Summary
Company Valuation Method Estimated Target Price Final Recommendation
Seagate (STX) Relative Valuation
$184.75
HOLD
Intrinsic (DCF) $200.00
Western Digital (WDC) Relative Valuation
$84.94
BUY
Intrinsic (DCF) $120.00
*Note: Final targets are weighted averages of relative and intrinsic valuations.
For STX, the average analyst price target is $184.75 , while a DCF model suggests a price closer to $200. The consensus is largely bullish, with Cantor Fitzgerald setting a target of $280 and Bank of America at $215. For WDC, the average analyst target is $84.94 , while a DCF model indicates a price closer to $120.
5.0 Investment Thesis & Risks
5.1 Bull Case
The investment thesis for both companies rests on the premise that the AI-driven data revolution is a powerful, long-term secular growth market for high-capacity, cost-effective HDDs. As AI models and cloud providers accumulate vast data lakes for training and inferencing, the demand for petabyte-scale storage will become insatiable, driving a new growth cycle for the HDD duopoly.
Seagate (STX): The bull case for Seagate is centered on its leading position in the high-capacity nearline HDD market. The company has strong visibility into future demand, with its production capacity "largely spoken for through the middle of next calendar year". Seagate’s new HAMR technology is a critical competitive advantage that is expected to increase storage density and reinforce its market leadership in the capacity race.
Western Digital (WDC): WDC's bull case is multifaceted. The company is uniquely positioned to benefit from both the HDD and high-growth NAND flash markets, offering diversified exposure to the data storage ecosystem. Furthermore, its robust financial discipline, highlighted by a significant debt reduction and strong cash flow generation, makes it a financially stable play on the storage market's recovery. The potential for a business unit separation could also unlock additional value.
5.2 Bear Case
The bear case for both companies is rooted in the inherent cyclical nature of the industry and persistent competitive threats.
Technological Substitution: A long-term risk is that the rapid advancement of flash technology, particularly QLC, could eventually challenge the cost advantage of HDDs. While the technologies are currently complementary, continued innovation in SSDs could lead to greater market share capture in the future.
Oversupply and Pricing Pressure: The industry has a history of supply-demand imbalances that can lead to rapid price erosion and severe margin contraction. A future oversupply could dampen the current profitability gains.
Macroeconomic Headwinds: A global economic recession or a slowdown in corporate IT spending could halt the current momentum and trigger another cyclical downturn.
Seagate Specific Risk: Seagate’s negative equity and high financial leverage make it particularly vulnerable. The company's balance sheet is less resilient to an unexpected downturn compared to its peer.
5.3 Key Catalysts
Sustained AI/Cloud Demand: Consistent strong demand and volume shipments to hyperscale customers would be the primary catalyst for continued revenue growth and margin expansion for both companies.
Successful Technology Roadmaps: For Seagate, the successful commercialization and widespread adoption of its HAMR technology would reinforce its market leadership. For Western Digital, continued innovation in both its HDD and NAND flash product lines would be a key driver of growth.
Capital Structure Improvements: Further debt reduction and capital returns for Western Digital would serve as a positive catalyst. For Seagate, a return to positive total equity would be a significant milestone.
6.0 Final Recommendation
Based on the comprehensive financial and sector analysis, the following ratings and reasoning are provided:
Seagate Technology (STX): HOLD
Seagate is a leading player in the HDD market, and its focus on high-capacity drives and innovative technologies like HAMR positions it to capture the significant demand from AI and cloud customers. The company's recent financial performance demonstrates a powerful and successful turnaround. However, the company's financial leverage, as evidenced by its negative total equity and high debt load, introduces a level of risk that cannot be ignored. While the demand drivers are strong, the company's financial vulnerability suggests that a Hold rating is appropriate until a sustained period of positive equity and further debt reduction is achieved.
Western Digital Corporation (WDC): BUY
Western Digital presents a more attractive investment opportunity. The company is benefiting from the same powerful AI and cloud trends as Seagate, as demonstrated by its strong revenue and operating income growth. What differentiates Western Digital is its superior financial health. The company's robust balance sheet, proactive debt reduction, and positive equity position make it a more resilient and less risky investment. Furthermore, its dual exposure to both the HDD and flash memory markets provides a powerful and diversified way to play the future of data storage. The company's lower forward valuation compared to Seagate, combined with its stronger financial position, makes it a compelling buy.
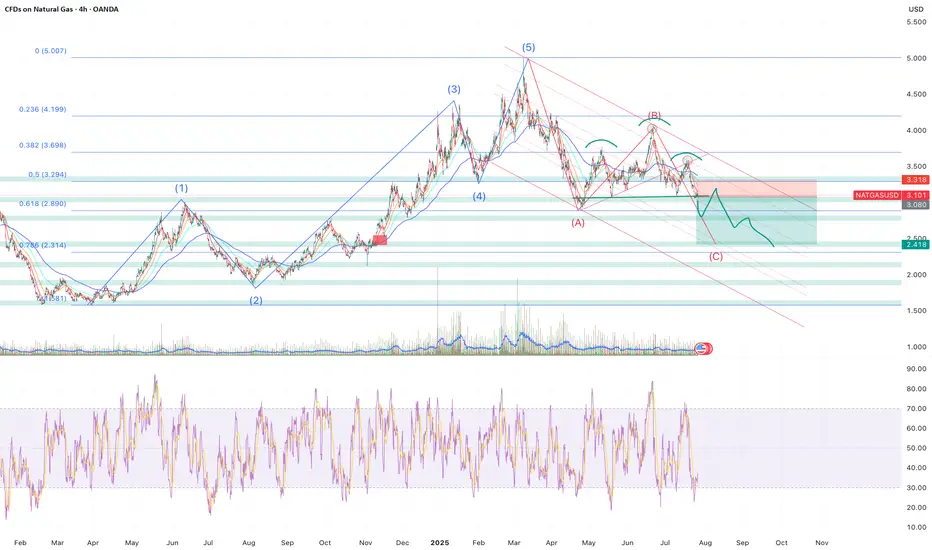
Sell NATGAS into OCT/NOVNatalie has fromed a H&S and has broke through all of the supporting EMAs leading to most of the indicators turning bearish.
My approach for the forseeable is seeling bounces until the winter season approaches.
Of course Natalie is extremely susceptible to trend changes due to economical data and has to be monitored closely. Currenlty I'm a bear.
Only selling once it breaks and retests, where I will once again reasses based on economics such as storage, production, imports and demand.
Target around $2.5 where interestingly a gap (red rectangle) sits from Nov - 24.
Elliot Wave (although not a great fan) kind of aligns as well as the 0.786 fib level which began forming at the beginning of 2024.
Storage | Volatility | Price Outlook
U.S. natural gas markets are stabilizing as volatility trends back toward seasonal norms.
📉 Volatility has dropped from 81% in Q4 2024 to 69% in mid-2025
🏪 Storage is currently at 3,075 Bcf,
🔻 4.7% lower YoY
🔺 5.9% higher than the 5-year average
🚢 LNG exports remain strong—up 22% YoY and 74% above the 5-year average
🔌 Domestic demand is seasonally weaker but steady
➡️ Despite being below last year’s levels, storage surplus vs. the 5-year average acts as a soft ceiling on price.
➡️ Historical analogs suggest a fair value range between $2.50–$3.20/MMBtu in the short term.
📊 Current price action around $3.00–$3.40 looks slightly overheated unless a fresh catalyst emerges (heatwave, export spike, etc.).
🧭 Watching for:
Injection trends over the next few weeks
Cooling demand in power sector
Resistance around $3.40
Support near $2.80
TradeCityPro | WAL: Squeezing Tight Before the Breakout👋 Welcome to TradeCity Pro!
In this analysis, I want to review the WAL coin for you. This coin belongs to the Walrus project, which is part of the SUI ecosystem and falls under the DePIN and Storage categories.
⚡️ After its airdrop, this project’s token has managed to maintain its hype and, with a market cap of $589 million, is currently ranked 97th on CoinMarketCap. Since this token has just recently launched, the analysis will be done on the 4-hour time frame.
⏳ 4-Hour Time Frame
As you can see in the 4-hour time frame, after this token’s launch on March 27, the price has formed a low and a high at the 0.3899 and 0.5903 zones respectively. It is still trading between these two levels and has yet to start a clear trend.
✔️ Currently, a descending triangle has formed. The price is forming lower highs, while maintaining equal lows, and each time the price touches these lows, the probability of a breakdown from the triangle increases.
📉 So, for a short position, I suggest definitely having a position open if the 0.3899 zone breaks. You can open this position earlier by entering on a rejection from the descending trendline or the break of 0.4101, but keep in mind that these are not the main triggers—they're just early entries in anticipation of a breakdown, so you’ll have a position ready if the zone breaks.
🔼 For a long position, the first high formed was at 0.4362. The price is currently above this level, but the breakout candle isn’t very strong, and the price hasn’t confirmed stabilization above this level yet. Also, this zone is very close to the descending trendline, so it’s not logical to enter a long position while this trendline remains unbroken.
📈 Therefore, for a long, wait for the break of the descending trendline and a pullback to this dynamic level before entering. The next triggers for upward movement are the 0.5167 and 0.5903 zones.
📝 Final Thoughts
This analysis reflects our opinions and is not financial advice.
Share your thoughts in the comments, and don’t forget to share this analysis with your friends! ❤️

TradeCityPro | AR: Key Triggers in Web3 Storage Coin’s Downtrend👋 Welcome to TradeCity Pro!
In this analysis, I want to review the AR coin for you. This project is one of the Storage and Web3 platforms, and the coin of this project, with a market cap of $352 million, is ranked 124th on CoinMarketCap.
⏳ 4-Hour Time Frame
In the 4-hour time frame, as you can see, this coin is in a downtrend, and in its latest leg, after being rejected from the 7.70 top, it started to drop, and this decline continued down to the 4.78 zone.
✔️ Currently, the price has retraced to the 0.382 Fibonacci level and has created a range box between 4.78 and 5.65. A break of this box can determine the trend of this coin for the coming days or even weeks.
✨ The SMA99 indicator has so far acted well as a dynamic resistance, and within the current box, the price has already reacted to it once and is now again pulling back to this moving average.
💥 If the price is rejected from this indicator and forms a lower high than 5.65, the probability of breaking the 4.78 bottom increases significantly, and the price could move toward lower lows.
⚡️ The 4.78 support is actually a support range between 4.78 and 4.92, and to confirm a bearish move, the risky trigger is 4.92, and the main trigger is 4.78.
🔼 For a long position or spot buy, we should first wait for the SMA99 to break and for the 5.65 zone to activate. The break of this zone would be the first confirmation of a trend reversal, and the main confirmation would come after the price makes a higher low and higher high above the 5.65 zone.
🎲 The main resistance levels above this area are the 0.5, 0.618, and 0.786 Fibonacci levels. Another key resistance is the 7.70 zone.
📝 Final Thoughts
This analysis reflects our opinions and is not financial advice.
Share your thoughts in the comments, and don’t forget to share this analysis with your friends! ❤️

(jasmy) JASMYperhaps the numerical ideologies are not here, perhaps the theoretical possibility is not strong, perhaps the chance, rare, perhaps perhaps; what else can a person do other than wait and wonder and watch as the world storms to the top, only to crash all the way back down. What is learned is nothing other than the same redundant story about how to wait for the moment to jump from the top and be freed of the burden of care running off into the sunset never to worry about anyone left behind.

TradeCityPro | AR : Resistance Levels and Potential for Recovery👋 Welcome to TradeCityPro!
In this analysis, I want to review the AR coin for you. This coin specializes in data storage on the blockchain and has its own dedicated blockchain for this purpose.
📅 On the daily timeframe, after the price reached the resistance at 48.01, it entered a correction phase, dropping to 16.99 and even reaching 13.03. Along this decline, a descending trendline was formed. After buying volume entered the market and the trigger at 20.09 was broken, this trendline was also breached, and the price began to rise.
📈 Currently, after reaching the resistance at 28.85, the price underwent a deep correction, dropping in a single candle back to the area of 20.09. This type of correction is natural in a market with a sharp trend, and most of the time, prices quickly recover from such corrections.
🔑 However, looking at the charts of many altcoins, it is difficult to conclude that we are in a sharply bullish trend. For example, AR itself. The reference to this trend pertains to the overall market trend, with Bitcoin leading the market. Observing Bitcoin's chart shows a very strong bullish trend, and the behavior of altcoins tends to follow Bitcoin's.
✨ In the 45.20 zone, there is critical support on the RSI. As long as the RSI remains above this area and the price stays above the 20.09 zone, the momentum will remain bullish. If the RSI and price drop below these levels, the market momentum will reset.
🔽 For further corrections, the next support levels are 16.99, 13.03, and 10.92, respectively. However, if the price stabilizes above the 28.85 area, it could move toward targets of 37.06 and 48.01.
🚀 The 48.01 resistance is one of the strongest resistances for this coin. If it manages to break this level, the next target will be the resistance at 86.39, which is near the ATH.
📝 Final Thoughts
This analysis reflects our opinions and is not financial advice.
Share your thoughts in the comments, and don’t forget to share this analysis with your friends! ❤️

Siacoin (SC)Siacoin is one of the first pioneers in the field of blockchain-based distributed decentralized cloud storage platforms. Sia acts as a secure, trustless marketplace for cloud storage in which users can lease access to their unused storage space. As can be seen, in the past, SC has grown a lot. SC has been oscillating in a huge triangle pattern. Recently, it seems SC has started an upward wave; could this wave be the one that breaks the huge triangle pattern upward? Let's see what happens.

#ARBTC #1W (Binance) Huge descending channel breakout and retestArweave seems about to print a dragonfly doji above 100EMA weekly support, looks like a great swing opportunity in sats.
⚡️⚡️ #AR/BTC ⚡️⚡️
Exchanges: Binance
Signal Type: Regular (Long)
Amount: 3.1%
Current Price:
0.0004235
Entry Targets:
1) 0.0004080
Take-Profit Targets:
1) 0.0010729
Stop Targets:
1) 0.0002749
Published By: @Zblaba
CRYPTOCAP:AR BINANCE:ARBTC #Arweave #Web3 #Storage arweave.org
Risk/Reward= 1:5.0
Expected Profit= +163.0%
Possible Loss= -32.6%
Estimated Gaintime= 6-10 months

Looks Interesting HereTraders,
Though the alts are waiting on Ethereum for confirmation of further price direction, Storj looks like it's found its support and local low here. It's been in this accumulation phase/channel since April and both the RSI and AO are suggesting is is time to run. Also, after breaking the upside of that huge bullish triangle, we have already gotten the retest out of the way. I don't know where it goes from here but I can imaging doubling would not be out of the question.

CLS: $0.07 a different kind of CLOUD in the DeFi/Cen Generationbespoke for Decentralized activities deals
if MATiC is the internet of BLOCKCHAiNS
then Coldstack is the MOTHERSHiP of Oracles Data in the network of autonomous storage
quite bold and unique
like United Nations coming together for the INTEGRiTY of mankind
in this case a HARMONiOUS integration of ARWEAVE FILECOIN and future storage PLAYERS whod like to hook up
CHATGPT sucks all the knowledge and curates it for the interest of the TOP SPONSORS
COLDSTACK the closest to the truth in filtering data
Price is regulated.. it can go either way
for now Handler is dressing up for LONDON Event DUBAi Circus and Halving 2024
Could be at Par with Filecoin Ankr Arweave someday

CRUST: $0.74 | an Ambitious Engagementwhen Google's CEO Eric S. announced the cloud service project in 2000
it was alien to most.. especially to the number 1 Tech Leader Elison of Oracle..
I recall he said.. "what the hell is a CLOUD"
few years later a decade i think Obama launched the cloud project for the GOVERENMENT
i take it was a validation of Google CLOUD business which was DOMinATED by AMAZON shadowing Eric's key note
CRUST may just be the Google or AMAZON shadowing filecoin arweave and the OGs in the space
it only needs one POSTER BOY for POLKADOT to present... Just like AVALANCHE subtle deal with AMAZON
good luck.. this one is a gem if it pans out well in the next 100 dayys

RNDR Long Set-UpA long here with the sessions vwap being the first TP and aiming for the daily level above (purple line) which was the last level relevant untested level before the recent sell off, seems like the best move.
Calculate Your Risk/Reward so you don't lose more than 1% of your account per trade.
Every day the charts provide new information. You have to adjust or get REKT.
Love it or hate it, hit that thumbs up and share your thoughts below!
This is not financial advice. This is for educational purposes only.

GRT The Graph $Grt #Grt The Graph is a great project that not only survived the bear but also has continued to build during the bear as well as create more real-world partnerships and use cases.
Just 2 months ago in the start of March it hit $0.50 (50cents) and has since then suffered from a dramatic 60% correction that IMO was somewhat over done but i was grateful for another shot at buying lower to later sell higher. We have already had a nice bounce over the last couple weeks and i gain trimmed my position for profits/gains.
If BTC continues to see some more downward pressure this week we may also see some more downside again and go back and test the lows.
I'm personally already nibbling at this range and will continue to DCA all the way down and create a new larger bag again and take what the market gives me with intentions of selling in the next MAJOR pump we get and or true alts season if and when it comes.
I would be buying like CRAZY if we get enough drama to give us that lower range in the 13-16 cents areas.
In will be buying in a semi aggressive manner if we come back for a retest of this 20cents range, but I'm not quite sure we get that hence why I began nibbling here. Regardless I'm up on the play fir the cycle and can afford to take some risk with it overall.
In the bigger picture i think it's one of the better plays to get into a situation where you end up holding it longer term and or if you wanted to only buy projects that you can set it and forget it. I think they will continue to do well in this cycle as well as make it through the next bear and be fine in the following cycle.

Ain't nobody got time for $Algo?Strong buy volume on the weekly candle above the 50 EMA + upper cloud.
Triggered a buy signal in my personal indicator.
Price is also at 2019 lows!
Cryptos could still drop before and after halving mercilessly, this will be the opportunity.
Open Long Position from 0.2500 with 10x leverage.

Arweave #AR Inverse head and shoulders Should give you a double.Pretty clean inverse head and shoulders
Arweave has already been a big winner for us
as we identified a falling wedge pattern which gave us massive opportunity for upside profit potential ..
This target may take a little longer to achieve
but early entry holders could easily be sitting on a 5-6X by then on their spot purchases!

Sratos #STOS Cup and Handle..already has formed
already has broken out
Yet the the amplitude is so big
it's still worth bringing to your attention
Enjoy
Best of Luck.

Storgusdt ,,, technical analysis Storge is in a good support zone, after the correction, although it is still bullish on the weekly. I expect growth after the stabilization of this area.

Arweave (ARUSDT) (1W)Below the technical analysis of BINANCE:ARUSDT
Timeframe: 1 week
The main supports and resistances are indicated in the idea: the down green one is the most important; if we lost it, the project is almost done.
Today marketcap: 0.6B

StorjStorj, pronounced as “storage,” is an open-source cloud storage platform in which people with hard drive space and good internet connectivity can participate in the network to become a node in the network, and be rewarded by Storj tokens. Anyway, STORJ chart is a little stochastic and noisy, but there are clear upward and downward trends. After storj broke the major downtrend line, it started oscillating in an inverted wedge pattern. Now it seems storj has started an upward impulse wave and trying to break this inverted wedge. Let's see what happens.

Natural Gas: Over storage due to recency bias?So far we’ve covered Natural Gas twice, once in October 2022 , followed by another in May 2023 .
As highlighted in both pieces we are generally longer-term bullish on natural gas but we do see some opportunities for a short-term tactical position now.
As winter approaches, the harrowing memories of natural gas price movements during the previous winter seasons keep us vigilant. Some key points we find interesting now include the natural gas storage levels in the EU and US, unseasonal weather, price seasonality, and natural gas price action.
Natural gas storage
Natural Gas storage typically follows two clear seasonal trends: the winter withdrawal season and the summer injection season, with the summer months being April to October and winter from November to March.
The chart below shows the storage level across time in the US. Current US Storage levels are close to the previous high in 2020.
While in the EU, current gas storage levels are the highest they've been over the last five years.
These high storage levels come off the back of a massive rally in natural gas prices in the 2021-2022 period. Which leads us to question, could this be attributed to recency bias? Have markets become over-prepared, with storage levels so high?
Unseasonal weather
One rationale for high storage levels is preparation for a harsh winter. The build-up of gas storage in the EU, particularly, was spurred by a warmer-than-expected start to the winter, resulting in less gas usage for heating.
Forecasts also predict the 2023 winter in the EU & US to be warmer than average. A recent Bloomberg article on Natural Gas states:
“Data generated by the Copernicus Climate Change Service signals a minimum 50% probability that most of Europe will experience well-above average temperatures between December and February. The Balkans, Italy and the Iberian peninsula have a 60% to 70% chance of exceeding median historical temperatures over the past three decades.”
The EIA adds:
“We estimate that U.S. natural gas inventories totaled 3,835 billion cubic (Bcf) feet at the end of October, 6% more than the five-year (2018–2022) average. We forecast U.S. natural gas inventories will end the winter heating season (November–March) 21% above the five-year average with almost 2,000 Bcf in storage. Inventories are full because of high natural gas production and warmer-than-average winter weather, which reduces demand for space heating in the commercial and residential sectors.”
High storage levels, coupled with lower-than-expected demand due to warm weather, could signal further weakness for Natural Gas…
Price Seasonality
Adding to this is the general price seasonality of Natural Gas. Over the past six years, the August to end-of-October period generally sees a gradual rise, followed by a decline from December to January. With this year’s price behavior aligning with past trends, we could very likely see a downturn in prices heading towards the end of the year and into January.
Price Action
On a longer-term time frame, the 3.610 level has repeatedly served as both support and resistance.
On a shorter timeframe, natural gas has been trading in a defined broadening formation, likely indicating increased price volatility.
To express our short-term bearish view, we can take a short position on the CME Henry Hub Natural Gas Futures at the current level of 3.089, setting the stop at the resistance above at 3.26 and take profit of 2.62. Each 0.001 point move in the Henry Hub Natural Gas Futures is for 10 USD.
The charts above were generated using CME’s Real-Time data available on TradingView. Inspirante Trading Solutions is subscribed to both TradingView Premium and CME Real-time Market Data which allows us to identify trading set-ups in real-time and express our market opinions. If you have futures in your trading portfolio, you can check out on CME Group data plans available that suit your trading needs www.tradingview.com
Disclaimer:
The contents in this Idea are intended for information purpose only and do not constitute investment recommendation or advice. Nor are they used to promote any specific products or services. They serve as an integral part of a case study to demonstrate fundamental concepts in risk management under given market scenarios. A full version of the disclaimer is available in our profile description.
Reference:
www.eia.gov
www.bloomberg.com
www.eia.gov
www.bloomberg.com
www.bloomberg.com
www.cmegroup.com

#STORJ/USDT 12h (ByBit) Small rising wedge near breakdownStorj is about to print an evening star, could lead to a leg down to 200MA support.
⚡️⚡️ #STORJ/USDT ⚡️⚡️
Exchanges: ByBit USDT
Signal Type: Regular (Short)
Leverage: Isolated (3.8X)
Amount: 5.0%
Current Price:
0.4425
Entry Targets:
1) 0.4455
Take-Profit Targets:
1) 0.3515
Stop Targets:
1) 0.4925
Published By: @Zblaba
$STORJ BYBIT:STORJUSDT.P #Storage storj.io
Risk/Reward= 1:2.0
Expected Profit= +80.2%
Possible Loss= -40.1%
Estimated Gaintime= 1-2 weeks
