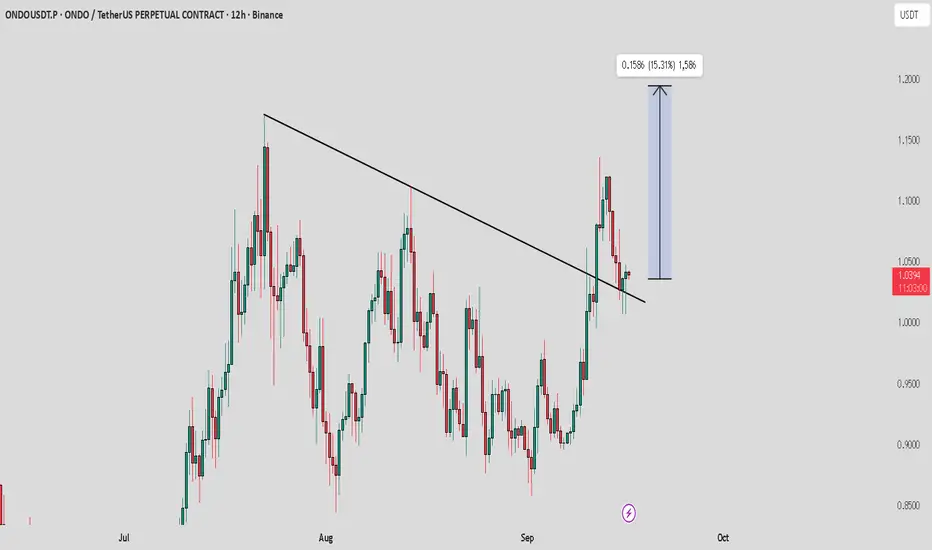
ONDO / USDT : Retest successful , Strong rally aheadONDO/USDT after a successful retest is now ready for a strong rally towards $1.20 – $1.40.
📌 Manage risk wisely.
Structure
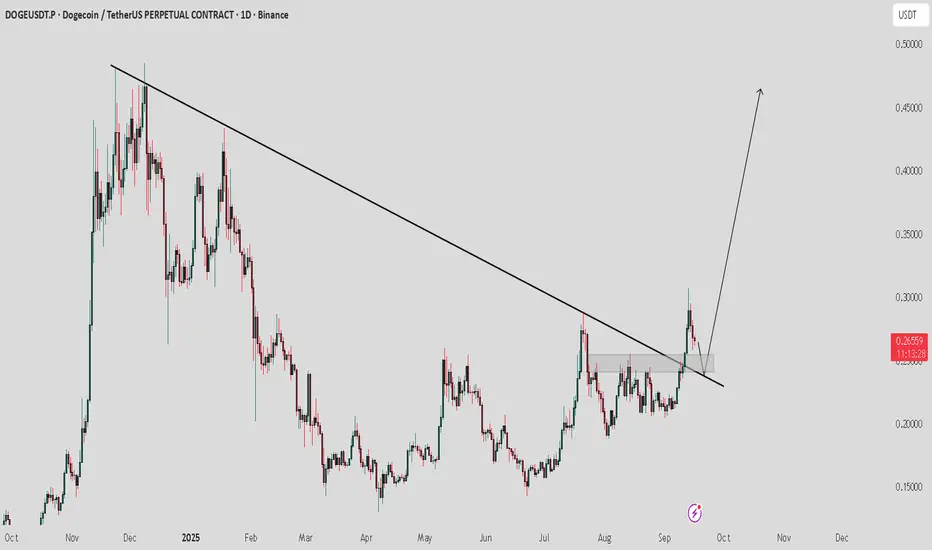
DOGE / USDT : Expecting strong move after successful retestDOGE/USDT has broken out from trendline resistance with strong potential. Currently, a retest is in progress — a successful retest could trigger a bullish rally towards $0.40 – $0.50.
📌 Always wait for confirmation of the bullish move and manage risk wisely.
16.09.25 Morning ForecastPairs on Watch -
FX:AUDJPY
FX:GBPJPY
FX:EURNZD
A short overview of the instruments I am looking at for today, multi-timeframe analysis down to what I will be looking at for an entry. Enjoy!

15.09.25 Morning ForecastPairs on Watch -
FX:GBPJPY
FX:AUDJPY
FX:GBPCAD
FX:GBPNZD
A short overview of the instruments I am looking at for today, multi-timeframe analysis down to what I will be looking at for an entry. Enjoy!

NZDUSD Demand Zone SetupThis is a high probability trade if prices comes down as it broke a significant trendline with a change in structure

Solana ( SOL/USD) - Bullish Continuation SetupBias: Bullish
High-Timeframe (4H/1H):
Structure is clearly bullish. Price has broken significant highs, showing strong upward momentum. HTF structure has been mapped and refined, indicating that smart money is in control and continuation is likely.
Mid-Timeframe (30M):
Dropped down to monitor continuations. Structure is aligned with HTF bullish intent and has been refined at its finest. Currently waiting for a deep sell-side liquidity sweep to properly mitigate the internal order blocks within the framework. Patience is key here—no premature entries.
Lower-Timeframe (5M):
After proper mitigation occurs, we drop to 5M for precise confirmations. Look for price to hold the mitigated area and ensure internal courtyard liquidity is absorbed. This sets up for riding the furthest highs with smart money support.
Entry Zone: Pending proper mitigation of mid-timeframe order blocks.
Targets:
• Lower timeframe highs (5M)
• Mid-timeframe highs (30M)
• Extension to HTF highs, depending on market delivery
Mindset Note:
Smart money leads, we follow. No forcing trades—wait for full mitigation and lower timeframe confirmation before engaging. Patience and precision are the edge.

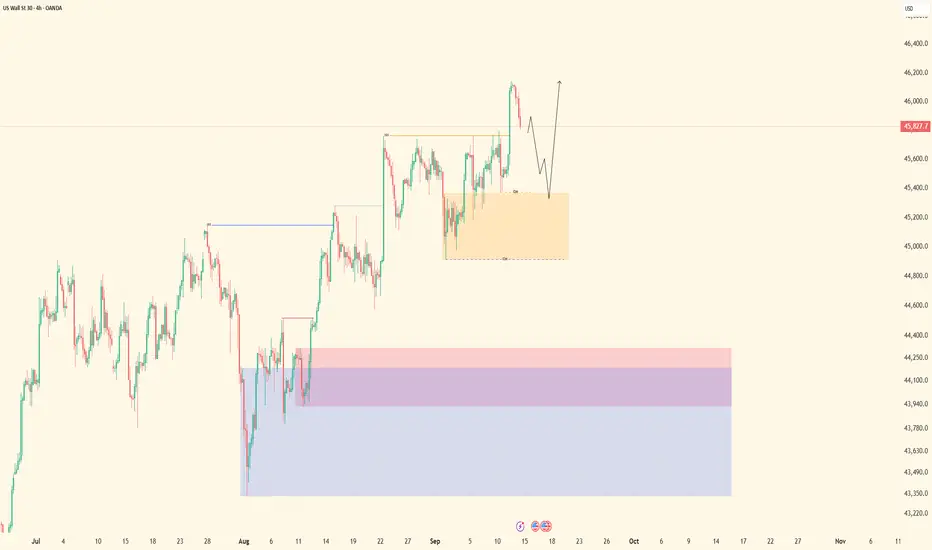
US30 - Bullish Continuation SetupBias: Bullish
High-Timeframe (4H/1H):
Price shows a strong bullish board structure with momentum firmly to the upside. Volume candles are clean and imprinted, signaling continuation potential and smart money control.
Mid-Timeframe (30M):
Dropped down to monitor board continuations. Structure has been mapped and refined—everything is aligned with HTF bullish intent. We are now waiting for proper sell-side liquidity to be taken. This is the “courtyard” where stops are absorbed before smart money resumes the upward move.
Lower-Timeframe (5M):
Once mitigation occurs and the order block is properly cleared, we will drop to 5M for precise entry confirmation. Price should hold the mitigated area, confirming smart money support before riding the continuation.
Entry Zone: Pending proper mitigation of the mid-timeframe order block.
Targets:
• Lower timeframe highs (5M)
• Mid-timeframe highs (30M)
Mindset Note:
Let smart money lead direction. No rushing entries—wait for the order block to be mitigated and price to confirm support before engaging. Patience and precision over impulse.
Gold (XAU/USD) - Bullish Continuation in PlayBias: Bullish
High-Timeframe (4H/1H):
Price is showing a strong bullish structure with momentum firmly to the upside. Volume candles indicate imprinted buying, suggesting continuation potential. Smart money is clearly in control of this leg.
Mid-Timeframe (30M):
We’ve spotted a sell-side liquidity sweep. Waiting for the deeper “slash through the courtyard” to properly mitigate the underlying order block. No entries yet—patience is key. This zone shows where smart money absorbs stops before resuming the bullish leg.
Lower-Timeframe (5M):
Once mitigation is complete, we drop to the 5M for precise confirmation. Look for price to hold the mitigated area, showing smart money support. Entry confirmation aligns with micro-structure flips and final inducements.
Entry Zone: Pending proper order block mitigation.
Targets:
• 5M highs for quick continuation trades
• 30M highs for extended bullish movement
Mindset Note:
Let smart money lead the way. No rushing entries—precision beats impulse. Wait for proper mitigation and confirmation before committing.

GBPJPY - Bullish Continuation in PlayBias: Bullish
High-Timeframe (4H): Structure shows strong bullish intent. Momentum and volume are clearly favoring the upside, indicating continuation potential. Price has respected key bullish order blocks and shows no signs of structural weakness.
Mid-Timeframe (30M): Aligning with HTF, the mid-timeframe continues the bullish flow. We are monitoring for proper mitigation of the underlying sell-side liquidity—this is the zone where smart money absorbs stops before pushing price higher. No entries yet; patience is key.
Lower-Timeframe (5M): Once the mid-timeframe OB is properly mitigated and sell-side liquidity is taken, we will drop to the 5M for precise entry confirmation. Look for micro structural flips (LH/HL) and inducement sweeps to align with the bullish HTF bias.
Entry Zone: Pending mitigation of the mid-timeframe order block.
Targets: HTF highs and extensions. Precise targets will be refined on lower-timeframe confirmation.
Mindset Note: Patience and alignment matter more than speed. Let smart money set direction—enter only with confirmed structure and clean liquidity absorption.

EUR/GBP - Bullish Structure in Full Effect
Pair: EUR/GBP
Bias: Bullish
HTF Overview (4H+):
• Strong bullish intent shown as structure keeps breaking to the upside.
• Momentum remains with buyers — clear directional bias is given.
MTF (30M–1H):
• Structure mapped and refined clean.
• Price is respecting order blocks with precision, confirming continuation flow.
• A mid-TF mitigation provided the base for alignment with HTF direction.
LTF Execution (5M):
• Dropped into the LTF after mitigation for confirmation.
• A clear CHoCH allowed us to attend longs in line with higher structure.
• Targets are staged: 5M highs → 30M highs → 4H highs, depending on delivery.
Mindset Note: The pair is respecting smart money levels beautifully. No rush — we wait for proper mitigations to enter clean, and let smart money lead the way.

EUR/JPY - Bullish Continuation FlowPair: EUR/JPY
Bias: Bullish
HTF Overview (4H+):
• Strong bullish intent and structure confirmed.
• Price launched aggressively, setting the tone for upside continuation.
• Mapping remains aligned with bullish structure — HTF run in progress.
MTF (30M–1H):
• Price mitigated a deeper, refined anchor order block.
• From that mitigation, a clean CHoCH confirmed continuation order flow.
• Mid-timeframe mapping points toward upside until the next highs are breached.
LTF Execution (5M):
• Each mitigation offered precise entry opportunities on the LTF.
• Currently riding longs through staged targets: 5M highs → 30M highs → 4H highs.
• Most recent LTF OB was mitigated and respected, giving another continuation entry.
Mindset Note: Positions are in motion. No adjustments needed until key highs are breached. Letting profits run with mapped structure — top-down alignment respected, smart money delivering.

NZD/JPY - Bearish Momentum Aligned with HTF SupplyPair: NZD/JPY
Bias: Bearish
HTF Overview (4H+):
• Price cleared buy-side liquidity into a higher-timeframe order block.
• Momentum shifted bearish as supply held, giving us downside intent.
MTF (30M–1H):
• From that supply zone, we waited for a shift in structure (CHoCH).
• Momentum aligned bearish, with price taking out previous buy-side liquidity.
• A refined OB above was mitigated, reinforcing continuation downside.
LTF Execution (5M):
• Dropping to the lower timeframes, we caught an initial shift in trend to align with the dominant bearish flow.
• Both HTF + MTF + LTF now in sync → direction is confirmed.
• Next focus: wait for a clean buy-side liquidity sweep + OB mitigation to attend the next sell entries.
• Targets staged: 5M lows → 30M lows, depending on delivery.
Mindset Note: The flow is clear — bearish momentum is in control. No forcing; let price sweep liquidity, mitigate, and then ride with smart money direction.

GBP/USD - Smart Money Longs in MotionPair: GBP/USD
Bias: Bullish
HTF Overview (4H):
• Structure and intent remain bullish on the 4H.
• A clean sell-side liquidity sweep set the stage.
• Deep mitigation into the 4H order block confirmed upside flow.
MTF (30M–1H):
• Attending bullish continuation after a refined mid-TF order block mitigation.
• Liquidity sweep at the lows reinforced the setup.
• Momentum points toward upside delivery; waiting for a mid-TF high to be breached for full confirmation.
LTF Execution (5M):
• Dropped into the 5M for continuation entries after the mid-TF mitigation.
• Monitoring live price delivery as we chase staged targets: 5M highs → 30M highs, depending on market delivery.
Mindset Note: Direction is clear — smart money is leading. Longs are in play, patience and monitoring are key until mid-TF highs give way.

USD/JPY - Riding Bullish ContinuationPair: USD/JPY
Bias: Bullish
HTF Overview (4H):
• Structure remains bullish with intent confirmed on the 4H.
• Mapping is consistent with previous weeks → we are still within a continuation phase.
• Flow points toward higher delivery into the 4H highs.
MTF (30M–1H):
• Attending mid-timeframe longs in alignment with higher timeframe structure.
• Price action continues to respect the mapped structure to its finest.
LTF Execution (5M):
• Lower timeframes have already given clean mitigations.
• We’re currently riding with price, monitoring its delivery.
• Targets are staged: 5M highs → 30M highs → 4H highs depending on order flow.
Mindset Note: This is a continuation play — stay disciplined, no forcing. Just trail along with delivery and let the market do the heavy lifting.

EUR/USD - Bullish Continuation SetupPair: EUR/USD
Bias: Bullish
HTF Overview (4H):
• Price showed bullish intent after a sell-side liquidity sweep.
• A refined bullish order block was mitigated.
• Structure remains aligned with previous weeks’ mapping → price is rolling within the mid-4H range flow toward the highs.
MTF (30M–1H):
• Clear bullish continuation order flow spotted.
• We are now waiting for a deeper order block mitigation for refined entry.
LTF Execution (5M):
• Once the deeper OB mitigation is clean, we’ll drop to 5M for precise entries.
• Targets = 5M highs first, then 30M highs depending on market delivery.
Mindset Note: Patience is key here — no chasing. Let price deliver the deeper mitigation before attending the move.

ROSE / USDT : Bullish rally ahead after successful retestROSE/USDT has broken out of trendline resistance and is now heading for a retest of the breakout zone. If this retest holds successfully, price could rally toward $0.045.
📌 Always wait for clear confirmation of a bullish move before entering. Manage risk wisely.

Institutional Demand: EUR/AUD longsHey,
This chart is looking good for a pullback play, the zone is broken but the 4-hour closed within our extended zone criteria, which makes the trade valid and the breakout fake.
Let's see how this plays out!
Kind regards,
Max Nieveld
@ mnieveld dm for questions.

12.09.25 Morning ForecastPairs on Watch -
FX:EURUSD
FX:USDCAD
FX:NZDUSD
A short overview of the instruments I am looking at for today, multi-timeframe analysis down to what I will be looking at for an entry. Enjoy!

11.09.25 Morning ForecastPairs on Watch -
FX:NZDUSD
FX:NZDCAD
A short overview of the instruments I am looking at for today, multi-timeframe analysis down to what I will be looking at for an entry. Enjoy!

Two EURCAD Positions Trade Recap 10.09.25Two positions covered in this recap.
EUR / CAD -1%
EUR / CAD Re-Entry BE
Full explanation as to why I executed on these positions and how I maintained my mindset to allow me to get back into the second position after taking the loss. Something I have been working on the past month or so is maintaining the executional mindset after being taken out of a trade, and if it is still intact to actually get back in to the market.
Any questions you have just drop them below 👇

10.09.25 Morning ForecastPairs on Watch -
FX:EURUSD
FX:EURJPY
FX:EURCAD
A short overview of the instruments I am looking at for today, multi-timeframe analysis down to what I will be looking at for an entry. Enjoy!

09.09.25 Morning ForecastPairs on Watch -
FX:EURUSD
FX:EURCAD
FX:NZDCAD
FX:NZDUSD
A short overview of the instruments I am looking at for today, multi-timeframe analysis down to what I will be looking at for an entry. Enjoy!

08.09.25 Morning ForecastPairs on Watch -
FX:EURUSD
FX:GBPUSD
FX:EURCAD
FX:AUDJPY
A short overview of the instruments I am looking at for today, multi-timeframe analysis down to what I will be looking at for an entry. Enjoy!
