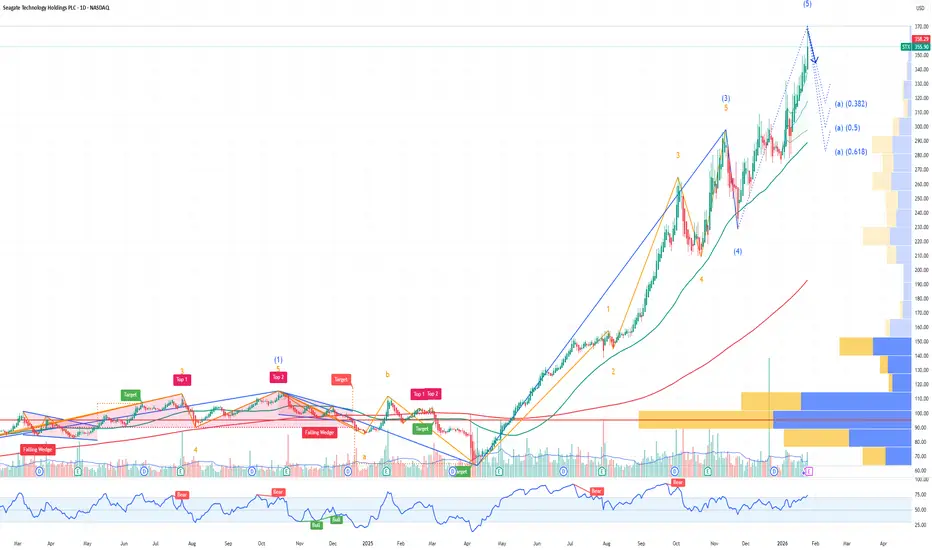
STX Seagate Technology Holdings Options Ahead of EarningsAnalyzing the options chain and the chart patterns of STX Seagate Technology Holdings prior to the earnings report this week,
I would consider purchasing the 357.50usd strike price Puts with
an expiration date of 2026-1-30,
for a premium of approximately $17.90.
If these options prove to be profitable prior to the earnings release, I would sell at least half of them.
STX
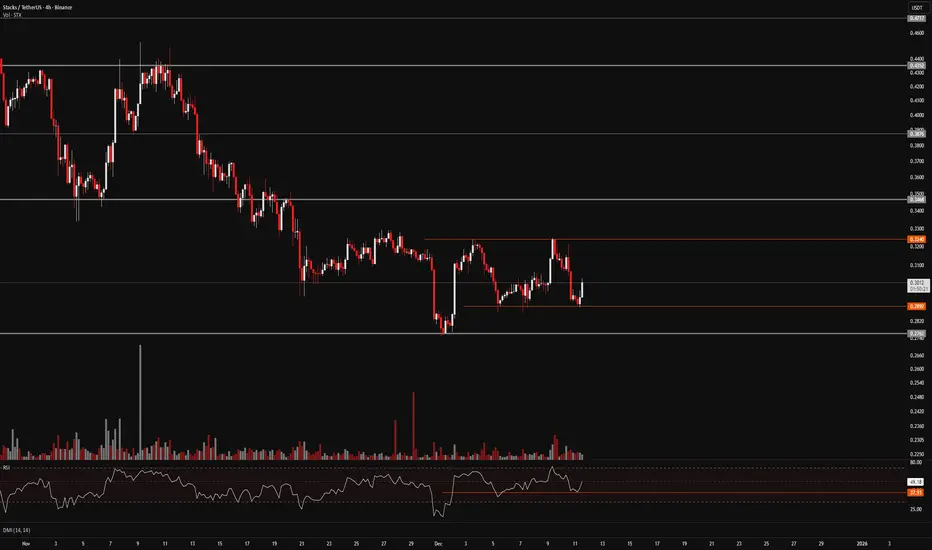
STX/USDT – Bearish Trend Under Pressure: Breakout or Rejection?STX/USDT on the 3D timeframe remains in a medium–to–long-term bearish structure. Price continues to move consistently below the primary descending trendline, which has capped every bullish attempt since the previous peak. Although a rebound has occurred from the recent low, the current move is still classified as a pullback within a downtrend, not a confirmed trend reversal.
---
Pattern & Price Structure
1. Descending Trendline (Primary Bearish Structure)
The descending trendline is formed by a clean series of lower highs.
Every rally has been rejected at the trendline, confirming that seller control remains dominant.
As long as price fails to break and close decisively above the trendline, the overall bias remains bearish.
2. Bearish Continuation Structure
Price continues to print lower highs and lower lows, maintaining the bearish market structure.
The latest rebound appears to be a dead cat bounce / relief rally after an extended decline.
---
Key Levels
Resistance Zones
0.4550 USDT → key resistance & recent reaction zone (aligned with the trendline).
0.6100 USDT → major resistance, valid only if a confirmed trendline breakout occurs.
0.8750 – 0.9850 USDT → strong supply zone and previous distribution area.
Support Zones
0.3790 USDT → current minor support.
0.2900 USDT → intermediate support.
0.1995 USDT → major low / critical support (cycle low).
---
Bullish Scenario
A bullish scenario is technically valid ONLY if the following conditions are met:
1. Price breaks and closes strongly above the descending trendline.
2. A Daily/3D close above 0.4550 USDT with increasing volume.
3. Successful retest of the trendline as new support.
📈 Bullish Targets (Step-by-Step):
0.6100 USDT
0.8750 USDT
0.9850 USDT
Without a confirmed trendline breakout, any upside move should be considered a temporary pullback.
---
Bearish Scenario
The bearish scenario remains the dominant bias as long as:
Price gets rejected at the 0.4550 USDT / trendline area.
Bearish rejection candles or continuation patterns appear.
📉 Bearish Targets:
0.3790 USDT (initial support)
0.2900 USDT
0.1995 USDT (major low & potential breakdown zone)
A breakdown below 0.1995 could trigger a new bearish expansion phase.
---
Conclusion
Primary trend: BEARISH
Market structure has not yet confirmed a valid reversal.
The current rebound remains a counter-trend move.
Bullish confirmation only occurs after a trendline breakout + key resistance reclaim.
Strong risk management is essential due to high volatility near cycle lows.
#STX #STXUSDT #Stacks #CryptoAnalysis #TechnicalAnalysis #BearishTrend #Downtrend #SupportResistance #Trendline #AltcoinAnalysis

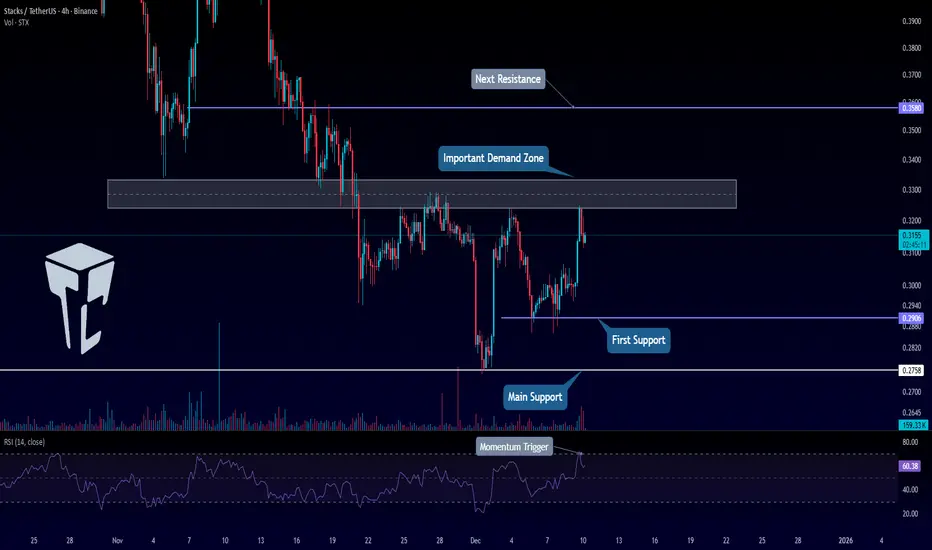
STX Sharp Rebound: Demand Zones Ahead (4H)STX has recently experienced a very sharp and notable upward movement, showing strong bullish momentum. However, for those looking to re-enter the market, it is important to wait for a minor price-time correction. This correction would allow for a healthier entry and reduce the risk of chasing the current momentum.
Following the main CH (Consolidation/Channel), the market reacted sharply to the upside, reclaiming several key areas that had previously acted as supply zones. These reclaimed areas have now turned into demand zones, which makes them important levels to watch for potential re-entry opportunities during pullbacks. Traders can look for swing trades by buying at these demand zones when the price returns to test them.
We have identified two primary entry points for potential purchases. To manage risk effectively, it is recommended to use Dollar-Cost Averaging (DCA) when entering these positions, rather than committing the full amount at a single level. This approach reduces exposure to sudden price reversals and helps optimize the average entry price.
Profit targets have been clearly marked on the chart. Traders should consider taking partial profits at the first target and moving their stop loss to break-even to protect capital. For those with a more conservative risk profile, it is also entirely reasonable to close the full position at the first target, locking in profits without waiting for higher levels.
It is important to note that this outlook will be invalidated if a 4-hour candle closes below the defined invalidation level. Such a move would signal a potential shift in market sentiment and should prompt traders to reconsider their positions.
Overall, this setup presents a structured approach to swing trading, combining technical levels with risk management strategies. By carefully monitoring the demand zones, pullbacks, and targets, traders can participate in potential upward moves while maintaining a disciplined and risk-aware strategy.
If you have a coin or altcoin you want analyzed, first hit the like button and then comment its name so I can review it for you.
This is not a trade setup, as it has no precise stop-loss, stop, or target. I do not publish my trade setups here.

STXUSDT UPDATE#STX
UPDATE
STX Technical Setup
Pattern: Falling Wedge Pattern
Current Price: 0.3637$
Target Price: 0.4550$
Target % Gain: 170.70%
Technical Analysis: STX is breaking out of a falling wedge pattern on the 1D chart, signaling a strong bullish reversal setup. Price has decisively broken above the descending resistance trendline with strong bullish momentum, confirming the breakout. The measured move from the wedge projects an upside target near 0.4550$, which aligns with previous resistance and offers significant upside potential if price holds above the breakout zone.
Time Frame: 1D
Risk Management Tip: Always use proper risk management.

STX - Move BeginsFrom April to November 2025, Seagate Technology completed an upward move, forming a five-wave structure.
The first and fifth waves are roughly equal in size.
Since November, Seagate completed a corrective phase with waves A and B already formed.
Wave C is now underway — an impulsive, strong downward move is expected.
Targets:
264 -> 234 -> 209
---
Please subscribe and leave a comment.
You’ll get new information faster than anyone else.
---

FireHoseReel | STX Breakout Loading at Key Levels🔥 Welcome To FireHoseReel !
Let’s jump into Stacks (STX) market analysis.
🪙 Stacks (rank #88) powers Bitcoin smart contracts, letting users build DeFi, NFTs, and apps on BTC with security anchored to the Bitcoin chain.
👀 STX 4H Overview
STX is in a clear downtrend on the monthly, weekly, and daily charts. On the 4H timeframe, it has formed a small consolidation zone. A breakout in either direction can create a tradable setup from this consolidation.
📊 Volume Analysis
Stacks is currently showing significant volume decline, and the last volume spike leaned toward selling pressure. A breakout through the orange pre-breakout zones could trigger a notable increase in volume.
✍️ STX Trading Scenarios
🟢 Long Scenario:
A breakout above $0.324 with rising buy volume creates a pre-breakout setup targeting the $0.346 resistance—suitable for a risky long entry.
🔴 Short Scenario:
Losing the $0.2899 support with increasing sell volume—especially if RSI dips into oversold—could act as a pre-breakout signal for a deeper move toward $0.2762.
🧠 Protect your capital first. No setup is worth blowing your account. If risk isn’t controlled, profit means nothing. Trade with rules, not emotions.
TradeCityPro | STX Facing Key Resistance, Bears in Control👋 Welcome to TradeCity Pro!
In this analysis, I want to review STX, one of the Bitcoin ecosystem projects, currently ranked 87th on CoinMarketCap with a $573 million market cap.
⏳ 4-Hour Timeframe
As you can see, on the 4-hour timeframe, STX is dealing with a resistance zone that it has touched several times before, and now it has reached this zone again.
✔️ After reaching this level, the volume of the red candles rejecting from this zone has been increasing, which shows the weakness of buyers and the strength of sellers at this level.
📊 If selling volume continues to increase, there is a possibility of price moving towards the support zones of 0.2906 and 0.2758.
💡 So, we can open a short position either after breaking the structure in lower timeframes or by breaking these zones 0.2906 and 0.2758.
💥 For a long position, breaking the range will be the first long trigger and the first confirmation for the coin turning bullish.
🎲 The next important resistance zones are 0.3580 and 0.4359, and breaking these levels will give us the main confirmations for a bullish trend.
🎯 On the other hand, if RSI enters the overbought zone, we can confirm the entry of bullish momentum into the market, increasing the likelihood of breaking the resistance zone.
📝 Final Thoughts
Stay calm, trade wisely, and let's capture the market's best opportunities!
This analysis reflects our opinions and is not financial advice.
Share your thoughts in the comments, and don’t forget to share this analysis with your friends! ❤️
Seagate's AI Advantage: Powering the Exabyte EconomySeagate Technologies (NASDAQ: STX) exhibits powerful technical and fundamental momentum. Its stock has doubled over the last year, driven by its unique positioning in the surging Artificial Intelligence (AI) infrastructure buildout. Seagate can deliver AI-capable hard drives (HDDs) at scale for the data center industry like no other competitor. The company's future success depends on its massive capacity storage solutions, which are critical for training AI models and inference processes. This robust outlook propels strong support from major institutional investors and a bullish analyst consensus.
Technology, High-Tech, and Patent Analysis
Seagate's competitive edge rests on its Heat-Assisted Magnetic Recording (HAMR) technology. This innovation, branded as the Mozaic 3+ platform , dramatically increases areal density, enabling massive capacity gains and superior cost-per-terabyte efficiency compared to older technologies.
Seagate's foresight places it ahead of its primary competitor, Western Digital, in this generational technology transition . The company's patent strength in this domain ensures a sustained technological advantage, crucial as high-density HDDs remain the cost-effective backbone for the majority of exabyte-scale AI data storage.
Industry Trends and Business Models
The AI boom fundamentally reshapes the data storage industry. AI models require enormous, cost-effective storage for training datasets, making high-capacity HDDs indispensable. Seagate's business model focuses intensely on mass-capacity, nearline drives for hyperscale cloud providers (Amazon, Microsoft, Alphabet, etc.) and AI innovators like NVIDIA and OpenAI. Build-to-order (BTO) contracts with these major customers secure revenue streams and provide demand visibility well into 2026, mitigating cyclical risks previously inherent in the storage market.
Management & Leadership in Strategic Growth
Management demonstrates effective strategic pivoting, focusing on value capture and improved operational leverage. The successful and rapid commercialization of the Mozaic 3+ HAMR drives confirms strong execution in the product roadmap. Leadership forecasts management-defined gross margins to increase to nearly 40% in 2026. These margin improvements, driven by the higher profitability of next-generation drives, highlight a commitment to disciplined growth and improved operational efficiency.
Macroeconomics and Balance Sheet Inflection
The global macroeconomic environment for data center expansion remains robust, fueled by the multi-trillion-dollar AI Supercycle. This secular tailwind significantly boosts demand for Seagate's mass-capacity products. Seagate's balance sheet quality is improving after past challenges with debt and losses. Strong cash flow, driven by surging AI demand, enables debt reduction and improved financial health. This pivot is expected to increase shareholder value by improving financial flexibility and supporting future dividend increases.
Corporate Culture, Innovation, and Shareholder Value
The company culture prioritizes innovation through long-term investment in core storage science, evidenced by the 20-year development of HAMR. Beyond stock appreciation, the company's *b]$2.96 annualized dividend acts as a catalyst for long-term shareholders. Seagate currently pays less than 35% of its earnings, providing ample room to increase the distribution pace, offering both growth and income potential as earnings surge.
Market Sentiment and Institutional Support
Market sentiment strongly favors the stock, marked by a Moderate Buy consensus from a growing number of analysts. Key technical indicators, including high trading volume and MACD convergence , signal strengthening market momentum. Furthermore, institutions own over 90% of the stock and have been consistent net buyers throughout 2025. This institutional support provides a rock-solid base and sets the stage for a potential year-end rally to new all-time highs.
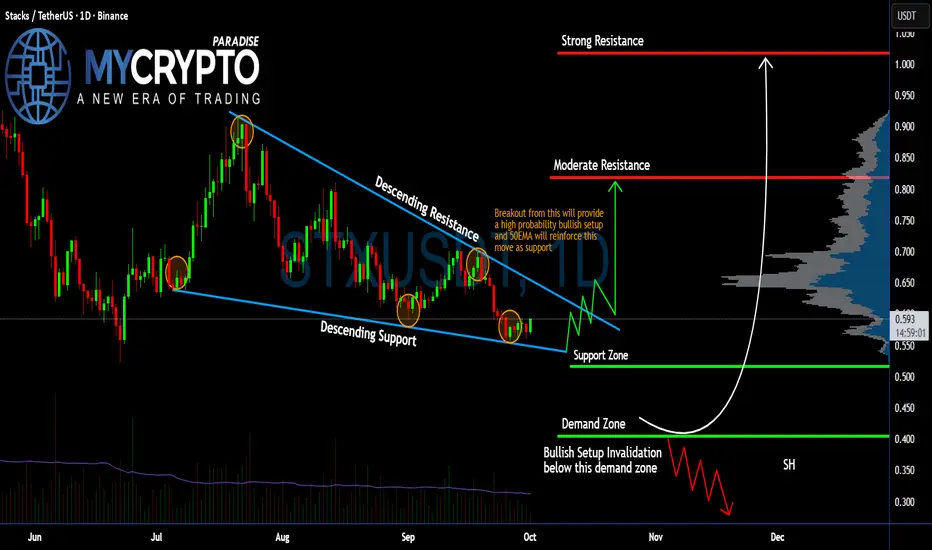
Is #STX Ready to Make an Explosive Bullish Move? Must Watch Yello Paradisers! Are we about to witness a powerful breakout of #STX, or is a trap lurking right under our feet? Let's decode this #STXUSDT setup before it’s too late:
💎#Stacks has been stuck in a clear falling wedge on the daily timeframe by consistently respecting both the descending resistance and descending support lines since late July. Price action is now compressing near the lower end of this structure, showing signs of potential accumulation.
💎Right now, #STXUSD is trading around $0.59, sitting just above the support zone at $0.51, and not far above the final demand zone at $0.40. This area is crucial. As long as bulls defend this zone, the structure remains intact and the bullish scenario is valid.
💎A confirmed breakout above the descending resistance, ideally with a retest of that line alongside support from the 50EMA, would flip this into a high-probability bullish setup. If that happens, we’ll first be targeting the moderate resistance at $0.818. A sustained move above $0.818 opens the door toward the strong resistance at $1.018. That’s your upside target, but only if we break the descending channel cleanly.
💎However, a break below $0.40 would invalidate this entire bullish structure. If this demand zone fails, the setup is broken, and the market could go on to sweep the lower liquidity zones, likely toward $0.30 and below. That’s where over-leveraged bulls will get wiped out.
Strive for consistency, wait for clear confirmations, and remember that discipline always beats chasing quick profits.
MyCryptoParadise
iFeel the success🌴
$STX Tradespoon - Long Entry $219.85Tradespoon model generated long signal for $STX. Predicted range: $219.85-$228.53. Trend: +1.82%.

STX/USDT — Key Support Test, Break or Bounce?Stacks (STX/USDT) is currently sitting at a critical make-or-break zone that will define its medium- to long-term direction. On the weekly chart, price has returned to the historical demand zone at $0.42 – $0.58 (yellow box). This area has acted as a strong accumulation level multiple times before — notably during the 2022–2023 bottom before the explosive rally above $3.
---
🔎 Structure & Pattern
1. Historical Demand Zone ($0.42–$0.58)
This zone is the last stronghold for bulls before the market risks sliding back towards the historical low at $0.1987.
As long as price holds and forms a reversal pattern here (bullish engulfing, hammer, etc.), it can trigger another wave of accumulation.
2. Lower Highs Since 2024
After peaking above $3, STX has continued to print lower highs, showing that sellers still dominate.
However, a retest of this deep demand zone also sets the stage for a potential large-scale bottoming.
3. Multi-Year Range
STX has been moving within a broad $0.20 – $3.60 range since 2021.
Price is now at the bottom edge of this range, meaning downside risk is relatively limited compared to the upside potential if a rebound occurs.
---
🚀 Bullish Scenario
Early Confirmation: A weekly close back above $0.80 – $1.00.
Upside Targets:
First resistance: $1.0089
Next levels: $1.3112 → $1.7040 → $2.7367 → $3.6291
From entries in the $0.58–0.45 zone, the reward-to-risk (R:R) potential is >3:1, making this area a high-value accumulation zone.
---
⚠️ Bearish Scenario
Breakdown Confirmation: A weekly close below $0.42.
Downside Targets:
First: $0.28 (minor support)
Next: $0.1987 (historical low)
A failure here would signal renewed long-term bearish pressure and a potential return to the cycle’s bottom range.
---
🎯 Conclusion
STX is currently at a golden accumulation zone that historically has provided strong upside reactions.
Aggressive traders may look for entries at $0.58–0.45 with stops below $0.42.
Conservative traders should wait for a weekly close above $0.80–1.00 for confirmation of bullish momentum.
This is a decisive zone: hold = high rebound potential, break = risk of retesting $0.20.
---
#STX #STXUSDT #Stacks #Crypto #TechnicalAnalysis #CryptoTrading #Altcoins #PriceAction #SupportResistance #Accumulation

STX (SPOT)BINANCE:STXUSDT
#STX / USDT
Entry range (0.650- 0.670)
SL 4H close below 0.630
T1 0.760
T2 0.840
T3 1.000
2 Extra Targets is optional 1.300 and 1.600
_______________________________________________________
Golden Advices.
********************
* collect the coin slowly in the entry range.
* Please calculate your losses before the entry.
* Do not enter any trade you find it not suitable for you.
* No FOMO - No Rush , it is a long journey.

STACKS is approaching a breakout momentSTX is consolidating nicely within a triangular formation as volume decreases; eventually, the price is expected to squeeze. The question is, in which direction? The fact is, such a structure has a high chance of continuation, but a swing failure could cause the price to shift up. DCA moment. NFA
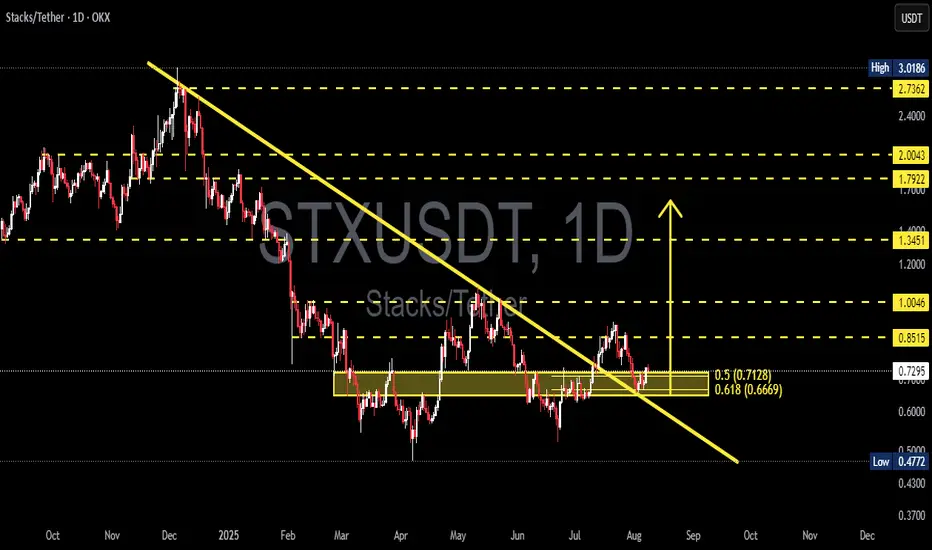
Breakout Confirmed – Is STX/USDT Ready for a Trend Reversal?Technical Analysis – STX/USDT (Daily Timeframe)
STX/USDT has shown a significant technical breakout after successfully breaching the descending trendline that has acted as a dynamic resistance since early 2025.
Currently, price is retesting a key support zone, which was a former resistance level—indicating a possible flip to demand and validation of the breakout.
---
🔹 Key Zone:
Demand zone (yellow box): 0.6669 – 0.7128
(based on Fibonacci retracement levels 0.618 and 0.5)
Current price: 0.7313
---
📈 Bullish Scenario:
Breakout from the descending trendline suggests a potential trend reversal.
As long as price holds above the 0.6669 – 0.7128 zone, upward continuation is likely.
Potential resistance targets:
0.8515
1.0046
1.3451
Extended target: 1.7922, if bullish momentum continues
---
📉 Bearish Scenario:
If price fails to hold the Fibonacci support zone, a deeper correction could follow.
Downside support levels to watch:
0.60 (psychological support)
0.4772 (2025 low)
---
📊 Pattern & Market Structure:
The trendline breakout is the first sign of a structural shift.
A successful retest and formation of a higher low could confirm a new bullish market structure.
The Fibonacci confluence zone aligns with price action support, making it a key decision area.
---
Conclusion:
STX/USDT is showing signs of recovery and a potential reversal after a prolonged downtrend. The breakout is promising, but confirmation will come if the price holds the key support zone. Traders should closely monitor the 0.6669 – 0.7128 region to gauge future price direction.
#STX #STXUSDT #CryptoBreakout #TrendReversal #FibonacciLevels #TechnicalAnalysis #Altcoins #CryptoTA #SupportResistance #PriceAction
Stacks · Major Flush Reveals End of Correction · New CycleStacks all-time high was hit April 2024. This ATH comes as a long-term double-top because it happened within the same November 2021 peak price range.
After a major wave there is always a correction. A correction can happen in any direction. If the trend is bearish, the correction is an up-move. If the trend is bullish, the correction is a down-move. Very simple.
The 2021 all-time high is the natural end of a major bullish cycle and thus a correction follows. The correction lasted from November 2021 until November 2022. Naturally, a major market bottom signals the start of a change of trend.
Here STXUSDT produced a bullish cycle from November 2022 until April 2024, 504 days. In April 2024 we have a new major high and this signals the start of a bearish wave. The bearish wave went from April 2024 through April 2025. The end of the down-move would signal the start of a new bullish cycle but, how do we know the down-move is over? Answer: A major market flush.
On the 12-May week there was a major market flush with a session reaching lower than the 7-April low. This is the bottom signal. It reveals itself as a bottom signal because instead of a new lower low close the week recovered and closed very high. After a higher low in June compared to April we now have four green weeks and we know what the rest of the market is doing so we can predict easily a bullish continuation; a price increase.
The size of the drop between April 2024 and May 2025 reached -92.49%. That's a huge drop. Almost all the gains from the previous 504 days bullish cycle was erased. The market has no reason nor need to move lower, for what? There is no need to dig for anything down there and that's the signal that reveals the bottom is in. Because the correction was so strong, we can expect a change of trend. We are aiming up.
Stacks major market flus in May 2025 reveals the correction is over. With the end of a strong bearish cycle confirmed, we can now expect a strong bullish cycle to develop next. If we go by past history, we can see sustained growth, it can happen for years or in the least many months.
How long will the bullish cycle last?
I don't know.
From March 2020 to November 2021 we have 630 days. The other cycle I just mentioned lasted 504 days. We can use these numbers to make some predictions but it is hard to say because market conditions are not the same.
504 days from May's low into the future gives us a date of September 2026. 630 days puts us at February 2027.
If we go by the law of alternation, we had a long cycle in 2020/2021 so this time we get a short one, say 38% or half the past bull market, this would give us 239 and 315 days. These two will give us dates between January and March 2026 for a new all-time high or cycle top.
Now, I cannot predict how long the bull market will last but I can predict that prices are going up. Since we know we will have a major rise lasting at least 6 months, the next logical step is to buy and hold. When Stacks starts trading 1,000% up, you won't care how the long bull market will last, you will just be very happy and grateful with the results.
The easy target is $6.19, but if we get an extended bull market we can go to $9.83 or even $13, or higher. It all depends on how it all develops, but we are going up. We are talking profits between 600% and 1,400% coming from current prices.
Thanks a lot for your continued support.
Namaste.

$STX Stacks Bullish Continuation? 70% retracement from ATHNASDAQ:STX (Stacks) – Bigger Picture: Uptrend/Bullish Continuation
3-Day Timeframe
Current Price: $1.00
NASDAQ:STX has retraced over 70% from its all-time high of $3.80, indicating a deep correction phase that may now be reaching exhaustion.
If the price breaks out of this falling channel, which is often a bullish reversal signal. This breakout, if sustained, could set the stage for a move toward previous all-time highs and beyond.
🚀 Bullish Targets (TP):
$2.60 – Previous resistance level
$3.70 – Near the all-time high
$5.20 – Extended target on strong momentum
Invalidation Level:
The bullish thesis is invalidated if price falls below $0.80, signaling potential continuation of the downtrend.
#STX #Stacks #Crypto #Altcoins #Breakout #BullishSetup #CryptoTrading
@Stacks

STX/USDT Weekly Outlook Golden Accumulation Zone
📌 Overview:
STX (Stacks) is currently retesting a crucial demand zone in the $0.63 – $0.72 range — the same area that previously served as the launchpad for a massive rally toward the $3.80 highs. This chart highlights a strategic opportunity for swing traders and long-term investors who understand market cycles.
🧠 Price Structure Insight:
A well-established demand zone (highlighted in yellow) has acted as a base of accumulation since late 2022 through mid-2023.
Price is now consolidating above this zone, suggesting a potential bullish reversal.
A potential Double Bottom pattern is forming, with a neckline around the $1.00 level — a breakout above this could spark a significant bullish impulse.
🟢 Bullish Scenario (Upside Potential):
If STX maintains support and bounces from this accumulation zone, we could see a stair-step rally toward the following targets:
1. $0.90 – $1.00 → Psychological resistance & neckline of reversal pattern
2. $1.2975 → Historical supply and consolidation area
3. $1.9447 → Previous lower-high resistance zone
4. $2.20 – $2.71 → Key Fibonacci retracement levels from prior highs
5. $3.66 – $3.84 → All-Time High resistance, long-term bull target
🔍 A confirmed weekly close above $1.00 would significantly strengthen the bullish thesis and validate the reversal structure.
🔴 Bearish Scenario (Downside Risk):
If price breaks down below $0.6380, this could invalidate the current structure and lead to deeper corrections, targeting:
$0.45 → Minor support from early 2023
$0.20 → Historical macro bottom and extreme support
❗ A breakdown below this accumulation zone could trigger a longer-term bearish continuation.
🔄 Strategic Trading Notes:
This is a high-probability reversal zone, ideal for gradual accumulation (DCA) or swing entries with tight stop losses below support.
Watch for a spike in volume as a signal for institutional or smart money involvement.
Confirmation from bullish candlesticks (e.g., bullish engulfing on weekly) could provide additional entry confidence.
📚 Conclusion:
STX is testing a key structural level that previously led to exponential price growth. As long as the $0.63–$0.72 zone holds, the mid-to-long-term bias remains bullish. However, traders should remain disciplined and responsive to any invalidation signals.
#STXUSDT #Stacks #CryptoAnalysis #AltcoinSetup #TechnicalBreakout #WeeklyChart #BullishReversal #AccumulationZone #SmartMoney

Stacks Short- Mid- & Long-Term Bullish Signals (PP: 900%+)Stacks is a very interesting project and I believe it has many fans. Here the signals are really good and by good I mean strong.
This pair, STXUSDT, has been a top performer but the action bearish since March 2024.
Between March 2024 and April 2025 we have a classic ABC correction, a long-term one. Needless to say, this type of correction is always followed by an impulse, a bullish impulse and this is a sequence of 1,2,3,4,5 waves. Three waves up and two waves down in-between.
The August 2023 low produces a rounded bottom and then a new wave of growth. This low is preceded by another bullish wave. This pair has been growing long-term.
Then a new rounded bottom shows up but this one a long-term higher low compared to August 2023. That is April and June 2025. So mixed bullish signal. Short-term, mid-term and long-term all being combined to give us a bullish mix. Ultra-bullish in short.
The last all-time high happened around $3.84, so the next one can happen around $7.11 or $9.65. The $7.11 projection gives more than 900% profits potential.
Oh, and this week is young and already full green. The candle's real body trades above the two previous weeks open and close.
Thank you for reading.
Your support is appreciated.
Namaste.

STXUSDT 1W Analysis STX ~ 1W Analysis
#STX Buy back gradually from here with a short-term target of at least 20%++.

TradeCityPro | STX: Watching Triangle Breakout and RSI Reaction👋 Welcome to TradeCity Pro!
In this analysis, I’m going to review the STX coin, which belongs to the Stacks project—a Layer 2 solution for Bitcoin.
🔍 STX, with a market cap of $1.45 billion, is currently ranked 59 on CoinMarketCap.
🔄 In the previous analysis, I drew an expanding triangle and mentioned that if this triangle breaks to the upside, we can enter a long position or even make a spot purchase.
✨ The trigger for the triangle breakout was at the 0.731 level. After breaking out and pulling back to this level, the price moved up to 1.049 and is now once again in a consolidation phase.
📅 Daily Timeframe
Currently, after RSI got rejected from the 73.58 zone and exited the overbought area, the price has undergone some correction. A pullback to the 0.871 level is possible.
🧩 If a pullback or deeper correction occurs, as long as RSI remains above 50, I still consider the market momentum to be bullish and believe the price can continue moving upward.
📈 If we see a solid bullish candle confirming continuation, we can enter a long position. However, the main long trigger is the breakout of 1.049. The RSI trigger for sharper moves would also be a breakout above 73.58.
📊 The next resistance level is at 1.332. If this level breaks, the coin enters a new price zone, and we’ll need to see whether it can establish support above that area.
🔽 For a bearish scenario, we should wait for the market to form a structure and provide a valid trigger to confirm a short position. At the moment, it’s better to wait for that setup.
🔑 If the market turns bearish, the key support zones to watch are 0.731, 0.571, and 0.453, which could potentially halt further decline.
📝 Final Thoughts
This analysis reflects our opinions and is not financial advice.
Share your thoughts in the comments, and don’t forget to share this analysis with your friends! ❤️

STX ANALYSIS (2D)The STX pair has reached a demand zone.
A price movement fractal seems to be repeating (highlighted by the orange and white boxes).
In the orange boxes, every time STX has dropped more than 72%, it has made a rebound move to the upside.
We are looking for buy/long positions around the demand zone.
The targets for STX are $0.93 - $1.10 - $1.30.
A daily candle close below the invalidation level will invalidate this analysis.
For risk management, please don't forget stop loss and capital management
When we reach the first target, save some profit and then change the stop to entry
Comment if you have any questions
Thank You

STX entry 1.8 to 2.06 through 4.Stacks ($STX) is a layer 2 (or as described by Stacks as a Layer 1.5) smart contract protocol that lives on the Bitcoin blockchain. Via Stacks DeFI and other utility/protocols including City Coins (currently being minted by New York City and Miami and soon Austin and others), while other DeFi platforms built for Bitcoin live on other layer 1's (i.e. Badger on Ethereum), a smart contract protocol on top of the most secure blockchain may or should not only assist in avoiding a "flippenning" but is critical at a time where multi/cross/para chains are the current solutions to avoid bouncing protocol to protocol.
Additionally Stacks was both the first cryptocurrency to be acknowledged by the SEC as a security and also to be no longer recognized as a security by the SEC after successful adoptions. DYOR, Grayscale and partners have significant involvement in Stacks and was instrumental in the SEC approvals. This is pure gut but my gut says Grayscale will be the first BTC ETF approved by the SEC due to familiarity, etc.
Fractals show a similar pattern having already taken place, expect a full push or a pullback and then push to and through $4. Naturally as tied to Bitcoin, BTC volatility could slow or speed up the growth of STX, but smart contracts on the Bitcoin blockchain is powerful and not discussed nearly as much as one would expect.
The stacking opportunities and ecosystem being built around Stacks i.e. City Coins (read NY and Miami Mayoral comments on plans) make this a long term hold for those who want, as blockchain continues to proliferate real world applications beyond just crypto.

The Views on STX#STX had a strong rise from Nov2022 to Mar2024, but both that rise and the current decline from that top appear corrective.
This unclear structure leaves multiple possibilities in play, 3 ideas are outlined below.
Maintaining $0.566 keeps the bullish ideas active.
#Stacks
