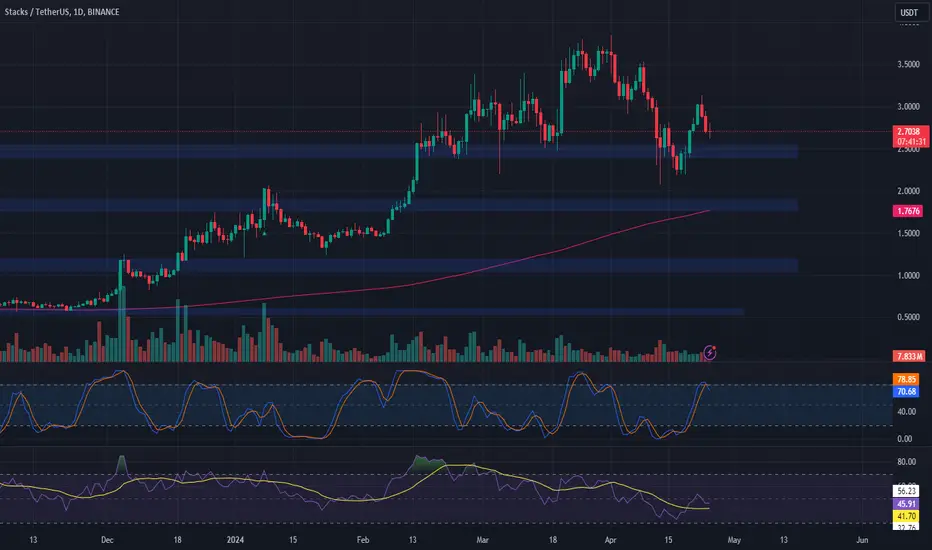
STXUSDT.P — 14.05.2026 Phase 2 Trade Setup
Price spent an extended period consolidating within the 0.25–0.27 range before breaking out and pushing to the 0.29 resistance zone. It has since pulled back and found support at the 0.25 level — a zone that held as strong demand.
📊 Current Situation:
Price is now sitting directly on top of the EM
STXUSDT Forming Falling WedgeSTXUSDT is forming a clear falling wedge pattern, a classic bullish wave signal that often indicates an upcoming breakout. The price has been consolidating within a narrowing range, suggesting that selling pressure is weakening while buyers are beginning to regain control. With consistent volume con
Stacks (STX) · Bullish Breakout with Great Entry (Spot vs Lev)This is a great chart and situation in so many ways... It is hard to find this kind of chart setup and timing. It only happens every few years. The last time STXUSDT (Stacks) looked like this, it was November 2022 and December 2022. A long time ago and the previous bear market bottom.
Very interest
#STX Ready For a Short Term Recovery | Bears Might Retreat NowYello, Paradisers! Is #STX about to explode from this tightening structure, or is the market preparing another brutal shakeout before the real move begins? Let's view #Stacks setup:
💎#STXUSDT is currently trading inside the falling wedge. This structure reflects a controlled bearish phase, but also
STXUSDT Forming Falling WedgeSTXUSDT is forming a clear falling wedge pattern, a classic bullish wave signal that often indicates an upcoming breakout. The price has been consolidating within a narrowing range, suggesting that selling pressure is weakening while buyers are beginning to regain control. With consistent volume con
STXUSDT has formed a bottom and is poised to rise STX is forming a bottom in the shape of a U-pattern. The altcoin is still in a consolidation phase within the wedge; however, the market has stopped making new lows and is testing the resistance level at 0.2318. A breakout could trigger a breakout from the wedge and a further rally toward 0.276–0.32
STXUSDT — Downtrend Pressure Peaks, Reversal Potential?The STX/USDT 2D timeframe clearly shows a strong downtrend since its peak around 3.0+. Price continues forming lower highs and lower lows, confirmed by a well-respected descending trendline (yellow line) acting as dynamic resistance.
Currently, price is sitting at a key support zone around 0.19 – 0
STXUSDT 1D#STX has broken out above the falling wedge pattern on the daily chart and is currently facing the SMA50, which we believe it will surpass soon. The potential upside targets are:
🎯 $0.2528
🎯 $0.2813
🎯 $0.3044
🎯 $0.3275
🎯 $0.3603
🎯 $0.4021
⚠️ Always remember to use a tight stop-loss and maintain pr
$STX Down 93% From ATH: Is This The Best Entry For A 4700% ?NASDAQ:STX Down 93% From ATH: Is This The Best Entry For A 4700% Potential Return?
#STX Trapped Retailers With A Fake Inverse Head & Shoulders Setup Near The Neckline Resistance, Dumping -93% From The Highs. Everyone Was Thinking Inverse H&S Pattern Forming And Traders Got Trapped.
But Remember I
See all ideas
Summarizing what the indicators are suggesting.
Oscillators
Neutral
SellBuy
Strong sellStrong buy
Strong sellSellNeutralBuyStrong buy
Oscillators
Neutral
SellBuy
Strong sellStrong buy
Strong sellSellNeutralBuyStrong buy
Summary
Neutral
SellBuy
Strong sellStrong buy
Strong sellSellNeutralBuyStrong buy
Summary
Neutral
SellBuy
Strong sellStrong buy
Strong sellSellNeutralBuyStrong buy
Summary
Neutral
SellBuy
Strong sellStrong buy
Strong sellSellNeutralBuyStrong buy
Moving Averages
Neutral
SellBuy
Strong sellStrong buy
Strong sellSellNeutralBuyStrong buy
Moving Averages
Neutral
SellBuy
Strong sellStrong buy
Strong sellSellNeutralBuyStrong buy
Displays a symbol's price movements over previous years to identify recurring trends.