STX Sharp Rebound: Demand Zones Ahead (4H)STX has recently experienced a very sharp and notable upward movement, showing strong bullish momentum. However, for those looking to re-enter the market, it is important to wait for a minor price-time correction. This correction would allow for a healthier entry and reduce the risk of chasing the current momentum.
Following the main CH (Consolidation/Channel), the market reacted sharply to the upside, reclaiming several key areas that had previously acted as supply zones. These reclaimed areas have now turned into demand zones, which makes them important levels to watch for potential re-entry opportunities during pullbacks. Traders can look for swing trades by buying at these demand zones when the price returns to test them.
We have identified two primary entry points for potential purchases. To manage risk effectively, it is recommended to use Dollar-Cost Averaging (DCA) when entering these positions, rather than committing the full amount at a single level. This approach reduces exposure to sudden price reversals and helps optimize the average entry price.
Profit targets have been clearly marked on the chart. Traders should consider taking partial profits at the first target and moving their stop loss to break-even to protect capital. For those with a more conservative risk profile, it is also entirely reasonable to close the full position at the first target, locking in profits without waiting for higher levels.
It is important to note that this outlook will be invalidated if a 4-hour candle closes below the defined invalidation level. Such a move would signal a potential shift in market sentiment and should prompt traders to reconsider their positions.
Overall, this setup presents a structured approach to swing trading, combining technical levels with risk management strategies. By carefully monitoring the demand zones, pullbacks, and targets, traders can participate in potential upward moves while maintaining a disciplined and risk-aware strategy.
If you have a coin or altcoin you want analyzed, first hit the like button and then comment its name so I can review it for you.
This is not a trade setup, as it has no precise stop-loss, stop, or target. I do not publish my trade setups here.
Stxusd

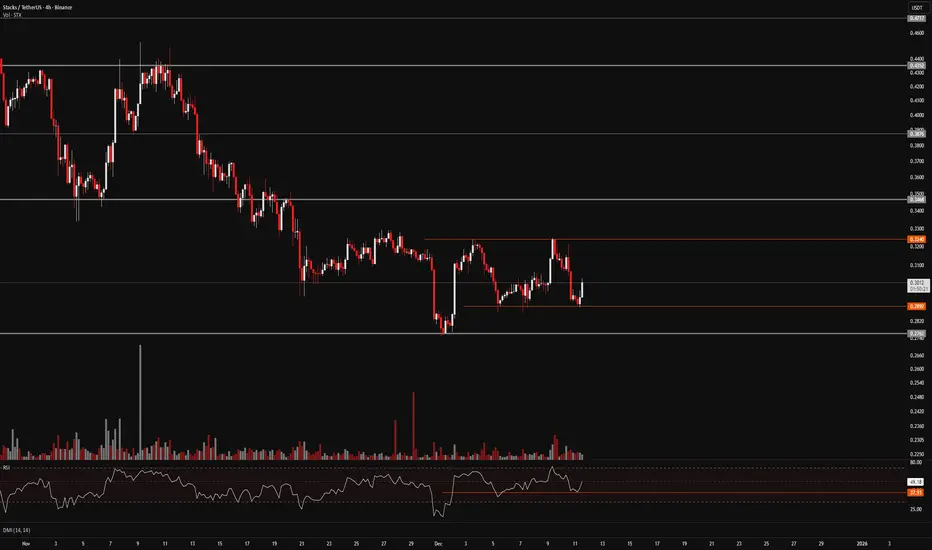
FireHoseReel | STX Breakout Loading at Key Levels🔥 Welcome To FireHoseReel !
Let’s jump into Stacks (STX) market analysis.
🪙 Stacks (rank #88) powers Bitcoin smart contracts, letting users build DeFi, NFTs, and apps on BTC with security anchored to the Bitcoin chain.
👀 STX 4H Overview
STX is in a clear downtrend on the monthly, weekly, and daily charts. On the 4H timeframe, it has formed a small consolidation zone. A breakout in either direction can create a tradable setup from this consolidation.
📊 Volume Analysis
Stacks is currently showing significant volume decline, and the last volume spike leaned toward selling pressure. A breakout through the orange pre-breakout zones could trigger a notable increase in volume.
✍️ STX Trading Scenarios
🟢 Long Scenario:
A breakout above $0.324 with rising buy volume creates a pre-breakout setup targeting the $0.346 resistance—suitable for a risky long entry.
🔴 Short Scenario:
Losing the $0.2899 support with increasing sell volume—especially if RSI dips into oversold—could act as a pre-breakout signal for a deeper move toward $0.2762.
🧠 Protect your capital first. No setup is worth blowing your account. If risk isn’t controlled, profit means nothing. Trade with rules, not emotions.
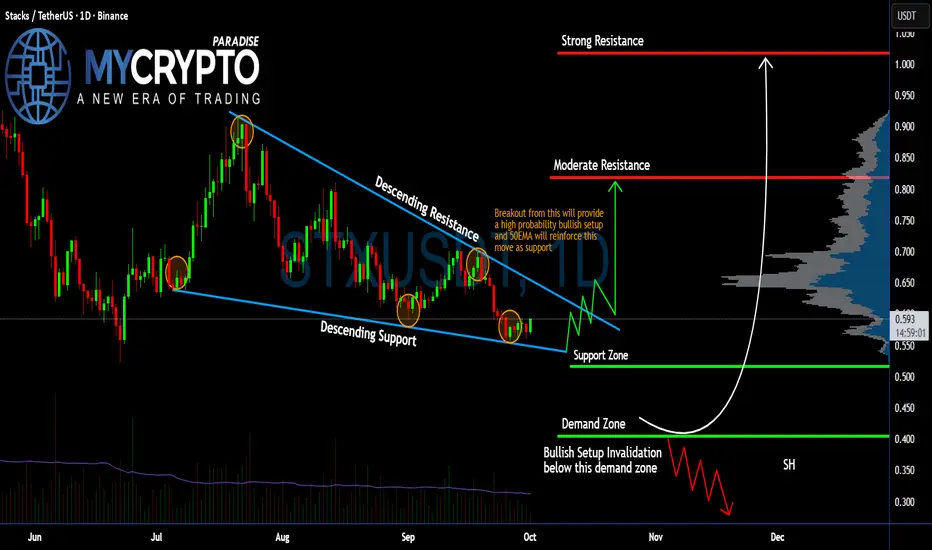
Is #STX Ready to Make an Explosive Bullish Move? Must Watch Yello Paradisers! Are we about to witness a powerful breakout of #STX, or is a trap lurking right under our feet? Let's decode this #STXUSDT setup before it’s too late:
💎#Stacks has been stuck in a clear falling wedge on the daily timeframe by consistently respecting both the descending resistance and descending support lines since late July. Price action is now compressing near the lower end of this structure, showing signs of potential accumulation.
💎Right now, #STXUSD is trading around $0.59, sitting just above the support zone at $0.51, and not far above the final demand zone at $0.40. This area is crucial. As long as bulls defend this zone, the structure remains intact and the bullish scenario is valid.
💎A confirmed breakout above the descending resistance, ideally with a retest of that line alongside support from the 50EMA, would flip this into a high-probability bullish setup. If that happens, we’ll first be targeting the moderate resistance at $0.818. A sustained move above $0.818 opens the door toward the strong resistance at $1.018. That’s your upside target, but only if we break the descending channel cleanly.
💎However, a break below $0.40 would invalidate this entire bullish structure. If this demand zone fails, the setup is broken, and the market could go on to sweep the lower liquidity zones, likely toward $0.30 and below. That’s where over-leveraged bulls will get wiped out.
Strive for consistency, wait for clear confirmations, and remember that discipline always beats chasing quick profits.
MyCryptoParadise
iFeel the success🌴
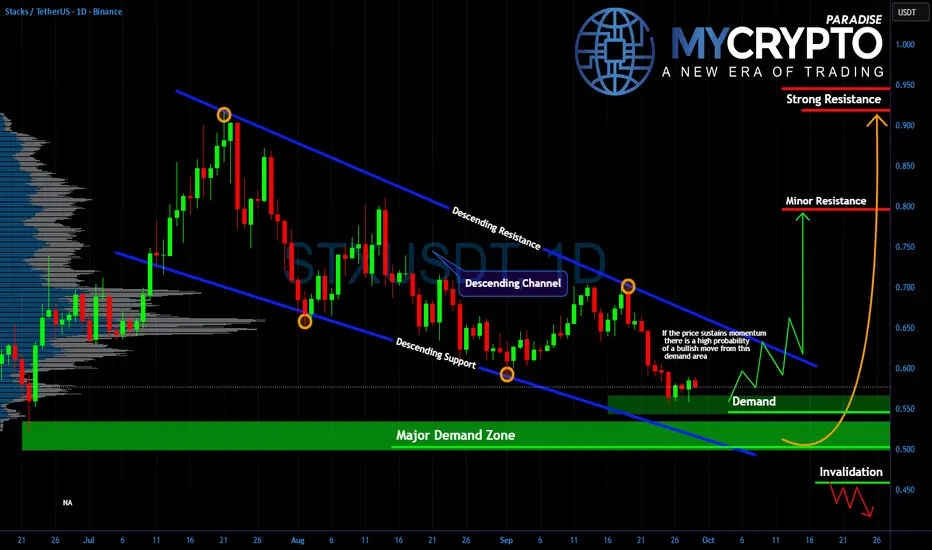
Is STX About to Explode or Collapse From This Demand Zone?Yello Paradisers, what if I told you that the next big move on STX could decide whether traders print money or get wiped out in days? The chart is painting a dangerous setup, and ignoring it could be costly.
💎#STXUSDT has been stuck in a clear descending channel, repeatedly rejecting from its resistance line and finding temporary relief at its support. Now, price is testing a major demand zone between $0.55–$0.58, a level that could either spark a strong reversal or lead to brutal breakdowns if demand fails.
💎If buyers defend this level with momentum, the probability of a bullish rebound increases significantly. A breakout above the descending resistance could fuel a rally toward the minor resistance at $0.80 and potentially extend all the way to the strong resistance near $0.95. This move would not just trap shorts but also create panic FOMO buying from latecomers.
💎But beware if demand collapses and the zone fails to hold, invalidation comes quickly. A break below $0.50 opens the door for another leg down, flushing weak hands out of the market and creating pain for anyone holding without a plan.
Consistency, risk management, and patience are the real weapons in this market.
MyCryptoParadise
iFeel the success🌴
STX/USDT — Key Support Test, Break or Bounce?Stacks (STX/USDT) is currently sitting at a critical make-or-break zone that will define its medium- to long-term direction. On the weekly chart, price has returned to the historical demand zone at $0.42 – $0.58 (yellow box). This area has acted as a strong accumulation level multiple times before — notably during the 2022–2023 bottom before the explosive rally above $3.
---
🔎 Structure & Pattern
1. Historical Demand Zone ($0.42–$0.58)
This zone is the last stronghold for bulls before the market risks sliding back towards the historical low at $0.1987.
As long as price holds and forms a reversal pattern here (bullish engulfing, hammer, etc.), it can trigger another wave of accumulation.
2. Lower Highs Since 2024
After peaking above $3, STX has continued to print lower highs, showing that sellers still dominate.
However, a retest of this deep demand zone also sets the stage for a potential large-scale bottoming.
3. Multi-Year Range
STX has been moving within a broad $0.20 – $3.60 range since 2021.
Price is now at the bottom edge of this range, meaning downside risk is relatively limited compared to the upside potential if a rebound occurs.
---
🚀 Bullish Scenario
Early Confirmation: A weekly close back above $0.80 – $1.00.
Upside Targets:
First resistance: $1.0089
Next levels: $1.3112 → $1.7040 → $2.7367 → $3.6291
From entries in the $0.58–0.45 zone, the reward-to-risk (R:R) potential is >3:1, making this area a high-value accumulation zone.
---
⚠️ Bearish Scenario
Breakdown Confirmation: A weekly close below $0.42.
Downside Targets:
First: $0.28 (minor support)
Next: $0.1987 (historical low)
A failure here would signal renewed long-term bearish pressure and a potential return to the cycle’s bottom range.
---
🎯 Conclusion
STX is currently at a golden accumulation zone that historically has provided strong upside reactions.
Aggressive traders may look for entries at $0.58–0.45 with stops below $0.42.
Conservative traders should wait for a weekly close above $0.80–1.00 for confirmation of bullish momentum.
This is a decisive zone: hold = high rebound potential, break = risk of retesting $0.20.
---
#STX #STXUSDT #Stacks #Crypto #TechnicalAnalysis #CryptoTrading #Altcoins #PriceAction #SupportResistance #Accumulation

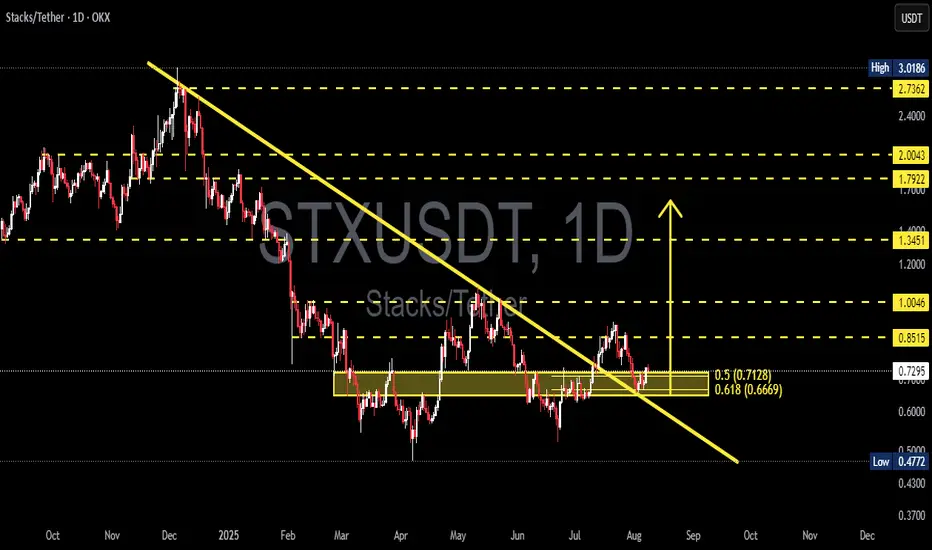
Breakout Confirmed – Is STX/USDT Ready for a Trend Reversal?Technical Analysis – STX/USDT (Daily Timeframe)
STX/USDT has shown a significant technical breakout after successfully breaching the descending trendline that has acted as a dynamic resistance since early 2025.
Currently, price is retesting a key support zone, which was a former resistance level—indicating a possible flip to demand and validation of the breakout.
---
🔹 Key Zone:
Demand zone (yellow box): 0.6669 – 0.7128
(based on Fibonacci retracement levels 0.618 and 0.5)
Current price: 0.7313
---
📈 Bullish Scenario:
Breakout from the descending trendline suggests a potential trend reversal.
As long as price holds above the 0.6669 – 0.7128 zone, upward continuation is likely.
Potential resistance targets:
0.8515
1.0046
1.3451
Extended target: 1.7922, if bullish momentum continues
---
📉 Bearish Scenario:
If price fails to hold the Fibonacci support zone, a deeper correction could follow.
Downside support levels to watch:
0.60 (psychological support)
0.4772 (2025 low)
---
📊 Pattern & Market Structure:
The trendline breakout is the first sign of a structural shift.
A successful retest and formation of a higher low could confirm a new bullish market structure.
The Fibonacci confluence zone aligns with price action support, making it a key decision area.
---
Conclusion:
STX/USDT is showing signs of recovery and a potential reversal after a prolonged downtrend. The breakout is promising, but confirmation will come if the price holds the key support zone. Traders should closely monitor the 0.6669 – 0.7128 region to gauge future price direction.
#STX #STXUSDT #CryptoBreakout #TrendReversal #FibonacciLevels #TechnicalAnalysis #Altcoins #CryptoTA #SupportResistance #PriceAction
STX/USDT Weekly Outlook Golden Accumulation Zone
📌 Overview:
STX (Stacks) is currently retesting a crucial demand zone in the $0.63 – $0.72 range — the same area that previously served as the launchpad for a massive rally toward the $3.80 highs. This chart highlights a strategic opportunity for swing traders and long-term investors who understand market cycles.
🧠 Price Structure Insight:
A well-established demand zone (highlighted in yellow) has acted as a base of accumulation since late 2022 through mid-2023.
Price is now consolidating above this zone, suggesting a potential bullish reversal.
A potential Double Bottom pattern is forming, with a neckline around the $1.00 level — a breakout above this could spark a significant bullish impulse.
🟢 Bullish Scenario (Upside Potential):
If STX maintains support and bounces from this accumulation zone, we could see a stair-step rally toward the following targets:
1. $0.90 – $1.00 → Psychological resistance & neckline of reversal pattern
2. $1.2975 → Historical supply and consolidation area
3. $1.9447 → Previous lower-high resistance zone
4. $2.20 – $2.71 → Key Fibonacci retracement levels from prior highs
5. $3.66 – $3.84 → All-Time High resistance, long-term bull target
🔍 A confirmed weekly close above $1.00 would significantly strengthen the bullish thesis and validate the reversal structure.
🔴 Bearish Scenario (Downside Risk):
If price breaks down below $0.6380, this could invalidate the current structure and lead to deeper corrections, targeting:
$0.45 → Minor support from early 2023
$0.20 → Historical macro bottom and extreme support
❗ A breakdown below this accumulation zone could trigger a longer-term bearish continuation.
🔄 Strategic Trading Notes:
This is a high-probability reversal zone, ideal for gradual accumulation (DCA) or swing entries with tight stop losses below support.
Watch for a spike in volume as a signal for institutional or smart money involvement.
Confirmation from bullish candlesticks (e.g., bullish engulfing on weekly) could provide additional entry confidence.
📚 Conclusion:
STX is testing a key structural level that previously led to exponential price growth. As long as the $0.63–$0.72 zone holds, the mid-to-long-term bias remains bullish. However, traders should remain disciplined and responsive to any invalidation signals.
#STXUSDT #Stacks #CryptoAnalysis #AltcoinSetup #TechnicalBreakout #WeeklyChart #BullishReversal #AccumulationZone #SmartMoney

STXUSDT 1W Analysis STX ~ 1W Analysis
#STX Buy back gradually from here with a short-term target of at least 20%++.

STX ANALYSIS (2D)The STX pair has reached a demand zone.
A price movement fractal seems to be repeating (highlighted by the orange and white boxes).
In the orange boxes, every time STX has dropped more than 72%, it has made a rebound move to the upside.
We are looking for buy/long positions around the demand zone.
The targets for STX are $0.93 - $1.10 - $1.30.
A daily candle close below the invalidation level will invalidate this analysis.
For risk management, please don't forget stop loss and capital management
When we reach the first target, save some profit and then change the stop to entry
Comment if you have any questions
Thank You

STXUSDT Potentially BullishBINANCE:STXUSDT is beginning to take shape and is looking good to go long. Broken the consolidation phase and retested it. The bulls are setting in however, we just might see the market slow down around the 1.152 area which turns out slightly below the EMA 200 and also aligns with a resistance point on the weekly TF. On futures trade, I will target this area while i will lock down some profits on my spot trading at this point.
This is not a trade advice as such do your due diligence
Past results does not guarantee future results

STXUSDT 1WSTX ~ 1W Analysis
#STX Buy gradually from here if you still have a Conviction on this coin with a short -term target of at least 20%+.


STXUSD - get down tooCertain arguments will certainly make a difference, but they are unlikely to change the course.


STXUSDT 1WSTX ~ 1W
#STX if you still have Conviction on the coin,. This support block would be a very good buying place for now,. Target at least 20%+ from here.

STX buy/long setup (4H)Considering the breakout of the trigger line, the price structure shift, and the creation of a demand zone, we can look for buy/long positions on STX during pullbacks.
The target could be the red zone.
We should enter the position at the green zone to minimize risk.
Closing a daily candle below the invalidation level will invalidate this analysis.
For risk management, please don't forget stop loss and capital management
Comment if you have any questions
Thank You

The last bullish chance of STX in Mid term!As you can see, the price is in an ascending triangle and is also forming the handle of a cup and handle pattern. Each of these patterns indicates a bullish trend in the medium term. We just need to wait for these patterns to break out to reach the desired target.
Give me some energy !!
✨We spend hours finding potential opportunities and writing useful ideas, we would be happy if you support us.
Best regards CobraVanguard.💚
_ _ _ _ __ _ _ _ _ _ _ _ _ _ _ _ _ _ _ _ _ _ _ _ _ _ _ _ _ _ _ _
✅Thank you, and for more ideas, hit ❤️Like❤️ and 🌟Follow🌟!
⚠️Things can change...
The markets are always changing and even with all these signals, the market changes tend to be strong and fast!!

CONGRATULATIONS STACKS!! New ATH & a Cycle Two coinBuild on Bitcoin
is a powerful narrative
do you have exposure??
Most Altcoins DO NOT make new high's cycle to cycle
So when one does you must applaud it as it gives much hope to all the shitcoin holders out there
Stacks looks like it has more room to run

The Road to $66 for STXUSDT (Stacks)$STXUSD has now beautifully broken out of the triangle after an impressive textbook correction at the 0.618 Fibonacci retracement.
This type of correction is a typical feature of wave 2 in an Elliot wave count, which indicates that $STXUSDT is now ready to embark on its third impulsive wave, often referred to as the most explosive one.
Considering the increasing volume, an explosive surge in the number of transactions on the network, and the oscillators, we can expect a swift development in the price towards the following resistance levels:
— 0.57
— 1.06
— 2.85
— 5.96
— 8.16
— 13.17.
#stxusdt #stxusd #BNS #DeFi #BitcoinNFTs #Stacks

STX has gained over 200%.From the point where we placed the green arrow on the chart, it appears that STX has entered a large diametric pattern.
It now seems that wave D has completed, and the price has entered wave E.
As long as the green zone is maintained, it can move toward the target above $7.
Closing a daily candle below the invalidation level will invalidate this analysis.
For risk management, please don't forget stop loss and capital management
Comment if you have any questions
Thank You

Are #STXUSDT Bulls Ready to Upheld the Bullish Momentum?Yello, Paradisers! Is #STXUSDT ready for a bullish breakout or will it fall? Let's discuss the latest analysis of #Stacks and see what's happening:
💎After months of grinding downward, #STX has finally reached a tipping point. The price is currently testing the upper boundary of a Descending Broadening Wedge, spurred by a solid rebound from the key support zone at $1.38–$1.51. But the big question is this: Can the bulls maintain this momentum, or are we looking at another fakeout?
💎#STXUSDT must conquer the critical resistance level at $2.28 for a true breakout. This area, which previously acted as strong support (tested twice), has now flipped into a stubborn barrier. Bulls will need a decisive move above this level, supported by increasing trading volume and the 20 EMA, to confirm the start of a genuine rally. If they succeed, the next target lies at the next major resistance zone, which could spark a significant upside move.
💎However, failing to sustain momentum could lead to a pullback toward the $1.38–$1.51 range, potentially retesting the breakout point. Losing this zone might open the door to further downside, with #Stacks slipping to the $1.05 demand zone.
💎The real danger begins if $1.05 fails to hold. A breakdown below this level would likely signal a shift in control back to the bears, leading to a deeper correction and extinguishing any short-term bullish hopes.
Stay focused, patient, and disciplined, Paradisers🥂
MyCryptoParadise
iFeel the success🌴
