SUGAR

SUGARUSD LongSugar has just broken out of a falling wedge pattern which could also be bullish flag. Nothing too complex, but I marked out where any divergences have played out coupled with the RSI > 65 signalling intermediate tops. I think sugar has anywhere from 5 to 10 percent to go up before marking another intermediate top.
For this trade, use the CANE ETF. I would suggest a stop below today's open and to just let this trade run.

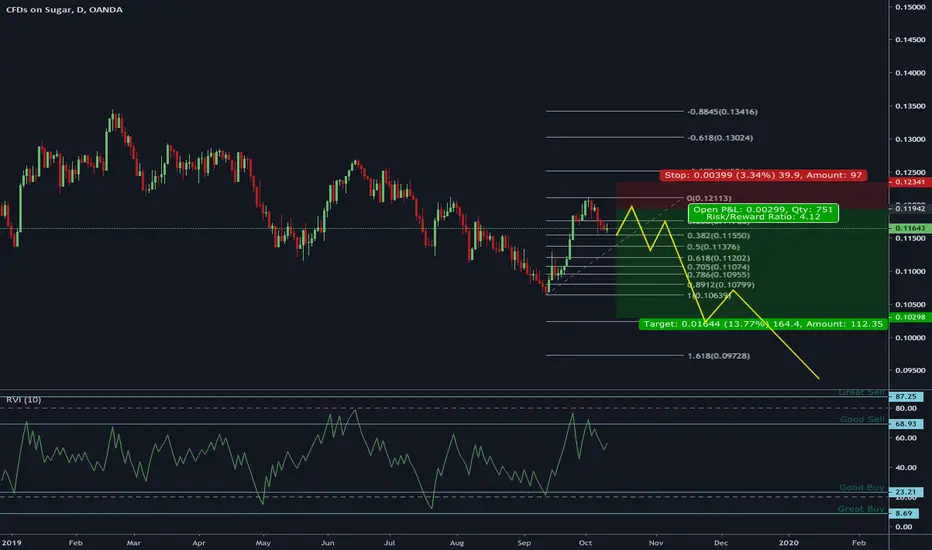
SUGAR SHORT D1 UPDATE - DOUBLE TOP REVERSAL COMING?Hey traders, this is the update for the Sugar trade that I am still currently in.
Looks like price has come back up to the green trend line before reversing.
Looking left we see that price reached this exact area before, creating a potential double top pattern.
If you did not enter before, now would be a great time with a risk to reward of 3.
If price can break the neckline bears will be in full control.
The moving averages are also looking like a bearish cross soon on the MACD.
Daily trade analysis and ideas:
Telegram: t.me
Facebook: www.facebook.com
Twitter: forex_dojo
Instagram: www.instagram.com
Website: www.forexshinobi.com
Tiktok: @forexshinobi
ForexShinobi


SUGAR DAILY ANALYSIS - TL TOUCH AND 61.8% FIB RETRACE SHORT?Sugar came up to test the upper green trendline before price reversed.
Price then retraced to the 61.8 Fib Level before moving back down.
It looks like the bears are in control for now, and Sugar should continue to push lower as October comes to an end.
Daily trade analysis and ideas:
Telegram: t.me
Facebook: www.facebook.com
Twitter: forex_dojo
Instagram: Jaylen.Forex
Website: www.forexshinobi.com
ForexShinobi

SUGAR : LONGSugar is trying to hold onto the trend channel.
We are currently in a very volatile process.
You can wait for this week's closing. (Friday)
Since I deem it appropriate for risk / reward ratio, I suggested a position like this:
Stoploss: 0.11403
Target : 0.12764

Sugar Going Down Before ChristmasPrice will eventual go up as we go closer to Christmas but it has to head back down into a area where buyers orders are waiting.
Sugar - Historical Pattern repeat?Historical data + wishfull thinking :)
And its October now,- so Sugar Rally is on!


SugarUS LongSugar weekly candle just closed above the 20 ma and the 21 ema. Looking left when that occurred in the past we had at least one additional full body weekly candle close above those moving averages before trend reversal OR start of a further uptrend , especially in those cases that 21 ema crossed over the 20 ma to the upside.
Linking this idea with my previous long position on Sugar.

Sugar Long Term chart: Sweet, Then SourBeautiful structure as sugar price gonna complete the large correction to tag the multi-decade low of 0.0526
Wave C is 5 waves and it is in the second leg of wave 4 up before the last drop.


Hello Traders, SUGAR/USD 0.12052 VS 0.12668. Trade SetupsHello Traders, SUGAR/USD 0.12052 VS 0.12668.
Looking for Yellow: a Break and continuation / corrective / Consolidation Pattern at 0.12546 / 0.12668
To Continue the upside movent towards 0.13120 / 0.3372.
Or Blue: Possible Completion Consolidation /Continuation / Corrective Pattern 0.12546
to Retest / Break previous Lows once more 0.12052 / 0.12080 towards 0.11827 / 0.11742.


SUGARus , long term perspective on the UP Trend : third EyeSUGARus , long term perspective on the UP Trend : third Eye


SUGAR LongSugar hit a support level and in my opinion, it is up from here. Market may retrace down a bit more or justgo up from here. Enter and exit at your own risk.
DISCLAIMER
Please note that this chart is an opinion based chart only. Please trade at your own risk


sugar/usd short term setupOn the weekly I see a strong down trend and on the daily, I see support turning into resistance as well so that indicates bearish movement.
On the 4hr chart, I see price get towards that resistance line and I drew up a resistance zone from the previous high and noticed it might make a double top. I am looking to go short at that moment in time.
Entry, Stop loss and Take profit are all added.

Bullish break?I'm short right now but if it manages to brake out of trend in either of the marked triangles i will go long. If it fails now there will probably be a significant dump before it rises by late february.

