[LOI] - SUI - SUI
Keypoints :
Purpose : Sui is a high-performance Layer 1 blockchain platform that enables real ownership of digital assets, data, and permissions through an object-centric model and the Move programming language, facilitating scalable, secure, and user-friendly decentralized applications across DeFi, gaming, AI, and institutional finance.
Problem Solved : It addresses blockchain's core limitations like scalability bottlenecks, high transaction fees, slow finality, and developer complexity by offering horizontal scaling, sub-second transactions, low costs, and modular tools that simplify building without compromising security or decentralization.
Bullish Case for Demand : Research suggests Sui's demand could rise significantly in 2026 due to its evolving ecosystem, with features like gas-free stablecoin transfers, protocol-level privacy, and integrations boosting adoption; strong on-chain metrics (e.g., $800M+ daily DEX volume), institutional inflows, and potential price breakouts (up to 168% gains) highlight growth potential amid broader crypto recovery, though volatility remains a factor.
Partnerships : Key collaborations include UNDP for sustainable development pilots, Bhutan’s DHI InnoTech for offline blockchain tech, LINQ for crypto-fiat in Nigeria, BitGo for WBTC integration, ZenLedger for tax tools, Nansen for analytics, and gaming firms like Epic Games Store for titles such as Super-B and XOCIETY; investor ties with Franklin Templeton, Google Cloud, and Binance Labs further strengthen its position.
Current Market Cap : Approximately $5.45 billion as of January 27, 2026, with a circulating supply of about 3.79 billion SUI out of a 10 billion total supply, priced around $1.44 USD; this valuation reflects growing TVL and adoption but exposes it to market swings.
Recent Announcements: In early 2026, Sui resolved a mainnet stall swiftly, launched DeepBook Margin for advanced trading, introduced Hydropower Fellowship for Web3 founders, announced evolutions to a unified S2 developer platform with USDsui stablecoin and fee-free transfers, and highlighted 2025 reviews showcasing global events, payments, Bitcoin integrations, and institutional adoption.
Notes on how I personally use my charts/NFA:
Each level L1-L3 and TP1-TP3 (Or S1-S3) has a deployment percentage. The idea is to flag these levels so I can buy 11% at L1 , 28% at L2 and if L3 deploy 61% of assigned dry powder. The same in reverse goes for TP. TP1: 61%, TP2:28% and TP3:11%. If chart pivots between TP's, in-between or in Between Sell levels these percentages are still respected. I like to use the trading range to accumulate by using this tactic.
Just my personal way of using this. This is not intended or made to constitute any financial advice.
This is not intended or made to constitute any financial advice.
NOT INVESTMENT ADVICE
I am not a financial advisor.
The Content in this TradingView Idea is for informational purposes only, you should not construe any such information or other material as legal, tax, investment, financial, or other advice. Nothing contained within this idea constitutes a solicitation, recommendation, endorsement, or offer to buy or sell any securities or other financial instruments in this or in in any other jurisdiction in which such solicitation or offer would be unlawful under the securities laws of such jurisdiction.
All Content on this idea post is information of a general nature and does not address the circumstances of any particular individual or entity. Nothing in the idea/post constitutes professional and/or financial advice, nor does any information on the idea/post constitute a comprehensive or complete statement of the matters discussed or the law relating thereto. You alone assume the sole responsibility of evaluating the merits and risks associated with the use of any information or other Content on the idea/post before making any decisions based on such information.
Sir. Galahad - QUANT
Disclaimer
The information and publications are not meant to be, and do not constitute, financial, investment, trading, or other types of advice or recommendations supplied or endorsed by.
SUI

#SUI/USDT#SUI
The price is moving within a descending channel on the hourly timeframe. It has reached the lower boundary and is heading towards a breakout, with a retest of the upper boundary expected.
The Relative Strength Index (RSI) is showing a downward trend, approaching the lower boundary, and an upward bounce is anticipated.
There is a key support zone in green at 1.45, and the price has bounced from this level several times. Another bounce is expected.
The indicator is showing a trend towards consolidation above the 100-period moving average, which we are approaching, supporting the upward move.
Entry Price: 1.50
First Target: 1.52
Second Target: 1.56
Third Target: 1.60
Stop Loss: Below the green support zone.
Remember this simple thing: Money management.
For any questions, please leave a comment.
Thank you.

Sui coin could drop to 0.47Sui coin is currently at 1.5060 and these fabionacci level of 1.5141 was strong resistance and now it is below it and could drop to 0.47

SUI – Long Spot Setup at Key SupportSUI has retraced into a major support zone that has historically provided strong bullish reactions. We're watching the $1.45–$1.50 range as a key accumulation area for a laddered long spot position.
📈 Trade Plan:
Entry Zone: $1.45 – $1.50
Take Profit Targets:
• TP1: $1.65 – $1.95
• TP2: $2.20 – $2.50
Stop Loss: Below $1.30 (invalidates support structure)
This setup offers a favorable risk-reward profile as long as the $1.30 level holds. Watching closely for volume confirmation and potential bullish divergence before fully sizing in.

SUI🚀 SUI Expansion Pattern Analysis – High-Probability Bullish Setup
Based on the current market structure, SUI appears to be developing an Expansion pattern, with Wave D nearing completion. This setup is a classic structure often used by market makers to accumulate liquidity from both buyers and sellers before a strong directional move.
The market is currently in the final stages of Wave D, which typically serves as a corrective phase within this pattern. Understanding this phase is crucial for traders who want to enter high-probability trades without chasing the market.
🟢 Key Support Zone & Wave E Outlook
The green highlighted zone on the chart represents the area where the bearish momentum of SUI is expected to exhaust. Once price reaches this zone, the market is likely to transition into Wave E, which in this pattern is inherently bullish.
From a trading perspective:
The green zone is ideal for DCA (Dollar-Cost Averaging) entries
Enter positions gradually rather than all at once to maximize risk-reward efficiency
Let the market confirm support before scaling in
🎯 Targets & Risk Management
All bullish targets are clearly marked on the chart for easy reference and trade planning
⚠️ Invalidation Level: A daily candle close below the invalidation level will negate this analysis and signal a structural failure
💡 Why This Pattern Matters
Expansion patterns like this are highly favored in trading because they:
Allow traders to enter near liquidity zones with a better risk-to-reward ratio
Highlight where market makers are likely to trap retail positions before a breakout
Provide a clear roadmap of expected wave progression, which is invaluable for planning entries and exits
By following this structure, traders can align with the market’s bullish momentum while minimizing unnecessary exposure to risk.
If you have a coin or altcoin you want analyzed, first hit the like button and then comment its name so I can review it for you.
This is not a trade setup, as it has no precise stop-loss, stop, or target. I do not publish my trade setups here.

SUI Daily OTE Rejection - Pin Bar Signal Toward SSL and FVGs📝 Description
SUI on Daily timeframe is trading inside a bearish HTF structure and has now retraced into the 0.618–0.786 OTE zone, where a clear FVG is present. Price reaction in this area suggests weakening upside momentum rather than acceptance above value.
________________________________________
📈 Analysis (Scenario-Based | Non-Signal)
If the latest daily candle closes as a pin bar within the 0.618–0.786 zone and inside the FVG, downside probability increases. This behavior would signal rejection from premium, favoring a bearish rotation toward lower liquidity.
Downside Expectation:
• Draw toward lower FVGs (1.780 and 1.535)
• Targeting Sell-Side Liquidity (SSL) below recent lows
• Move classified as liquidity-driven continuation, not a trend change
________________________________________
🎯 ICT & SMC Notes
• Confluence of OTE (0.618–0.786) with reversal FVG
• Pin bar close = premium rejection
• Bias shifts toward SSL draw
________________________________________
🧩 Summary
A pin bar close on D within the 0.618–0.786 OTE and reversal FVG strengthens the case for a bearish continuation. Under this condition, price is likely to rotate lower toward FVG inefficiencies and SSL, aligning with the dominant HTF bearish framework.
________________________________________
🌍 Fundamental Notes / Sentiment
SUI remains risk-sensitive. Any return of risk-off or USD strength can speed up the SSL draw after rejection from the 0.618–0.786 OTE. In a risk-on environment, downside may stay corrective, D close confirmation remains key.
________________________________________
⚠️ Risk Disclosure
Trading involves substantial risk and may result in capital loss. This analysis is for educational purposes only and does not constitute financial advice. Always apply proper risk management, predefined stop-loss levels, and disciplined position sizing aligned with your trading plan.

SUI Rock-n-Roll HandsTariffs or no tariffs—Greenland or no Greenland—SUI began breaking down well over seven days ago. The structure was already in place.
On January 14, SUI completed what I refer to as “rock and roll hands”: a long-duration double top with extended consolidation between the two peaks. This was not a sudden reaction to macro headlines, but a mature technical formation reaching resolution.
The retracement that occurred on Sunday, January 18 aligns perfectly with the wick printed on December 28, and it cleanly tags the 0.786 Fibonacci retracement when measured from $1.39 on December 31 to the $2.00 peak on January 5. The symmetry here is hard to ignore.
Given this alignment, there should be no surprise that SUI followed through to the downside. While macroeconomic factors may have acted as the catalyst, the move itself was technically inevitable.
Now that price has reached $1.51, SUI appears primed for another attempt at the $2.00 level.

SUI, volatile, but local uptrend intactCRYPTOCAP:SUI
🎯Price printed a 3 white knight bullish engulfing pattern, reclaiming the daily pivot, now being tested as support. Wave 2 of a new uptrend appears to be underway. Wave 3 has a first target of the daily 200EMA, followed by $3.1
📈 After negating the bearish divergence, daily RSI has unconfirmed hidden bullish divergence forming.
👉 Analysis is invalidated below $1.31, keeping the downtrend alive
Safe trading

#SUI/USDT – Bullish Triangle Breakout Confirmed | Resistance#SUI
The price is moving within a descending channel on the hourly timeframe. It has reached the lower boundary and is heading towards a breakout, with a retest of the upper boundary expected.
The Relative Strength Index (RSI) is showing a downward trend, approaching the lower boundary, and an upward bounce is anticipated.
There is a key support zone in green at 1.76, and the price has bounced from this level several times. Another bounce is expected.
The RSI is showing a trend towards consolidation above the 100-period moving average, which we are approaching, supporting the upward move.
Entry Price: 1.81
First Target: 1.85
Second Target: 1.90
Third Target: 1.94
Stop Loss: Below the green support zone.
Remember this simple thing: Money management.
For any questions, please leave a comment.
Thank you.

#SUI/USDT – Bullish Triangle Breakout Confirmed | Resistance#SUI
The price is moving within a descending channel on the hourly timeframe. It has reached the lower boundary and is heading towards a breakout, with a retest of the upper boundary expected.
The Relative Strength Index (RSI) is showing a downward trend, approaching the lower boundary, and an upward bounce is anticipated.
There is a key support zone in green at 1.80, and the price has bounced from this level several times. Another bounce is expected.
The RSI is showing a trend towards consolidation above the 100-period moving average, which we are approaching, supporting the upward move.
Entry Price: 1.81
First Target: 1.85
Second Target: 1.90
Third Target: 1.94
Stop Loss: Below the green support zone.
Remember this simple thing: Money management.
For any questions, please leave a comment.
Thank you.

SUIUSDT 30m LTF BSL Reaction and Pullback Setup📝 Description
BINANCE:SUIUSDT has pushed into a local liquidity high and is reacting below the HTF range high. The current move shows exhaustion after a sharp upside leg, suggesting a corrective pullback rather than continuation.
________________________________________
📈 Signal / Analysis
Primary Bias: Bearish while price holds below the LTF BSL and 30m supply
Preferred Setup:
• Entry: 1.803
• Stop Loss: Above 1.816
• TP1: 1.786
• TP2: 1.778
• TP3: 1.767
________________________________________
🎯 ICT & SMC Notes
• Reaction from LTF BSL
• No valid bullish BOS after last pullback
• Downside liquidity still untouched
________________________________________
🧩 Summary
As long as price remains capped below local highs, a corrective pullback toward lower M30 PD arrays is favored.
________________________________________
🌍 Fundamental Notes / Sentiment
Although Core CPI came in below expectations, the market quickly reversed, showing the USD has not lost meaningful strength. Risk appetite remains weak, keeping SUI biased to the downside in short-term.
________________________________________
⚠️ Risk Disclosure
Trading involves substantial risk and may result in capital loss. This analysis is for educational purposes only and does not constitute financial advice. Always apply proper risk management, predefined stop-loss levels, and disciplined position sizing aligned with your trading plan.

SUI M30 FVG Rejection and Continuation Setup📝 Description
On the M30 timeframe, CRYPTOCAP:SUI is pressing into a clear H1 supply / Order Block while still trading under a descending structure. The current pause under the zone looks like a controlled reaction rather than acceptance, keeping the probability of a downside continuation toward lower inefficiencies active.
________________________________________
📈 Signal / Analysis
Primary Bias: Bearish while below the 1.82 area
Preferred Setup:
• Entry: 1.8 (30m FVG rejection)
• Stop Loss: Above 1.815
• TP1: 1.784
• TP2: 1.764
• TP3: 1.745
________________________________________
🎯 ICT & SMC Notes
• Reaction inside an unmitigated H1 Order Block / supply
• Downside targets align with M30 inefficiency (FVG) and liquidity draws
• No bullish CHOCH/BOS confirmed to justify a reversal narrative
________________________________________
🧩 Summary
CRYPTOCAP:SUI is reacting at a higher-timeframe supply zone, and as long as price stays capped below the H1 OB, the move is treated as a pullback. Rejection from this area keeps TP1–TP3 in play, with 1.745 as the deeper draw.
________________________________________
🌍 Fundamental Notes / Sentiment
Stronger USD supports tighter financial conditions, reducing risk appetite. In this environment, risk assets like crypto remain vulnerable, keeping SUI biased to the downside.
________________________________________
⚠️ Risk Disclosure
Trading involves substantial risk and may result in capital loss. This analysis is for educational purposes only and does not constitute financial advice. Always apply proper risk management, predefined stop-loss levels, and disciplined position sizing aligned with your trading plan.

#SUI/USDT RSI Exhaustion and Bearish Pullback Setup#SUI
The price is moving in an ascending channel on the 1-hour timeframe. It has reached the upper limit and is heading towards breaking it. A retest of the upper limit is expected.
We have an upward trend on the RSI indicator, which has reached near the upper limit. A downward reversal is expected.
There is a key support zone in green at the 2.00 price level. The price has bounced from this level multiple times and is expected to bounce from it again.
We have a trend of consolidation above the 100-period moving average, as we are moving close to it. This supports a downward move towards touching this level.
Entry price: 1.96
First target: 1.95
Second target: 1.90
Third target: 1.84
Stop loss: Above the resistance zone in green.
Don't forget a simple thing: money management.
For inquiries, please leave a comment.
Thank you.

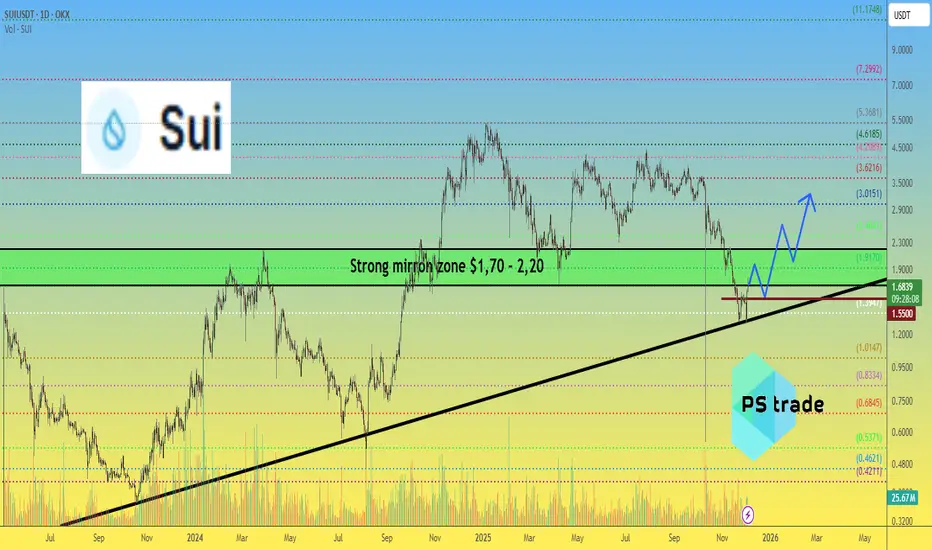
SUI price Update — Double Bottom & Next Targets📉 In November, the price of CRYPTOCAP:SUI was saved twice right at the edge — perfectly on the trendline support, forming a classic double bottom.
📈 Yesterday we finally saw the effect: a strong +30% pump, and the full technical target of this pattern points directly toward $2.
But what comes next is where it gets interesting:
🔹 Buyers must not allow OKX:SUIUSDT to drop below $1.55 — that’s the critical structural level.
🔹 Then CRYPTOCAP:SUI needs to break out and firmly hold above the mirror zone at $1.70–2.20.
🔹 And afterward… it must push through $3, opening the road to much bigger levels.
🎯 Just a few “simple” steps 😄 — and the pathway toward $7, or even $11, becomes fully realistic for #SUI.
🤔 What do YOU think: is CRYPTOCAP:SUI entering its next expansion phase?
______________
◆ Follow us ❤️ for daily crypto insights & updates!
🚀 Don’t miss out on important market moves
🧠 DYOR | This is not financial advice, just thinking out loud
SUI Pullback Setup – Eyeing the Next Leg UpSUI has rallied impressively from the ~$1.40 area into strong resistance at $2.00. This move confirms bullish strength, but we’re now seeing signs of exhaustion near this resistance zone. A short-term pullback is expected, which could offer a better entry point for the next leg higher.
📍 Entry Zone: Watching for a dip toward $1.65, which aligns with potential support from previous structure and could act as a launchpad for buyers to re-enter.
🎯 Targets:
• TP1: $2.20 – $2.50
• TP2: $3.00 – $3.30
❌ Stop-Loss: Just below $1.50, to protect against a deeper correction or invalidation of the bullish setup.

SUI Short-term analysis | Trading and expectationsCRYPTOCAP:SUI
🎯Price printed a 3 white knight bullish engulfing pattern, reclaiming the daily pivot. Wave 3 of a new uptrend appears to be underway with a target of the daily 200EMA followed by $3.1
📈 Daily RSI bearish divergence has been negated
👉 Analysis is invalidated below $1.31, keeping the downtrend alive
Safe trading

#SUI/USDT – Bullish Triangle Breakout Confirmed | Resistance #SUI
The price is moving in a descending channel on the 1-hour timeframe and is expected to break out and continue upwards.
We have a trend to stabilize above the 100-period moving average again.
We have a downtrend on the RSI indicator, which supports an upward move if it breaks above it.
We have a key support zone in green that pushed the price higher at 1.75.
Entry price: 1.77
First target: 1.80
Second target: 1.84
Third target: 1.88
For risk management, don't forget your stop-loss and capital management.
The stop-loss is below the support zone in green.
Upon reaching the first target, take some profit and then change your stop-loss order to an entry order.
For any questions, please comment.
Thank you.

SUI Macro analysis | The bigger picture | Long-term holdersCRYPTOCAP:SUI
🎯 Price appears to have completed a shallow wave (B) correction at the S1 weekly pivot and 0.5 Fibonacci retracement. The chart is clean. Wave (C) has a terminal target os the R3 weekly pivot at $10.38 but could also over extend in the right conditions towards the R5, $15.
📈 Price is below the weekly pivot, and there is no 200EMA yet on this young asset. Weekly RSI is ticking bullish near oversold with no divergence.
👉 Analysis is invalidated below wave (B) at $1.3
Safe trading

SUI is on the verge of another rally (4H)From the point where we marked the green arrow on the chart, a bullish phase has started on SUI. This area acted as a key reaction zone where buyers stepped in decisively, shifting market sentiment from corrective to bullish.
Based on the current price structure, it appears that we are developing an ABC corrective pattern. In this structure, Wave B has formed as a triangle, which is a common consolidation pattern before continuation. The triangle suggests decreasing volatility and balance between buyers and sellers before the next impulsive move.
At the moment, price action indicates that we are still inside Wave B, with one final sub-wave remaining wave “e” of the triangle. Once this last leg of the triangle is completed, the corrective phase should be fully exhausted.
After the completion of this final wave, the market is expected to resume its bullish move in the form of Wave C, which typically unfolds as a strong impulsive rally. This next move should bring expansion in both momentum and volume compared to the corrective structure we are currently seeing.
To manage risk and execution efficiently, two entry zones have been clearly marked on the chart, and positions should be built using a DCA (Dollar-Cost Averaging) approach rather than a single entry. This allows better positioning in case of short-term volatility during the end of Wave B.
The projected targets for Wave C are also outlined on the chart, based on classical Elliott Wave projections and prior market structure. These levels represent logical areas where partial or full profit-taking can be considered.
⚠️ Invalidation:
This analysis will be invalidated if a candle closes below the marked invalidation level. A confirmed close below that level would indicate that the current wave structure is no longer valid and that the market may be transitioning into a different scenario.
As always, this setup is based on technical structure and probability, not certainty. Proper risk management is essential.
If you have a coin or altcoin you want analyzed, first hit the like button and then comment its name so I can review it for you.
This is not a trade setup, as it has no precise stop-loss, stop, or target. I do not publish my trade setups here.

SUIUSDT – Trade ideaSUI is trading inside a broader downtrend but is currently reacting from a key demand area with multiple FVGs below.
Price already tapped the upper imbalance and may sweep lower liquidity before continuation.
Positioning
Already in the trade.
Looking to add more on deeper pullbacks into the lower FVG, aiming for a higher time-frame mean reversion move.
Bias
As long as price holds above invalidation, this remains a pullback-to-imbalance long setup.
Patience is key — let price fill the imbalance.
MrC

SUI M30 RSI Exhaustion and Bearish Pullback Setup📝 Description
SUI on M30 just ran hard into HTF supply, but RSI has exited the overextension zone and is rolling over, which usually signals momentum exhaustion. That tells me buyers are losing strength, so a bearish pullback is likely to rebalance toward the nearby imbalances below.
________________________________________
📈 Signal / Analysis
Primary Bias: Bearish pullback while below 1.535
Short Setup (Reactive):
• Entry (Sell): 1.520–1.530 (HTF supply reaction)
• Stop Loss: Above 1.535
• TP1: 1.5025
• TP2: 1.4822 (30M FVG)
• TP3: 1.4578 (deeper FVG / liquidity)
________________________________________
🎯 ICT & SMC Notes
• Price tapped HTF OB / supply
• RSI rolling over after leaving overextension zone
• FVG 30M below as downside magnet
________________________________________
🧩 Summary
After a big run, RSI is basically saying “enough.” While price stays capped under supply, odds favor a controlled drop toward 1.50 then 1.48. If weakness persists, 1.45 becomes the next clean draw.
________________________________________
🌍 Fundamental Notes / Sentiment
Alts are still reactive and prone to quick rotations. Without a fresh catalyst, these premium rejections often resolve with a pullback into liquidity and imbalance.
________________________________________
⚠️ Risk Disclosure
Trading involves substantial risk and may result in capital loss. This analysis is for educational purposes only and does not constitute financial advice. Always apply proper risk management, predefined stop-loss levels, and disciplined position sizing aligned with your trading plan.

#SUI/USDT Could switch sides soon. Be ready#SUI
The price is moving in a descending channel on the 1-hour timeframe. It has reached the lower boundary and is heading towards a breakout, with a retest of the upper boundary expected.
We are seeing a bearish trend in the Relative Strength Index (RSI), which has reached near the lower boundary, and an upward bounce is expected.
There is a key support zone in green at 1.37, and the price has bounced from this level several times. Another bounce is expected.
We are seeing a trend towards stabilizing above the 100-period moving average, which we are approaching, supporting the upward trend.
Entry Price: 1.40
First Target: 1.431
Second Target: 1.465
Third Target: 1.50
Remember a simple principle: Money Management.
Place your stop-loss order below the green support zone.
For any questions, please leave a comment.
Thank you.

#SUI/USDT Could switch sides soon. Be ready#SUI
The price is moving in a descending channel on the 1-hour timeframe. It has reached the lower boundary and is heading towards breaking above it, with a retest of the upper boundary expected.
We have a downtrend on the RSI indicator, which has reached near the lower boundary, and an upward rebound is expected.
There is a key support zone in green at 1.40. The price has bounced from this zone multiple times and is expected to bounce again.
We have a trend towards consolidation above the 100-period moving average, as we are moving close to it, which supports the upward movement.
Entry price: 1.43
First target: 1.46
Second target: 1.50
Third target: 1.56
Don't forget a simple principle: money management.
Place your stop-loss below the support zone in green.
For any questions, please leave a comment.
Thank you.
