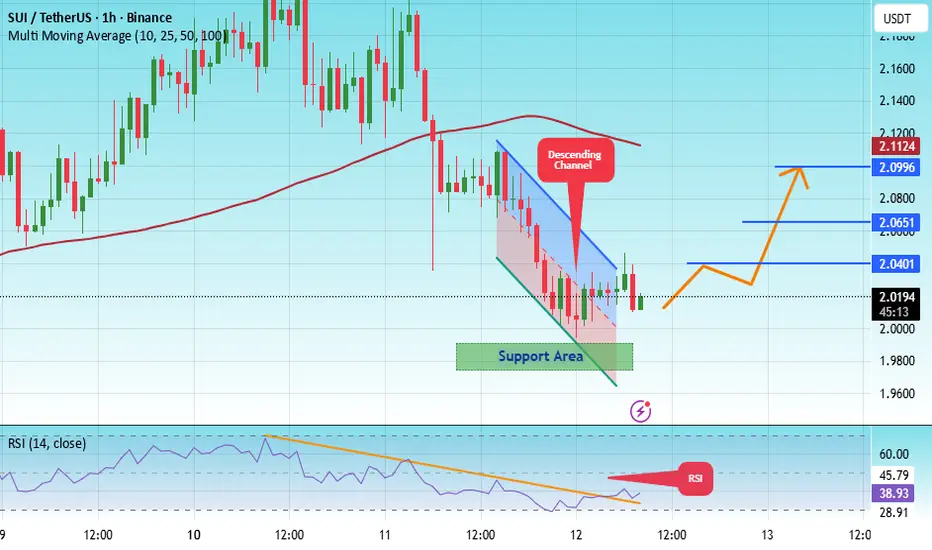
#SUI/USDT – Bullish Triangle Breakout Confirmed | Resistance Li#SUI
The price is moving within an ascending channel on the 1-hour timeframe and is adhering to it well. It is poised to break out strongly and retest the channel.
We have a downtrend line on the RSI indicator that is about to break and retest, which supports the upward move.
There is a key support zone in green at the price of 1.98, representing a strong support point.
We have a trend to stabilize above the 100-period moving average.
Entry price: 2.02
First target: 2.04
Second target: 2.06
Third target: 2.02
Don't forget a simple money management tip:
Place your stop-loss order below the support zone in green.
Once you reach the first target, save some money and then change your stop-loss order to an entry order.
For any questions, please leave a comment.
Thank you.
SUI
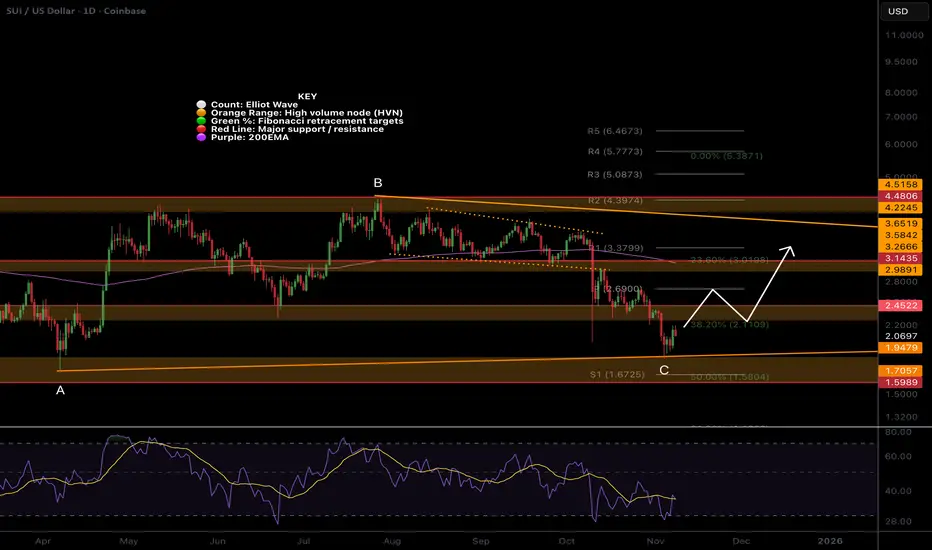
SUI remains in a shallow Fib triangleCRYPTOCAP:SUI Price remains in a downtrend, falling below a major High Volume Node support, tapping the macro triangle lower boundary.
Wave C of the triangle appears complete. If this count is correct, we should accelerate to the upper boundary around $3.6 over the next month or so, with some difficulty at the daily 200EMA and pivot as resistance.
📈 Daily RSI printed bullish divergence from oversold
👉 Continued downside loses the triangle pattern, and the next target is $1.6
Safe trading
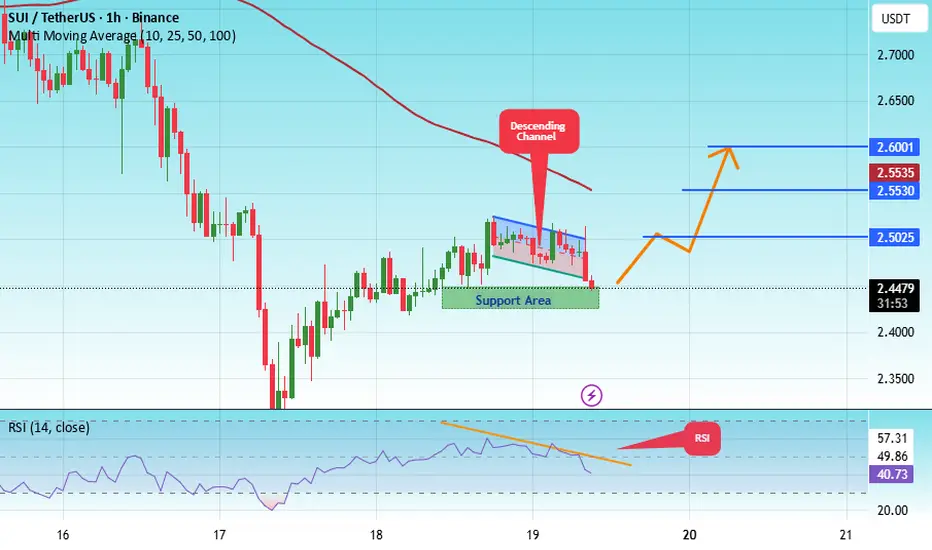
#SUI/USDT The Interesting part of the market#SUI
The price is moving in a descending channel on the 1-hour timeframe and is expected to break out and continue upwards.
We have a trend to stabilize above the 100-period moving average again.
We have a downtrend on the RSI indicator, which supports an upward move if it breaks above it.
We have a key support zone in green that pushed the price up to 1.93.
Entry price: 1.96
First target: 1.97
Second target: 2.02
Third target: 2.04
For risk management, don't forget your stop-loss and capital management.
The stop-loss is below the support zone in green.
Upon reaching the first target, take some profit and then change your stop-loss order to an entry order.
For any questions, please comment.
Thank you.

SUI Approaching Major Support – Long Spot OpportunitySUI has entered a key support zone between $1.82 – $1.96, a level that has historically shown strong demand. Price is consolidating near the upper end of this zone, which could indicate potential accumulation. If this level holds, it presents a solid opportunity for a long spot entry.
🔹 Entry Zone: $1.82 – $1.96
🔹 Stop Loss: Below $1.75
🔹 Take Profit Targets:
• TP1: $2.40 – $2.80
• TP2: $3.10 – $3.55
This setup offers a favorable risk-to-reward ratio, especially if volume and market momentum align with the bounce. Watch for bullish confirmation signals—such as strong candle closes or rising volume—within the support zone before entering. Always respect the stop loss to protect capital.

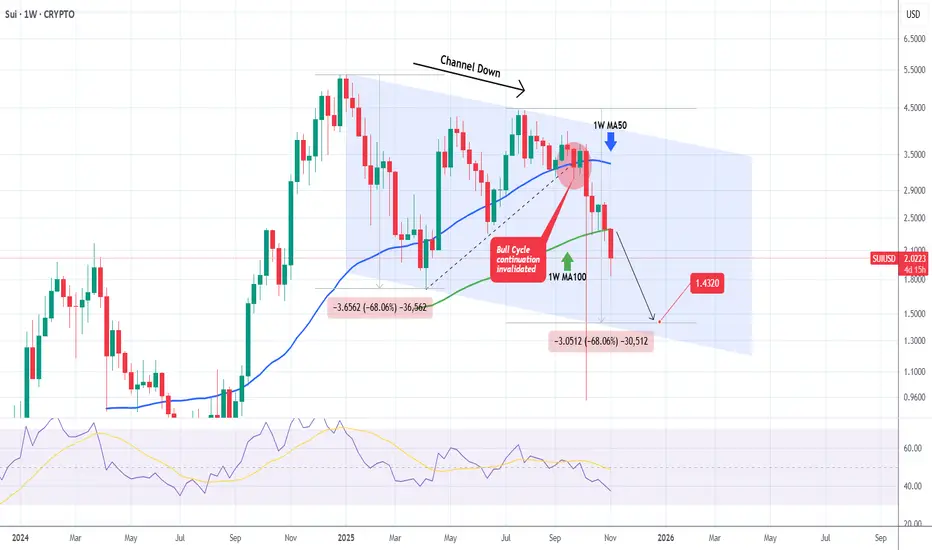
SUIUSD Channel Down to accelerate more selling towards 1.4320.Sui (SUIUSD) has established a Channel Down on the 1W time-frame, trading under Lower Highs since the December 30 2024 High. The Bull Cycle got invalidated on September 22 2025 when the price broke below the inner Higher Lows trend-line (dashed) and this week may confirm the new Bear Cycle as it will most likely close a 1W candle below the 1W MA100 (green trend-line).
We expect the current decline to repeat at least the -68.06% drop of the first Bearish Leg of the pattern and targe 1.4320.
-------------------------------------------------------------------------------
** Please LIKE 👍, FOLLOW ✅, SHARE 🙌 and COMMENT ✍ if you enjoy this idea! Also share your ideas and charts in the comments section below! This is best way to keep it relevant, support us, keep the content here free and allow the idea to reach as many people as possible. **
-------------------------------------------------------------------------------
💸💸💸💸💸💸
👇 👇 👇 👇 👇 👇
SUI (Y23.P2.E1). Wave 3 to 4 in progressHi traders,
I do see a good opportunity to find a shorting position in the coming days or week\s.
This is a grind line for wave 4 and as soon a it breaks this prevailing support TL, its time to short.
The BAR strategy.
All the best,
S.SAri

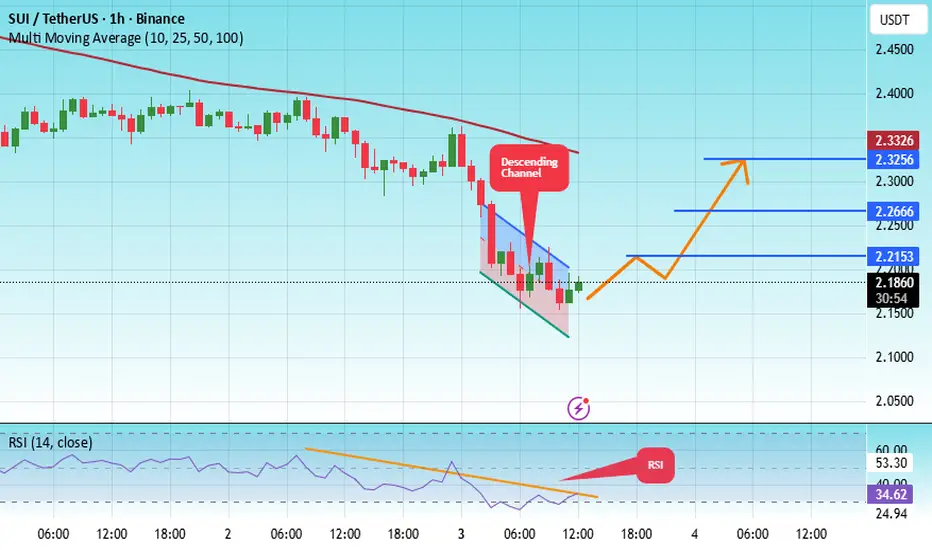
#SUI/USDT The Interesting part of the market#SUI
The price is moving within an ascending channel on the 1-hour timeframe and is adhering to it well. It is poised to break out strongly and retest the channel.
We have a downtrend line on the RSI indicator that is about to break and retest, which supports the upward move.
There is a key support zone in green at the price of 2.14, representing a strong support point.
We have a trend of consolidation above the 100-period moving average.
Entry price: 2.18
First target: 2.215
Second target: 2.26
Third target: 2.32
Don't forget a simple money management rule:
Place your stop-loss order below the support zone in green.
Once the first target is reached, save some money and then change your stop-loss order to an entry order.
For any questions, please leave a comment.
Thank you.
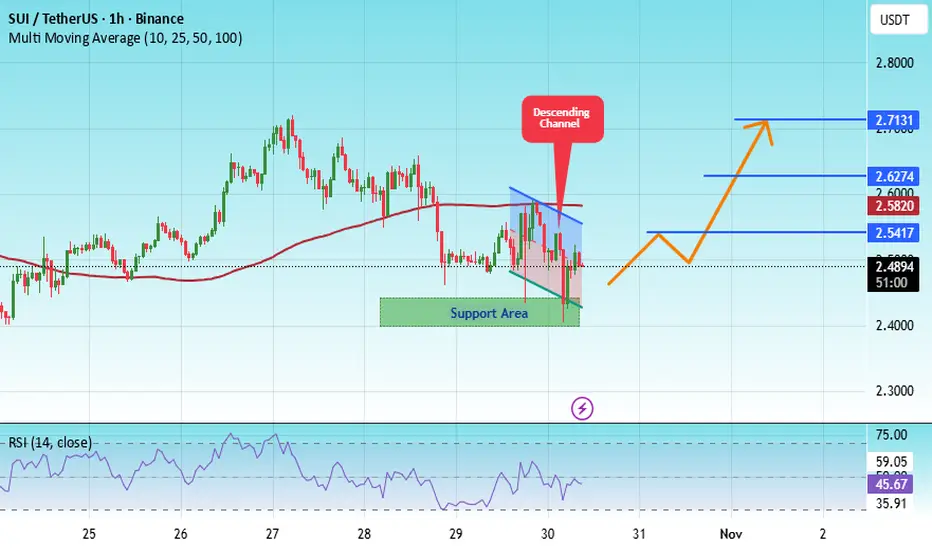
#SUI/USDT The Interesting part of the market#SUI
The price is moving within an ascending channel on the 1-hour timeframe and is adhering to it well. It is poised to break out strongly and retest the channel.
We have a downtrend line on the RSI indicator that is about to break and retest, which supports the upward move.
There is a key support zone in green at the price of 2.42, representing a strong support point.
We have a trend to stabilize above the 100-period moving average.
Entry price: 2.49
First target: 2.61
Second target: 2.62
Third target: 2.71
Don't forget a simple point: money management.
Upon reaching the first target, save some money and then change your stop-loss order to an entry order.
For any questions, please leave a comment.
Thank you.
SUI: SlippedSUI recently faced renewed pressure but is expected to recover soon. The magenta wave is likely to extend slightly further toward resistance at $4.57, where we anticipate this wave will peak. Afterward, a short-term correction in wave is likely before wave should drive price sustainably above the $4.57 level. A lower bottom would only become likely if support at $0.55 is breached. In that scenario, an alternative wave alt.B in turquoise would come into play, which we currently estimate has a 37% probability.

#SUI/USDT - Head and Shoulders Long#SUI
The price is moving within a descending channel on the 1-hour frame, adhering well to it, and is heading for a strong breakout and retest.
We have a bearish trend on the RSI indicator that is about to be broken and retested, which supports the upward breakout.
There is a major support area in green at 2.38, representing a strong support point.
We are heading for consolidation above the 100 moving average.
Entry price: 2.40
First target: 2.48
Second target: 2.54
Third target: 2.63
Don't forget a simple matter: capital management.
When you reach the first target, save some money and then change your stop-loss order to an entry order.
For inquiries, please leave a comment.
Thank you.

SUI remains in macro triangleNothing changed form last update, plan is playing out. Wave (c) of D is underway and should test the triangle upper boundary and find resistance at the High Volume Node along the way- $3.14.
Daily RSI hit oversold with no divergence. wave E is expected to be shallow
Safe trading
My point of View For SUIDear Follower
I got a multi request to analyze SUI
I see SUI most likely will hit $5.5 easily
I recommend liquidate 50% of your fund at that price then start use a trilling stop under each last new bottom for the rest of the fund
Good luck every one

SUI/USDT — Last Defense Before the Next Major Move?SUI is now approaching a critical demand zone between $1.93 – $2.40 — a region that once acted as macro resistance during its early 2024 breakout, and now serves as the final major support on the weekly structure.
After multiple failed attempts to reclaim the mid-range resistance at $3.32 – $4.30, price action has rotated downward into this yellow box — forming what could become either a springboard for a major reversal or a breakdown trigger if support fails.
---
🔹 Technical Overview
The yellow block ($1.93–$2.40) represents a long-term structural pivot — previously resistance, now retested as support.
The wick rejection from lower levels shows early buying interest and liquidity sweep below the zone.
However, momentum remains neutral to bearish until price can reclaim $3.32 on a weekly close.
---
🟢 Bullish Scenario
If SUI successfully holds above $1.93 and forms a strong weekly close above $2.40, buyers could gain control and aim for:
$3.32 → key mid-level resistance
$4.30 → previous consolidation cap
$5.25 – $5.36 → macro breakout target
A reclaim of $3.32 would confirm a potential trend reversal, shifting market structure from distribution to accumulation.
---
🔴 Bearish Scenario
If SUI breaks and closes below $1.93, the structure shifts decisively bearish.
Downside targets open toward $1.20, then $0.80 – $0.55 (prior liquidity base).
Breakdown beneath this zone would signal loss of structural support and likely trigger capitulation-type movement.
---
⚖️ Key Takeaway
SUI is at a macro decision zone — where either a long-term base forms or a deeper correction begins.
A clean weekly close and volume confirmation will define the next 3–6 month direction.
This is not a random level — this is where smart money decides who wins the next phase.
---
📊 Major Levels
Support Zone (yellow box): $1.93 – $2.40
Resistance Levels: $3.32 → $4.30 → $5.25 – $5.36
Trend Confirmation: Weekly close above $3.32 = bullish reversal
---
#SUI #SUIUSDT #Crypto #TechnicalAnalysis #PriceAction #Altcoins #SwingTrading #SupportResistance #CryptoCharts #MarketStructure #SUIAnalysis
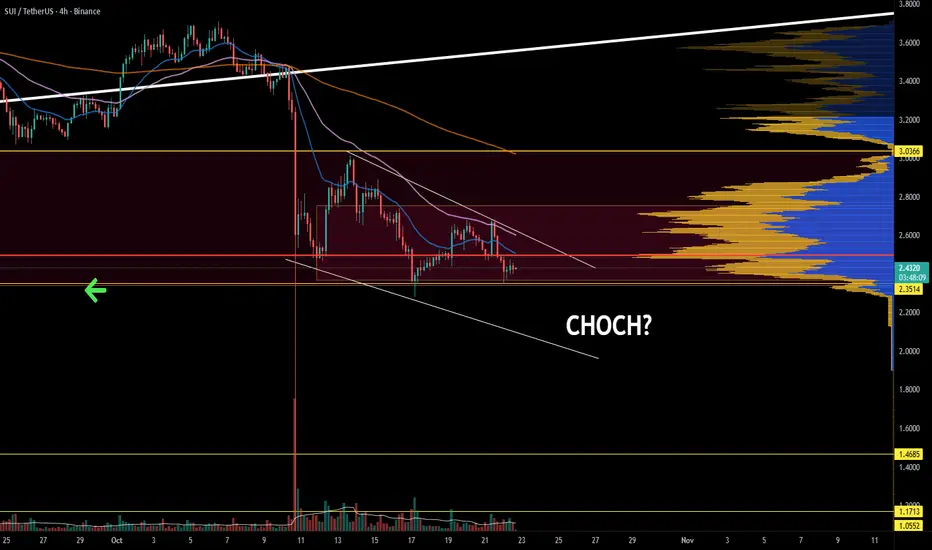
Sui back to the bottom of the range. SUI is back to the bottom of the range, which was defined as a point of interest early on. This is critical because if SUI breaks below with a sustainable move, it confirms a lower low. Dropping to the H4 allows us to look for support with a healthy invalidation. RR makes it ideal. There are signs of divergence and a decent structure. Watch list material.
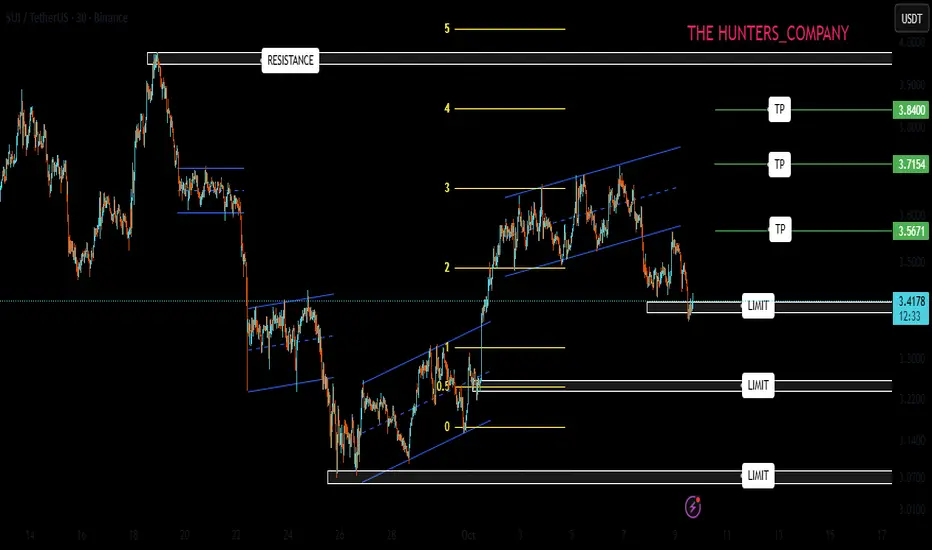
SUI/USDT ; A decline is the best buying opportunity.Hello friends
Given the price decline that we are witnessing, the price has created good channels at the specified support and buyers have entered and supported the price, which is a good sign for the currency.
Now, given the trend reversal and the price being pushed up by buyers, we can buy in steps with risk and capital management and move towards the specified targets.
We have also identified an important level that if the price reaches it, a correction can be expected and it is very important to take profits in these areas.
*Trade safely with us*
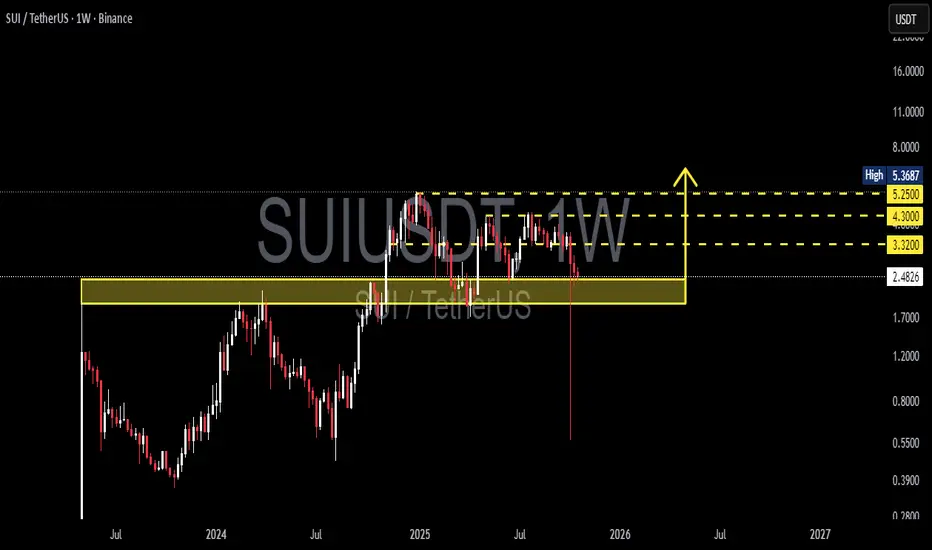
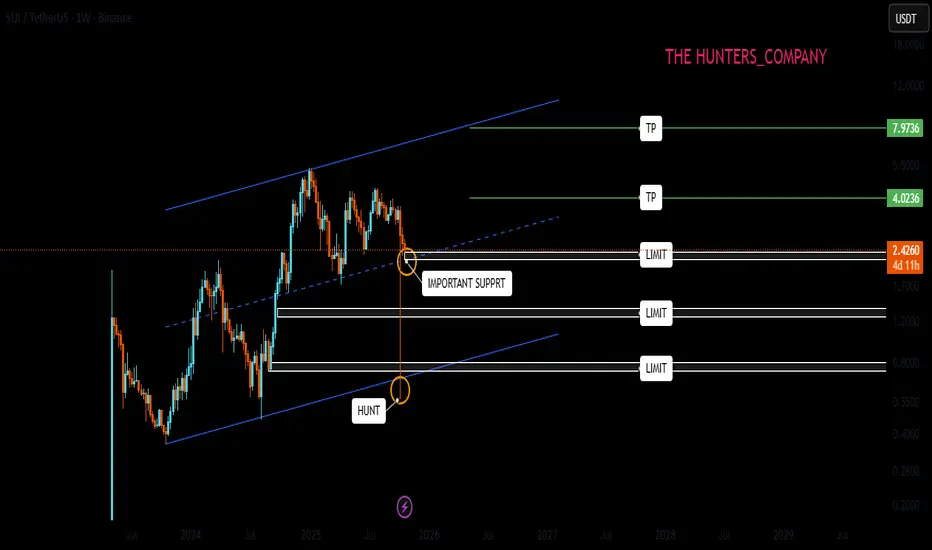
SUI ; The future of SUIHello friends
You see a long-term weekly channel that after setting a new ceiling in the weekly, the price corrected until the bottom of the channel even came below the channel, which many thought was destroyed, but the price returned and is now in an important range.
This weekly candle that guided you to the bottom of the channel is very important. There are many orders in the shadow of this candle and it is possible that the price will correct up to 50% of the shadow of the candle.
For this reason, the best way to buy is to manage risk and capital, and buy in steps in the specified areas and move with it to the set goals.
*Trade safely with us*
SUI Analysis (1H)It seems that an ABC pattern is forming on the 1-hour chart, with wave B already completed.
Wave B appears to have been a triangle.
A buy/long position can be entered on the pullback to the green zone.
The targets marked on the chart are for wave C, which is a bullish wave.
A daily candle close below the invalidation level would invalidate this analysis.
For risk management, please don't forget stop loss and capital management
Comment if you have any questions
Thank You

SUI New Update (1H)This analysis is an update of the analysis you see in the "Related publications" section
The trigger line has been broken, and the 4-hour full-body candle | which were our confirmations | have failed.
The wave B pattern has shifted from a triangle to a diametric formation, and it seems that the pattern is developing in the structure we’ve outlined on the chart.
Let’s wait and see what happens.
For risk management, please don't forget stop loss and capital management
When we reach the first target, save some profit and then change the stop to entry
Comment if you have any questions
Thank You

#SUI/USDT Bullish scenario#SUI
The price is moving within a descending channel on the 1-hour frame, adhering well to it, and is heading for a strong breakout and retest.
We have a bearish trend on the RSI indicator that is about to be broken and retested, which supports the upward breakout.
There is a major support area in green at 2.43, representing a strong support point.
We are heading for consolidation above the 100 moving average.
Entry price: 2.45
First target: 2.50
Second target: 2.55
Third target: 2.60
Don't forget a simple matter: capital management.
When you reach the first target, save some money and then change your stop-loss order to an entry order.
For inquiries, please leave a comment.
Thank you.
SUI - Oversold and Testing a Major Intersection Zone!🏹SUI has reached a critical technical intersection, where the lower boundary of the long-term channel meets the bottom of the descending red structure. Historically, this area has acted as a launchpad for reversals, with multiple reactions from the same channel base in the past.
After weeks of heavy downside pressure, SUI now looks deeply oversold, both technically and structurally. The confluence between the horizontal support zone and the diagonal trendline adds strength to this level, making it a high-probability area for a short-term relief rally.
📈As long as the price holds above this support intersection , the next potential wave could target the upper red channel first, followed by the upper blue boundary near $4.5 if momentum continues to build.
If this level breaks decisively, it would signal a structural shift — but for now, bulls still have a chance to step in from this confluence zone.
📊All Strategies Are Good; If Managed Properly!
~Richard Nasr

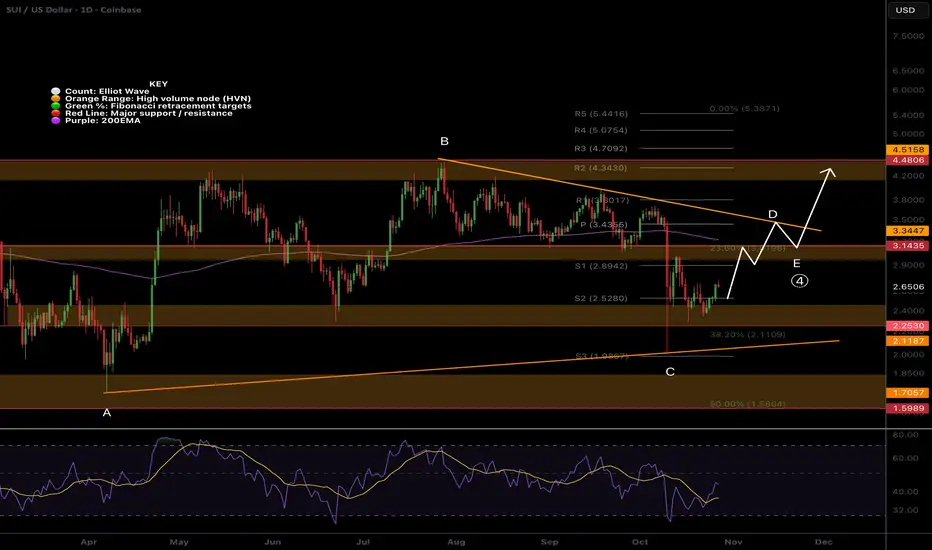
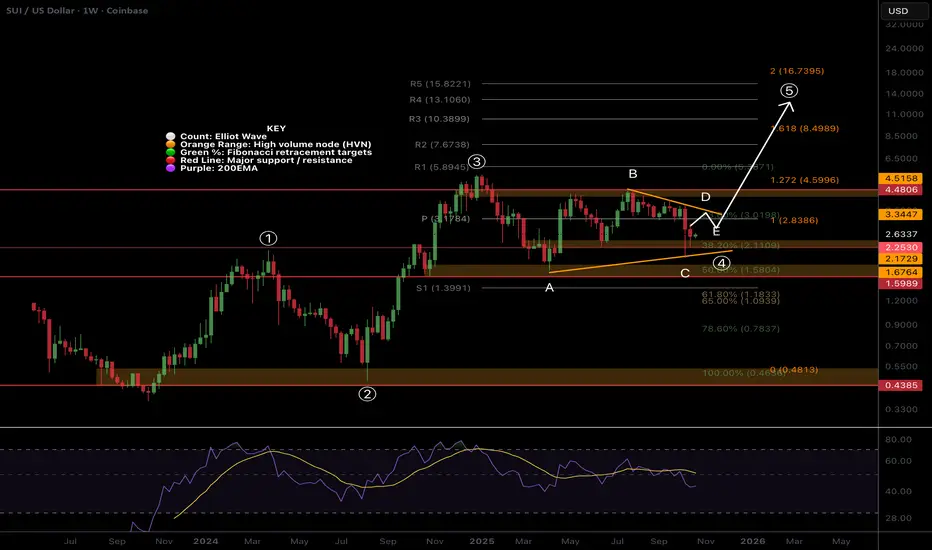
SUI Triangle macro outlookCRYPTOCAP:SUI structure, after a failed all time high, now appears to be a macro triangle in wave (4), also characterised by the long drawn out range. Wave D is underway to the triangle upper boundary with wave E expected to complete around the weekly pivot point, $3.17.
Wave (5) has a minimum target of the R5 weekly pivot at $15.8, at the 2 Fibonacci extension.
Falling below $1.7, wave A, invalidates the analysis and suggests we have much lower to go in a bear market.
Weekly RSI is bearish with lower to go but hidden bullish divergence has formed, a good raly will confirm.
SUI i holding up better than most with shallower retracements overall.
Safe trading
SUI Triangle emerged!CRYPTOCAP:SUI appears to be in a triangle wave D.
Wave b of D should complete at the High Volume Node support $2.4 before testing the upper boundary trend-line, $3.6 just above the daily 200ema.
If this is a triangle then we should see a huge breakout later in the year into price discovery similar to XRP in 2024 and that would mark the top for SUI as triangle breakouts are a terminal pattern! Targets could go as high as $15
Safe trading

#SUI/USDT Bullish scenario#SUI
The price is moving within a descending channel on the 1-hour frame, adhering well to it, and is heading for a strong breakout and retest.
We have a bearish trend on the RSI indicator that is about to be broken and retested, which supports the upward breakout.
There is a major support area in green at 2.61, representing a strong support point.
We are heading for consolidation above the 100 moving average.
Entry price: 2.81
First target: 2.96
Second target: 3.11
Third target: 3.30
Don't forget a simple matter: capital management.
When you reach the first target, save some money and then change your stop-loss order to an entry order.
For inquiries, please leave a comment.
Thank you.
