Very bearish - waiting for re-entry
Sui price action is very bearish. I am waiting for an opportunity to re-enter.
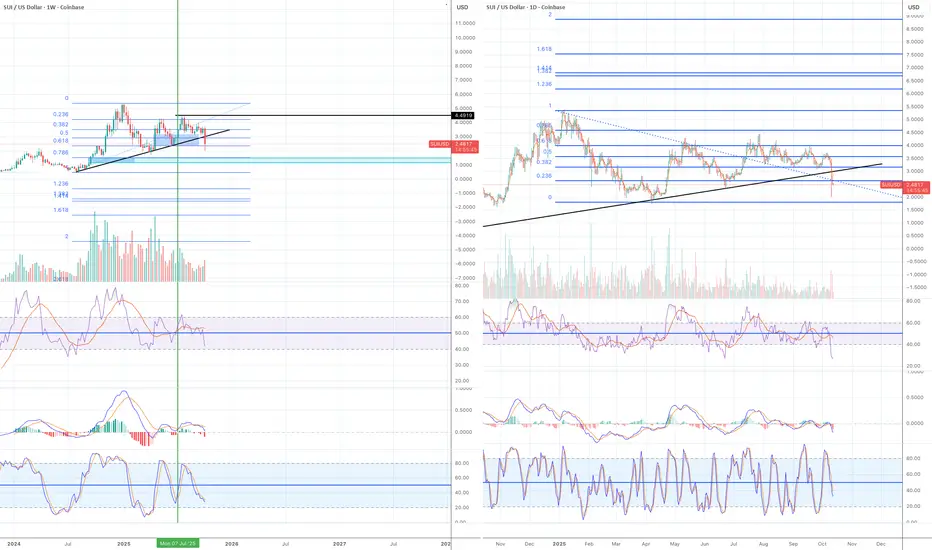
Weekly:
The price broke below the ascending support line. The current weekly candle hasn't completed yet, but a Friday daily candle broke and closed below the support line.
RSI and Stochastic have moved to the bear zone.
MACD lines have crossed to the downside and are starting to move to the bear zone.
Daily:
All momentum indicators are in the bear zone.
My plan:
There is a large unmitigated fair value gap in the $1.1-15 zone (blue rectangular box in the weekly chart).
If the price does not recover from $2.5 (Fib 0.618), it is likely to drop to 0.786 level and it is where FVG sits.
0.786 often works as the last line of defence. It the price doesn't recover from there, I won't be buying SUI.
SUI
SUI Still holding up strong!Price has still not reached the 0.5 Fibonacci retracement and appears to have been front run. Wave (4) is intact but no higher high since then is a cause for short-term concern. A triangle could be forming, or an expanded flat correction! Time will tell…
Price is below the weekly pivot, RSI is negative with room to fall and no bullish divergence forming. Further downside brings up the S1 weekly and major High Volume Node support at $1.4-1.6 range.
Wave (5) has a minimum target of the R4 weekly pivot at $13.1.
Safe trading

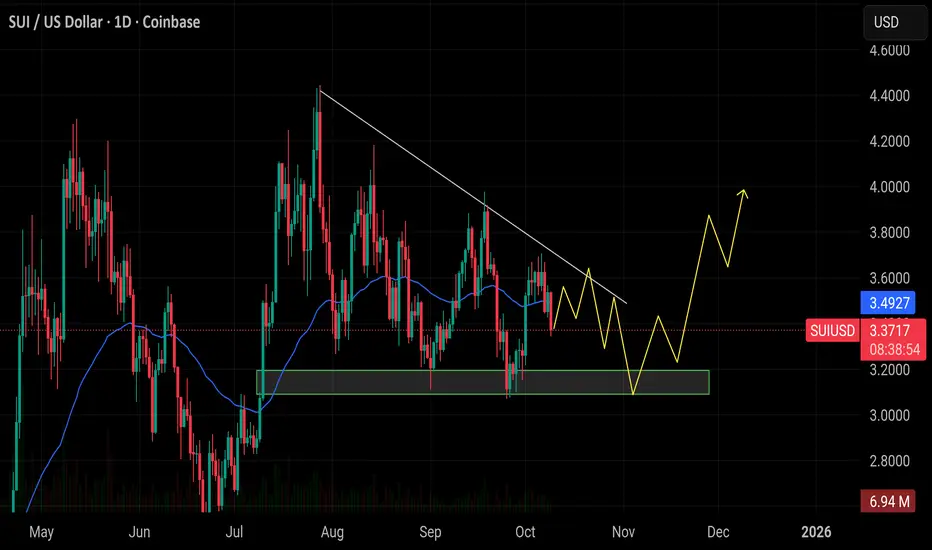
$SUI is forming a bullish structure on the daily chartCRYPTOCAP:SUI is forming a bullish structure on the daily chart, consolidating near support around $3.1. A breakout above the descending trendline could trigger a move toward the $4 zone.
SUI/USDT; BUYERS INHello friends
Given that the price has reached the specified support and the price is supported by buyers and the specified resistance has been broken, we can buy in steps with risk and capital management and move towards the specified goals.
*Trade safely with us*

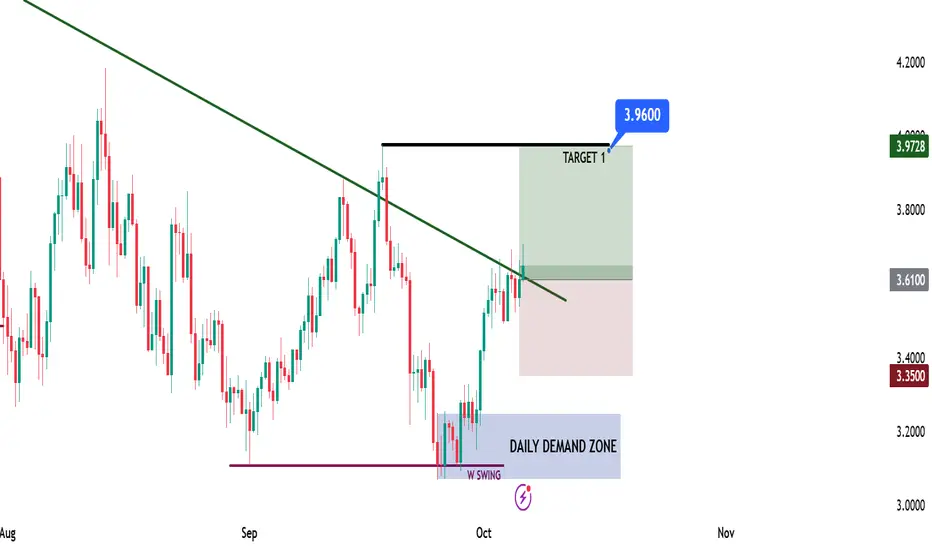
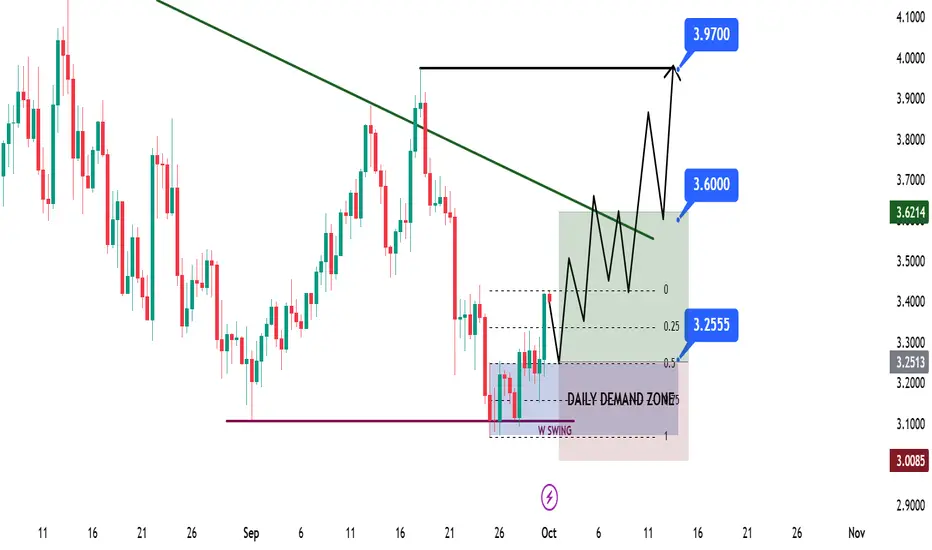
SUI Long Opportunity – DTB ModelSUI Long Opportunity – DTB Model
📊 Market Sentiment
FED has resumed its rate-cutting cycle with a 0.25% cut in September and two more expected. Institutional liquidity inflows are accelerating as the U.S. officially adopts crypto as part of its reserves. Despite persistent inflation, a weakening labor market is forcing the FED to ease, driving capital into risk-on assets like crypto.
📈 Technical Analysis
Price remains in a strong HTF bullish trend, so I’ll only be looking for long setups.
After running HTF swing liquidity, price broke structure and created a daily demand zone. The first tap to this zone generated a solid rejection, confirming its validity.
Recently, price closed above the LTF bearish trendline — signaling potential continuation for the next bullish leg.
📘 Model to be used – Demand Bounce to Trendline Break (DTB Model)
1-Identify the HTF trend and trade only in that direction.
2-Wait for a strong bounce from a confirmed demand zone.
3-Look for a break of the lower time frame bearish trendline.
4-Enter on breakout confirmation after two consecutive body closes.
📌 Game Plan
Position entered after 4H trendline break confirmation (two body closes above). Entry taken around $3.61, aligning with HTF bullish bias and demand confluence.
🎯 Setup Trigger
4H body close confirmation above bearish trendline.
📋 Trade Management
Entry: $3.61
Stoploss: $3.35
Target: $3.96
💬 Like, follow, and comment if this breakdown supports your trading! More setups and insights coming soon — stay connected!
⚠️ Disclaimer: This content is for informational and educational purposes only and does not constitute financial, investment, or trading advice. Always DYOR before making any financial decisions.
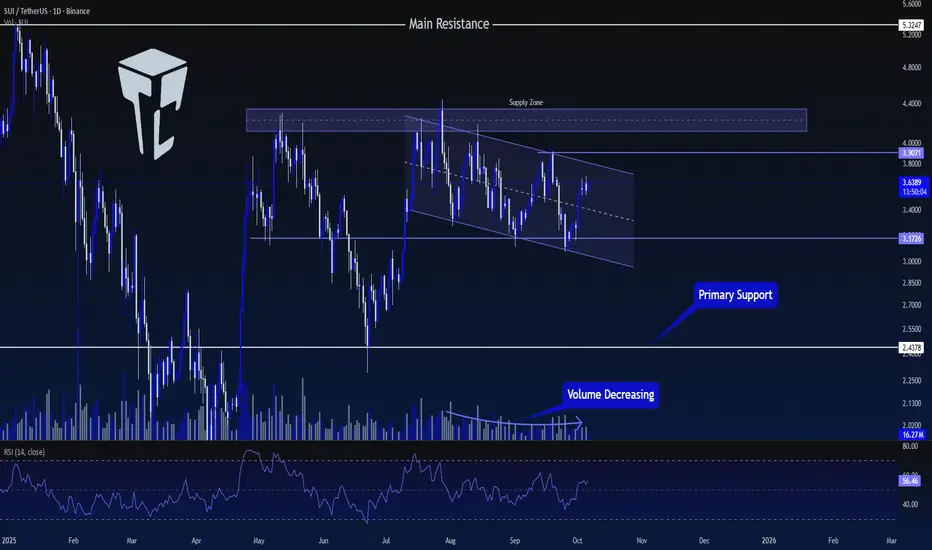
TradeCityPro | SUI: Approaching Key Breakout From Channel👋 Welcome to TradeCity Pro!
In this analysis, I want to review the SUI coin for you, one of the coins that gained significant attention in 2024 and currently ranks 14th on CoinMarketCap with a market cap of $13.22 billion.
📅 Daily Timeframe
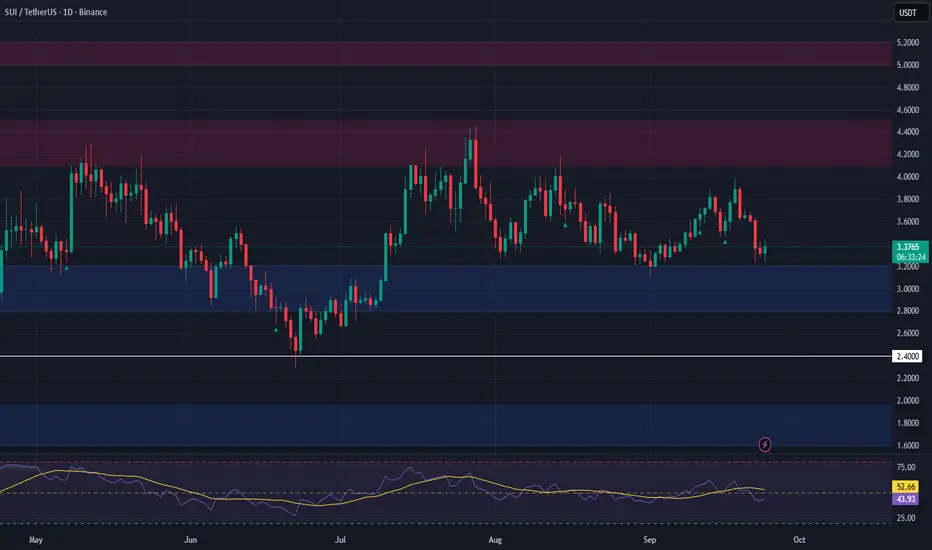
On the daily timeframe, this coin has formed a supply zone near $4, and for the past few months, the price has been struggling with it.
⭐ At the moment, after the latest rejection from this zone, a descending channel has formed, guiding the price slowly downward.
✅ The support level that the price has recently built is 3.1726, which has been tested twice, and now the price is moving toward the top of the channel.
🎲 If the channel breaks to the upside, we can consider opening a long position. The main bullish confirmation will come after breaking the upper resistance zone, but an early long position can be opened upon the breakout of 3.9071.
🔍 If the downward movement resumes and 3.1726 breaks, the move could extend to the next support area at 2.4378.
📝 Final Thoughts
Stay calm, trade wisely, and let's capture the market's best opportunities!
This analysis reflects our opinions and is not financial advice.
Share your thoughts in the comments, and don’t forget to share this analysis with your friends! ❤️
SUI - BULLS IN PLAYCRYPTOCAP:SUI - update:
Neutral on the daily & H4.
Following my previous outlook , price is consolidating nicely above the previous 50% fib level!
Hence, Im bullish above 3.4500$ support.
Price may visit the 3.720 - 3.78$ level next! 📈
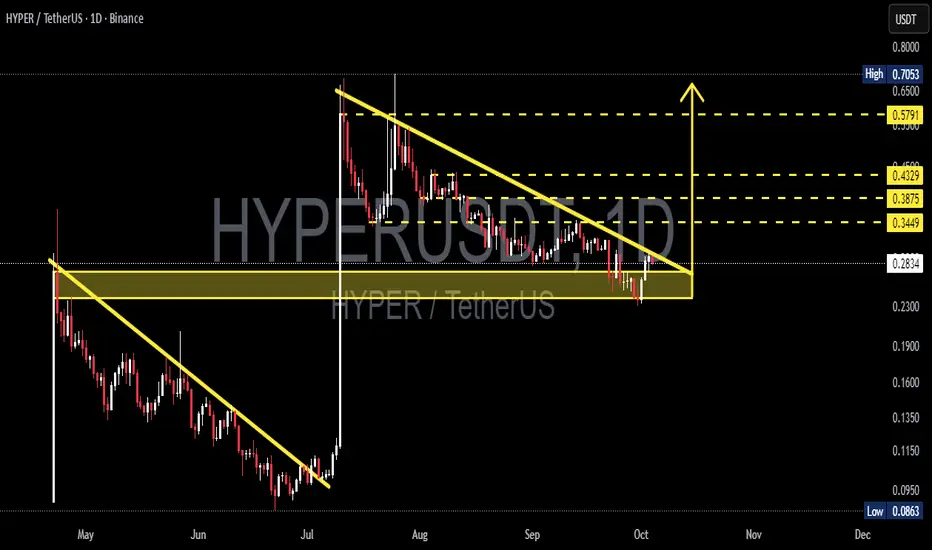
HYPER/USDT — Descending Triangle: Breakout or Breakdown?🔎 Overview
HYPER/USDT is currently trading inside a crucial consolidation zone (0.23–0.29 USDT) while being compressed by a descending trendline.
This setup forms a descending triangle pattern, typically a bearish continuation, but in some cases (especially after a strong rally), it can act as an accumulation phase before another bullish leg.
The market is now at a decision point — waiting for either a confirmed breakout to the upside or a breakdown below support.
---
📌 Pattern & Market Structure
Previous Trend: Strong pump in early July → followed by consolidation with selling pressure.
Main Pattern: Descending Triangle = flat horizontal support + descending trendline of lower highs.
Support Zone: 0.23 – 0.29 (highlighted yellow box on the chart).
Key Resistance Levels (if breakout occurs):
0.3449 → initial target
0.3875 → mid resistance
0.4329 → major resistance
0.5791 → extended target if momentum continues
Historical High/Low: High 0.7053 / Low 0.0863.
---
🚀 Bullish Scenario
1. Confirmation: A strong daily close above the descending trendline, ideally above 0.31.
2. Retest: Breakout gains strength if price retests the trendline and holds as new support.
3. Upside Targets:
TP1: 0.3449
TP2: 0.3875
TP3: 0.4329
TP4: 0.5791 (if rally extends)
4. Invalidation: A daily close below 0.23 invalidates the bullish setup.
---
🐻 Bearish Scenario
1. Confirmation: A daily close below 0.23 with strong volume confirms breakdown.
2. Downside Targets:
0.16 – 0.135 zone → historical support area
0.0863 → previous cycle low, major bearish target
3. Invalidation: If price reclaims and sustains above 0.34, the bearish outlook fails.
---
⚖️ Conclusion & Outlook
Neutral Zone: As long as price stays between 0.23 – 0.30, the market remains sideways without clear direction.
Bullish Outlook: Needs confirmation with daily close above trendline.
Bearish Outlook: Breakdown below 0.23 would shift momentum clearly bearish.
Best Strategy: Wait for confirmation on daily close & volume before entering, since descending triangles are prone to false breakouts.
---
📝 Notes for Traders
Apply strict risk management (1–2% risk per trade).
Take partial profits at each resistance level.
Focus on daily closes and volume spikes for confirmation, not intraday wicks.
---
#HYPERUSDT #Crypto #TechnicalAnalysis #Altcoin #PriceAction #ChartPattern #DescendingTriangle #Breakout #Bearish #Bullish #SupportResistance
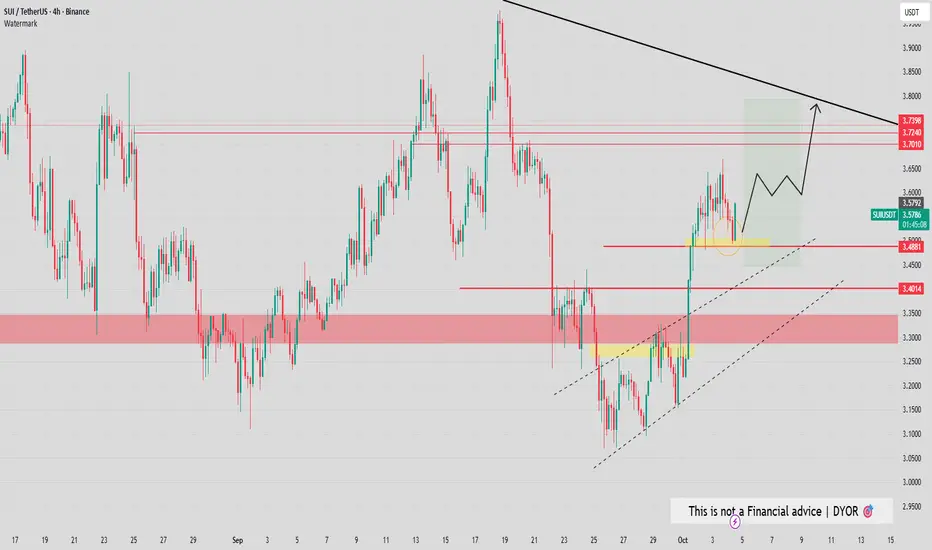
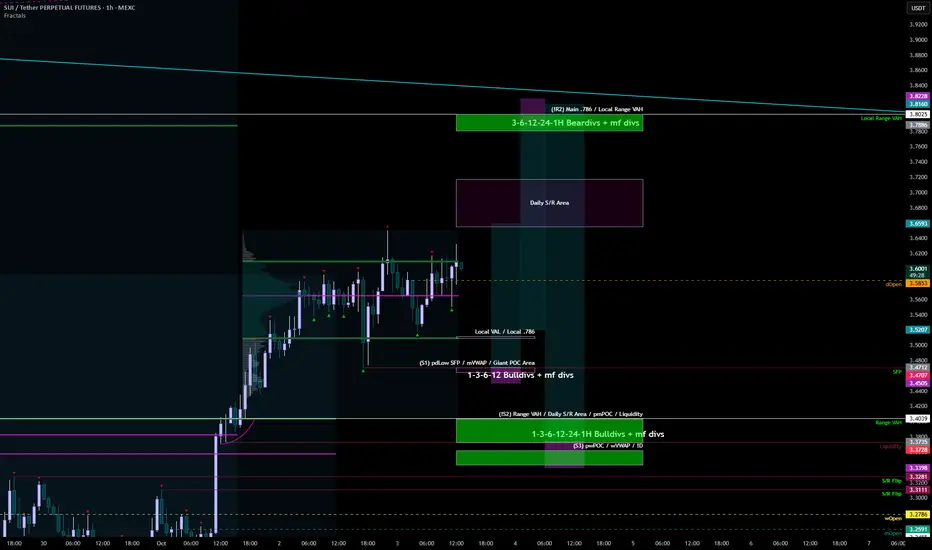
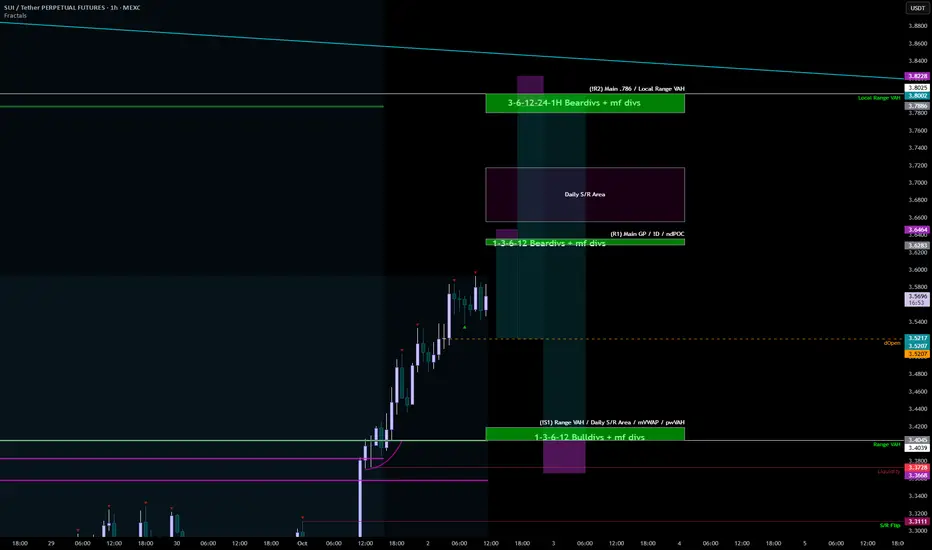
SUI 03.10R1 reacted yesterday at 10 PM, without any bearish divergences, even on LTF. We're moving in a strictly bullish direction, with the closest strong resistance already at 3.8. Locally, in theory, we could drop to S2, which we wouldn't want to lose for further growth.
Support zones:
3.465-3.47
3.403-3.372
3.343-3.362
Resistance zones:
3.78-3.8
4.05-4.1
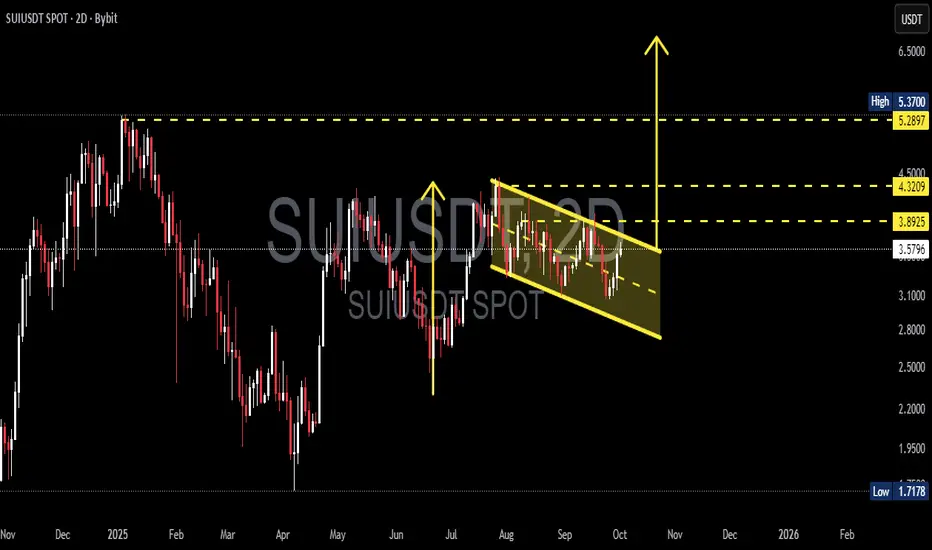
SUI/USDT — Bullish Flag, Consolidation Before the Next Rally?📌 Pattern Overview
SUI is currently forming a Bullish Flag pattern, which consists of:
Flagpole: the strong rally from June–July that pushed the price significantly higher.
Flag: a downward-sloping consolidation channel (descending channel) since August.
This pattern typically indicates a healthy pause after a strong uptrend, often followed by another bullish continuation.
---
🔍 Technical Analysis
Current Price: $3.58.
Upper flag line (resistance): around $3.89–$3.90.
Lower flag line (support): around $2.80.
Key horizontal levels: $3.89 → $4.32 → $5.29/$5.37 (previous high).
---
📈 Bullish Scenario (Valid Flag Breakout)
Confirmation: A breakout above the upper flag line with a strong 2D candle close and rising volume.
Flagpole projection target:
Previous flagpole measured from ~$2.0 → ~$5.3 = ~$3.3 move.
Breakout above ~$3.9 projects a target near $7.0 – $7.2.
Upside targets (step by step):
Target 1: $3.89 (first resistance).
Target 2: $4.32 (mid resistance).
Target 3: $5.29–$5.37 (previous top).
Extended target: $7.0 (flagpole projection).
Stop-loss: Below the breakout point or below the lower flag line (~$2.80).
---
📉 Bearish Scenario (Failed Flag)
Confirmation: Rejection at the upper flag line, or a breakdown below the channel.
Downside targets:
$2.80 (intra-flag support).
$2.20 → $1.72 (major support levels).
Extended target near $1.28 if a full breakdown occurs and the flag invalidates.
---
⚖️ Extra Confirmations
1. Volume: Breakout should be accompanied by a clear volume spike.
2. RSI: A move above 50–60 strengthens the bullish case.
3. MACD: Bullish crossover supports momentum continuation.
---
🎯 Conclusion
SUI is consolidating inside a Bullish Flag, a classic continuation pattern. A confirmed breakout could trigger a move towards $5.37, with an extended upside target near $7.0. Failure to break out, however, would bring price back to supports around $2.80 – $1.72.
Traders should wait for confirmation via candle close and volume before entering, and maintain strict risk management in case of pattern failure.
---
#SUI #SUIUSDT #Crypto #Altcoins #TechnicalAnalysis #BullishFlag #Breakout #PriceAction #CryptoTrading
SUI 02.10Just as the sol easily broke above the local overbought zone around 3.4, there was no retest, so S1 is where we can retest, and losing this support is highly undesirable for further growth. The nearest resistance zones are 3.63, 3.8, and the main resistance zone is 4.05-4.10.
Support zones:
3.40-3.42
Resistance zones:
3.628-3.635
3.78-3.8
4.05-4.1
#SUI/USDT mid-term I believe this one will pump#SUI
The price is moving within a descending channel on the 1-hour frame, adhering well to it, and is heading for a strong breakout and retest.
We have a bearish trend on the RSI indicator that is about to be broken and retested, which supports the upward breakout.
There is a major support area in green at 3.27, representing a strong support point.
We are heading for consolidation above the 100 moving average.
Entry price: 3.30
First target: 3.38
Second target: 3.46
Third target: 3.56
Don't forget a simple matter: capital management.
When you reach the first target, save some money and then change your stop-loss order to an entry order.
For inquiries, please leave a comment.
Thank you.

SUI: Alternative Scenario in Play as SUI Breaks Key SupportSUI has continued its downward trend since our last update, breaking below the $3.11 support level and triggering our alternative scenario. As a result, we now place the altcoin in the beige wave (C). We primarily expect this downward wave to drive price lower, with a bottom likely to form within the green long Target Zone between $2.76 and $2.30. This low should also mark the end of the larger wave 2 in bright green, which we had previously considered finished. From this price range, we anticipate a new upward impulse: green wave 3 is expected to push the coin above resistance at $4.44. Accordingly, prices within this zone could be considered for long entries.

SUI Swing Long Opportunity - HDDZ Model SUI Swing Long Opportunity – HTF Demand w/ Discount Zone (HDDZ Model)
📊 Market Sentiment
FED has resumed its rate-cutting cycle, starting with a 0.25% cut in September, with two more expected. Institutional liquidity inflows have accelerated as the U.S. officially adopts crypto as part of its reserves. Despite elevated inflation, a weakening labor market is forcing the FED to ease, pushing more capital into risk-on assets.
📈 Technical Analysis
SUI is bullish on HTF, so only long setups are considered. Price recently swept the weekly swing liquidity and closed above, then broke market structure on LTF — confirming bullishness and creating a valid Daily Demand zone. Price has already tested this zone once and found rejection, validating its significance.
Currently, price is rejecting from the bearish LTF trendline above, which remains a key resistance. A retest of the confluence at 3.25$ (Daily Demand + Discount Zone) offers a strong setup for continuation higher.
📘 Model to be used – HDDZ (HTF Demand w/ Discount Zone)
In this model, I first confirm HTF bias. Then, I look for creation of HTF Demand zones. Finally, I use Fibonacci retracement to locate the discount zone. When both the demand zone and discount zone align, it creates a strong confluence for trade entries.
📌 Game Plan
1-Wait for price to revisit 3.25$ confluence zone.
2-Carry trade toward bearish LTF trendline, securing profits early if price rejects.
🎯 Setup Trigger
Entry confirmation once price hits 3.25$.
📋 Trade Management
Stoploss: 2.97$
Targets:
TP1: 3.61$
TP2: 3.97$
After TP1, move SL to breakeven to secure the position.
💬 Like, follow, and comment if this breakdown supports your trading! More setups and insights coming soon — stay connected!
⚠️ Disclaimer: This content is for informational and educational purposes only and does not constitute financial, investment, or trading advice. Always DYOR before making any financial decisions.
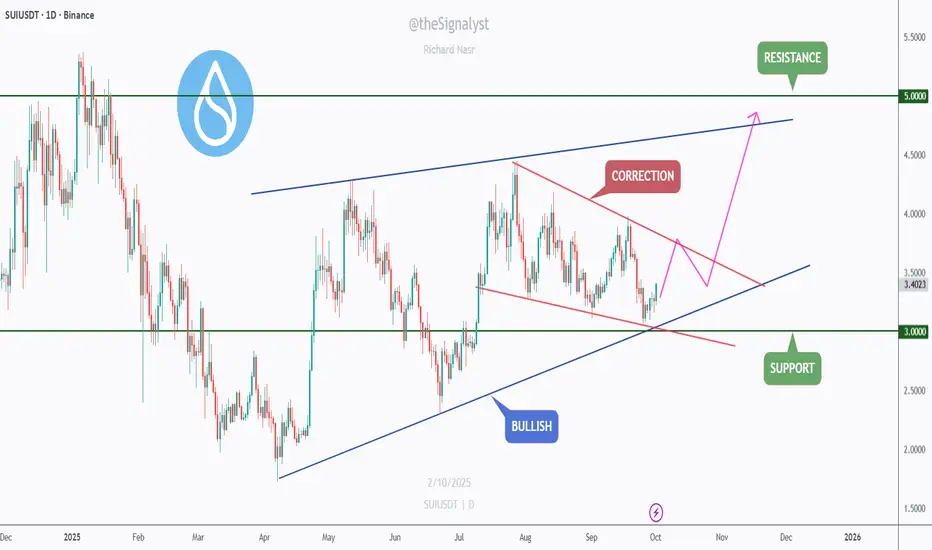
$SUI - Correction within an Uptrend: Eyes on $3.0 → $5.0SUI is respecting a broader rising structure while carving a descending correction (red channel/wedge) on the daily.
Price just bounced from the trendline + $3.00 support, a clean confluence area where bulls typically reload.
Trend context: Macro higher-lows intact (bullish). Micro still corrective until the wedge breaks.
Key levels
Support: $3.00 (structure + rising trendline)
Resistance: $3.55–$3.60 (wedge cap / first hurdle), then $5.00 (major ceiling)
Confluence 🔑
Rising blue trendline + horizontal $3.00 + corrective wedge = high-interest decision zone.
Scenarios
Bullish 📈Hold $3.00 and break above $3.55–$3.60 → momentum extension toward $4.20–$4.50, then the $5.00 range high.
Bearish 📉Daily close below $3.00 → risk of a deeper pullback before the uptrend resumes.
Do you think SUI clears the wedge on this attempt, or does it need one more higher-low above $3 first? 🤔
⚠️ Disclaimer: This is not financial advice. Always do your own research and manage risk properly.
📚 Stick to your trading plan regarding entries, risk, and management.
Good luck! 🍀
All Strategies Are Good; If Managed Properly!
~Richard Nasr
SUI — Critical $3 ZoneSince completing its 5-wave impulse on July 28, SUI has been in a corrective phase for the past two months. The structure remains clean, with invalidation zones well-defined.
Looking ahead, there’s potential for an ascending triangle formation but for that to play out, it’s crucial that SUI holds the $3 psychological level.
Support Zone ($3.11–$2.93)
0.618 Fib retracement: $3.115
0.702 Fib retracement: $2.934
60 Weekly EMA $2.93 / SMA $3.036
Potential ascending triangle lower support line
📌 This is the last key support zone for bullish momentum. Losing it would break structure, holding it keeps the bullish case alive.
Resistance Zone ($4.12–$4.59)
Yearly Open (yOpen): $4.122 → key level bulls must reclaim
Swing Highs: $4–$4.5
0.786 Fib retracement: $4.59
15B Market Cap: $4.2
This area is loaded with resistance confluence and will act as the major target zone for longs.
🟢 Long Setup
Entry Zone: Between current price and $2.9 → ladder down into support
Stop-Loss: Below 0.702 Fib retracement
Take Profits: TP1 → $3.49, TP2 → $3.89, TP3 → $4.12 (yOpen)
R:R: ~1:4+
Potential Gain: +35%
This is a make-or-break zone for SUI. The $3 level is stacked with support confluences and must hold to keep the bullish structure intact. If bulls reclaim the yearly open at $4.122, momentum could carry toward $4.6.
🔍 Indicators used
DriftLine — Pivot Open Zones → For identifying key yearly/monthly/weekly/daily opens that act as major S/R reference points
Multi Timeframe 8x MA Support Resistance Zones → to identify support and resistance zones such as the weekly 60 EMA/SMA.
Fair Value Trend Model → Calculates a regression-based fair value curve
➡️ Available for free. You can find it on my profile under “Scripts” and apply it directly to your charts for extra confluence when planning your trades.
_________________________________
💬 If you found this helpful, drop a like and comment!

SUI 29.09Currently, it's hovering in the local neutral zone between the important resistance of 3.27-3.3 and 3.17-3.2. The only coin in my TDA toolkit that I believe hasn't reached the crucial zone around $3.00 and has reversed, also leaving a ton of liquidity.
Main trading zones: Longs S1, S3, S4 and Shorts R3, R4. The rest are scalps based on the situation.

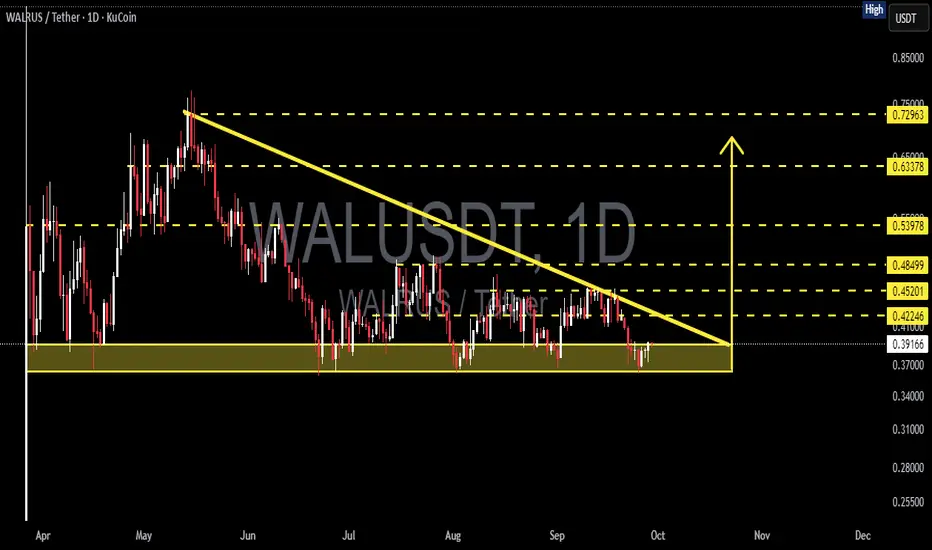
WALRUS/USDT – Descending Triangle at Critical Support!WALRUS/USDT is currently trading within a descending triangle pattern on the daily timeframe. This structure is formed by a series of lower highs pressing from above (descending trendline), while the 0.36–0.40 support zone (yellow box) acts as a major floor below.
This highlights strong selling pressure from the top, but at the same time buyers are still holding the support area. The price is now consolidating within a narrowing range, waiting for a decisive breakout that will dictate the next big move.
---
Bullish Scenario (Upside Breakout)
If WALRUS can break above the descending trendline with a daily close above 0.422–0.452, this descending triangle may flip into a bullish reversal. That would signal buyers regaining control.
Bullish Targets:
Target 1: 0.485
Target 2: 0.539
Target 3: 0.633 – 0.729 (if momentum continues strongly)
Validation: breakout with high volume + successful retest of breakout level as support.
---
Bearish Scenario (Downside Breakdown)
If WALRUS closes daily below 0.36, the descending triangle will confirm as a bearish continuation. This shows sellers overwhelming buyers at support.
Bearish Targets:
Target 1: 0.31 – 0.30
Target 2: 0.255 (long-term demand zone)
Validation: strong bearish daily close with volume, without quick recovery above 0.36.
---
Pattern & Interpretation
The descending triangle often acts as a bearish continuation pattern.
But in strong support zones, it can turn into a reversal pattern if an upside breakout occurs.
WALRUS is at a decision point: the tighter the consolidation, the bigger the potential explosive move once a breakout happens.
---
Conclusion
Bias: Neutral → Bearish as long as WALRUS remains below the descending trendline.
Bullish confirmation: daily close above 0.422–0.452 → potential rally to 0.485 – 0.539.
Bearish confirmation: daily close below 0.36 → possible drop to 0.31 and 0.255.
Traders should wait for volume-backed breakout confirmation before positioning. WALRUS is now at a make-or-break level: will it bounce or break?
---
#WALRUS #WALRUSUSDT #CryptoAnalysis #TechnicalAnalysis #DescendingTriangle #Breakout #SupportResistance #PriceAction
SUIUSDTThe overall trend is bearish BINANCE:SUIUSDT , but the 2.90 USD area seems to be a crucial level for a potential trend reversal, with a possibility of price bouncing back. The price is currently near the initial support at 2.92 USD, and it is likely to move upwards in reaction to this level. A buy signal is triggered at 2.9264 USD with a stop loss at 2.77 USD. The next price targets are 3.250 USD, 3.600 USD, 3.800 USD, and 4.28 USD.
📈 Buy Signal: Entry at 2.9264 USD
🚫 Stop Loss: 2.77 USD
🎯 Targets: 3.250 USD | 3.600 USD | 3.800 USD | 4.28 USD

Is the SUI / SOL ratio forming a cup and Handle?Key Takeaways of a Cup and Handle:
The cup and handle pattern represents a bullish technical price formation that manifests on a price chart as a cup accompanied by a handle, indicating a possible buying opportunity.
This pattern generally develops over a span of seven to 65 weeks and is defined by a "U" shaped cup followed by a handle that slopes downward.
In order to trade the cup and handle pattern, traders may opt to place a stop buy order just above the upper trend line of the handle or wait for the price to close above it, establishing a profit target based on the height of the cup.
Instances such as Wynn Resorts illustrate how a properly formed cup and handle pattern can lead to substantial price movement once the pattern is validated and the resistance level is breached.
However, limitations include the duration required for the pattern to form and the variability in the depth of the cup, necessitating its use in conjunction with other signals and indicators.

SUI Swing Trade Setup – Accumulation at Key SupportSUI has retraced to a major support zone, presenting a potential long swing setup. Price action is showing signs of a possible base, with another dip into early September likely before a reversal.
The strategy here is to ladder into long positions between $2.80–$3.20, aiming for a bounce toward previous resistance zones. Risk is managed with a tight invalidation below the last major support.
• Entry Zone: $2.80–$3.20
• Targets: $4.10–$4.50, $5.00–$5.20
• Stop Loss: Below $2.40
SUI Game Plan - Suinetwork📊 Market Sentiment
Market sentiment remains strongly bullish as the FED is expected to deliver a 0.25% rate cut, with speculation building for a possible 0.5% cut in September. Monetary policy shifts are being driven by both inflation trends and weakening labor market data. The latest August and September job reports were soft, signaling that the economy is cooling rapidly. This environment continues to fuel expectations for a major bullish run in the weeks ahead.
📈 Technical Analysis
Price is on HTF bullish trend so we will be looking only long setups.
Price ran HTF liquidity and closed above then broke the market on daily-weekly timeframe, creating the Daily Demand Zone.
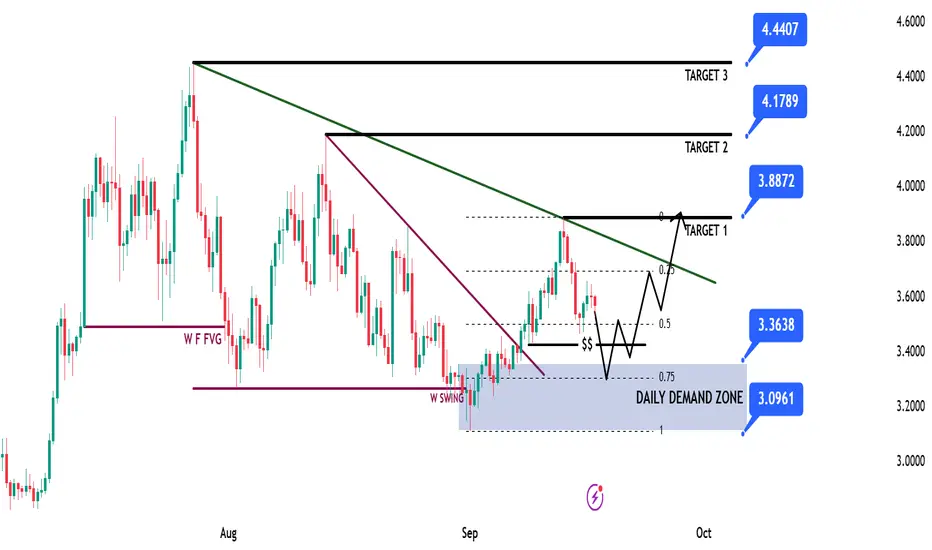
Moreover, price broke the bearish trendline and closed above, giving strong upward momentum. Now price is retracing back into the Daily Demand Zone.
📌 Game Plan
1-Price to hit back to Daily Demand Zone
2-Price to hit possibly 0.75 max discount range zone. If not, I’ll still enter with LTF confirmation.
🎯 Setup Trigger
4H break of structure after hitting 3.36$ level. I won’t enter unless I see the 4H BOS.
📋 Trade Management
Stoploss: Below 4H swing low responsible for BOS
Targets:
TP1: 3.88$
TP2: 4.17$
TP3: 4.44$
💬 Like, follow, and comment if you find this setup valuable!
⚠️ Disclaimer: This content is for informational and educational purposes only and does not constitute financial, investment, or trading advice. Always DYOR before making any financial decisions.
SUI/USDTBINANCE:SUIUSDT has dropped right to the intersection of its ascending support and horizontal support zone.
This is a key demand area where buyers could step in and take control.
As long as SUI stays above $3.11, there’s no major concern yet.
I’ll update if needed.
