My goal is to acquire SUI at the most favorable priceHello, friends!
I want to share with you updates regarding my previous review, where I compared two cryptocurrencies - Aptos and SUI. Today, I have made the decision to place a limit order for a minimum price update.
What does "limit order for a minimum price update" mean? It means that I plan to make a purchase at a price lower than the current market price. This approach allows me to execute a buy order when the price reaches a specific level that is advantageous for me.
My goal is to acquire SUI at the most favorable price ✌🏻
SUI

SUI Created a Rising wedge, Bearish breakout formed.SUI has formed a rising wedge pattern, indicating a potential bearish breakout. Traders and investors should be on the lookout for a downward swing in price, which could lead to a retracement of approximately 50% to 61% on the Fibonacci retracement levels. This retracement is expected to occur around the price level of $0.71.

SUI SUIUSDT Price Analysis (8h)SUIUSDT has been displaying a rising channel pattern since mid-June. However, there are some indications that the momentum is weakening, as observed from the MACD histogram chart.
We should exercise caution as there is a possibility of the price breaking below the support of the rising channel.
Key Support Levels:
0.76
0.71
It is important to be extra careful if you are currently holding SUI.
Despite the potential downside risk, let's explore the levels that could be reached during the movement inside the channel.
There are a few Key Resistance levels to watch:
0.92
0.98
1.03
1.08
Monitor the price action closely and stay vigilant. Remember to manage your risk accordingly.
Happy trading, and may the markets be on your side!

$SUI to 1.09$ ?👑 #SUI/USDT BUY 👑
Entry:
1.07127✅
Targets:
1️⃣0.8179🎯
2️⃣0.8978🎯
3️⃣0.9778🎯
4️⃣1.0916🎯

SUIUSDT⚠️ "Daily crypto market analyses I provide are personal opinions & not financial advice. Trading carries risks, so do your own research & seek advisor's help."

SUIUSDT.1DHello dear friends,
*Mars Signals Team wishes you high profits*
This is a one day time frame analysis for SUIUSDT.1D
We are in the daily time frame. As you can see, the price above our four-hour support zone is fluctuating and moving towards our first resistance line.
There are two scenarios that we will review together.
First scenario: we expect the price to reach its first resistance line, and if the momentum stabilizes above the resistance line, we can expect the price to fall to its first support zone, and if the first support zone does not support the price, to the second support line. start moving
Second scenario: if the price can stabilize above its second resistance line, we can expect to climb up to the next resistance zone.
Warning: This is just a suggestion and we do not guarantee profits. We advise you to analyze the chart before opening any positions.
Take care

SUI price. What are the prospects: buy, sell or wait?Hype project SUI
Please write in the comments why it is interesting to you?
Currently, 6% of the maximum possible number of coins are circulating on the market.
On the one hand, while the number of coins on the market is still small, it is cheaper to organize a "pump".
On the other hand, when many coins are put on the market, there will be a lot of pressure on the price.
This is the basis of the "law of supply and demand".
The unlocking schedule:
- early July +0.6%.
- beginning of August +0.7%
- beginning of September +0.7%
- beginning of October +0.8%
- beginning of November +22%
In other words, theoretically, the highest chance of a pump in the SUI price is before November 2023.
But first, two obstacles need to be overcome:
the trend line of recent months is around $0.90
a powerful liquidity zone of $1-1.20, where a month ago users were actively buying SUI in anticipation of growth, but the SUIUSDT price had other plans and dropped by more than 2 times. Therefore, it is very likely that there will be active sales in this liquidity zone by those who want to "break even", as human psychology works.
Based on the above assumptions, "the active pumping" of the SUIUSD price has a chance to develop only after the price is firmly established above $1.20
_____________________
Did you like our analysis? Leave a comment, like, and follow to get more

SUI VS AtopsFriends, hello everyone! I noticed an interesting similarity between two assets - SUI and Atop. After the decline, both assets experienced approximately a 70% loss. However, if we look at APT, we can observe an intriguing pattern - it showed a decline, followed by a minor correction, a final impulse (where the best entry point was), and a 400% increase.
Now, as SUI has undergone a decline, we are observing a slight correction, after which we expect a final impulse and further growth.
It's fascinating to see what will happen with these assets going forward! Let's keep an eye out for updates.

Sui To Bounce Suiusdt
Breakdown was confirmed as I mentioned in previous idea
Now i am expecting a bounce from this zone 0.60- 0.55
I am expecting 25-35% Bullish move soon
Let's see
Not financial advice

SuiConsidering that this currency has been destroyed, it should be checked for purchase in the desired areas

Hi, I see A very good Swing trade opportunityHi, I see A very good Swing trade opportunity
Risk Reward is very good
good luck

SUIUSDT is ready!⚠️ "Daily crypto market analyses I provide are personal opinions & not financial advice. Trading carries risks, so do your own research & seek advisor's help."

SUI target 1.25 and 2.84h time frame
-
SUI is going to break out this wedge.
Good plan can be set now.
Target: 1.25, 2.8
SL: 0.9

Sui Scam or No?We have a clear structure. Trade inside the lines with a stop 2% above/below.
When it breakeouts, enter trade depending where it broke. The 5-8% range inside the structure is good for grid spot.

SUIUSDT SETUPSUIUSDT price trading in a channel and trying to create a local bottom. We may see an upside toward its recent high if the Bulls pull back the momentum. So trade accordingly.

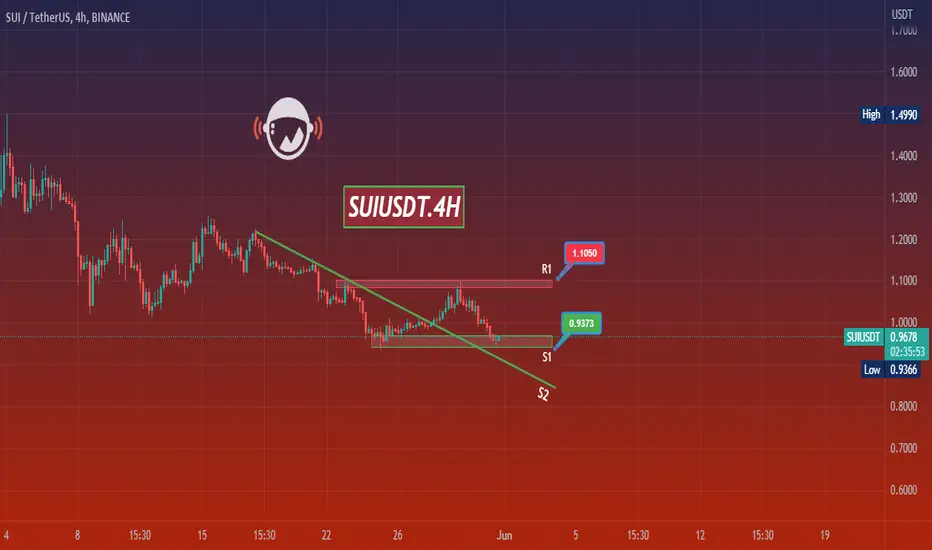
SUIUSDT.4HHello dear friends,
*Mars Signals Team wishes you high profits*
This is a time frame analysis for SUIUSDT.4H
We are in daily time returns. As you can see, the price is on our first support line, our second support zone can be a good area to buy, if it can become supportive after hitting our second support zone and we can see the reversal patterns, we can enter the trade for the first resistance zone.
Warning: This is just a suggestion and we do not guarantee profits. We advise you to analyze the chart before opening any positions.
Take care
Sui More PainSuiusdt
Breakdown already confirmed retest is in process incase of again rejection expecting 10-20% drop
Dyor

Possible long here on SUIA possible scenario for SUI USDT if we manage to break here. RSI looks good, targets and SL in place (I give more space for the SL, in many of my setups it was too tight and it got hit and then the price when in the right direction). NFA!

sui is also ready sui coin is very close breakout bullish triangle and ready to fly. And its also in golden zone fibbonacci numbers.

Hi, I see A very good Swing trade opportunityHi, I see A very good Swing trade opportunity
Risk Reward is very good
Good luck every one

SUIHello everyone! I would like to share my thoughts on the current market situation. Recently, I noticed a support zone and identified a descending wedge formation on the chart. For me, this is a positive signal as I can see that the support level has been successfully breached.
I have decided to take this coin on the spot as I consider it promising. However, due to the unfavorable market conditions, it has been heavily sold off. This has had a negative impact on its price.
I believe that despite the temporary difficulties, this coin has potential. Therefore, I have decided to acquire it, hoping for positive changes in the future. I will be monitoring the developments and making appropriate decisions.

SUI broke descending channel support#SUI broke descending channel support and currently retesting
use proper risk management

SUI SUIUSDT Price analysis (1h)Greetings, fellow traders! In this article, we will delve into the price analysis of SUIUSDT
Consolidation and Support Level:
SUIUSDT has been exhibiting a consolidation pattern in recent trading sessions, indicating a temporary pause in the market before the next price movement. During this consolidation, the price has shown respect towards a significant support level at $1.03. The repeated bounces off this level suggest that it holds strong buying interest and could potentially act as a launchpad for an upward move.
Potential Rebound and Target Levels:
Considering the respect shown to the $1.03 support level, it is quite likely that we may witness a rebound from this level towards the descending resistance line. With target levels at $1.08, $1.09, $1.10, and $1.11. These levels represent potential resistance areas where the price might encounter selling pressure.
Risk Management and Stop Loss Order:
While a rebound from the support level is anticipated, it is essential to manage risk effectively. Please remain cautious of a potential breakout below the $1.03 support level. To protect from potential losses, it is advisable to set a stop loss order at an appropriate level below the support, ensuring that any downside movement is limited.
The Relative Strength Index (RSI) is currently showing a bullish divergence for SUI. It's important to note that this divergence is primarily visible on the 1-hour timeframe, which may not carry as strong of a signal as if it were observed on higher timeframes.
Bullish divergence occurs when the price of an asset forms lower lows while the RSI indicator forms higher lows. This suggests a potential reversal in the downward momentum and a possible upcoming price increase. However, the strength and reliability of this signal are generally more significant when observed on longer timeframes.
📣 We would love to hear your feedback in the comments section! What are your thoughts on the analysis of SUI's bullish divergence on the 1-hour timeframe? Do you agree that it may not carry as strong of a signal compared to higher timeframes?
Share your insights and experiences with us. We value your input! 🙌
