BLUEFIN $BLUE a SUI DEXWhich riding on the back of a succesful SUI bullrun could and full blown alt coin bull market, it should make a new ATH..
Along the way the log tgt and resistance zone need to be met and overcome ofc.
#DoubleBottom
SUI

#SUI/USDT mid-term I believe this one will pump#SUI
The price is moving in a descending channel on the 1-hour frame and is expected to break and continue upward.
We have a trend to stabilize above the 100 moving average once again.
We have a downtrend on the RSI indicator that supports the upward move with a breakout.
We have a major support area in green that pushed the price higher at 3.62.
Entry price: 3.70.
First target: 3.75.
Second target: 3.82.
Third target: 3.90.
To manage risk, don't forget stop loss and capital management.
When you reach the first target, save some profits and then change the stop order to an entry order.
For inquiries, please comment.
Thank you.

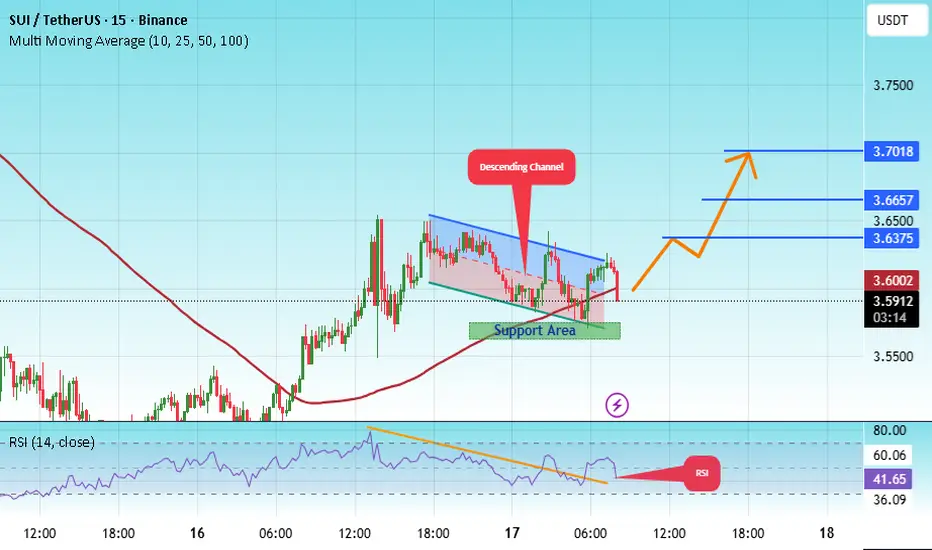
#SUI/USDT bullish structure formed at the chart#SUI
The price is moving within a descending channel on the 1-hour frame, adhering well to it, and is heading for a strong breakout and retest.
We have a bearish trend on the RSI indicator that is about to be broken and retested, which supports the upward breakout.
There is a major support area in green at 3.56, representing a strong support point.
We are heading for consolidation above the 100 moving average.
Entry price: 3.60
First target: 3.64
Second target: 3.66
Third target: 3.70
Don't forget a simple matter: capital management.
When you reach the first target, save some money and then change your stop-loss order to an entry order.
For inquiries, please leave a comment.
Thank you.
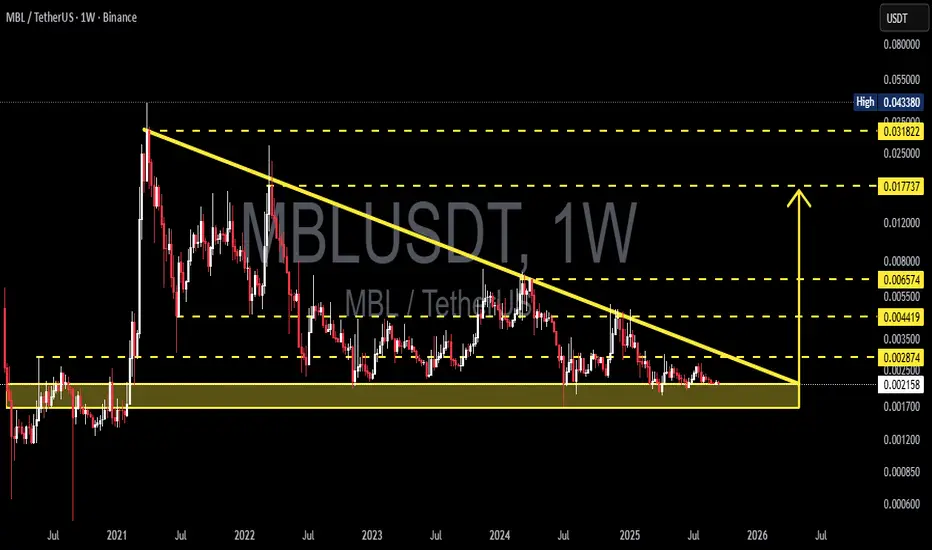
MBL/USDT — Descending Triangle: Breakout or Breakdown Ahead?🔎 Detailed Analysis
The MBL/USDT pair on the weekly chart is currently in a long-term price compression phase. The structure forms a Descending Triangle, characterized by:
Consistent lower highs along a long-term descending trendline (since 2021).
A strong horizontal support zone at 0.0017 – 0.0023 USDT (yellow box).
Price action consolidating into the triangle apex, suggesting a potential major breakout or breakdown in the coming weeks/months.
This pattern has been building for over 3 years, which makes any confirmed breakout highly significant.
---
📈 Bullish Scenario
Confirmation: A weekly close above the descending trendline and pivot level at 0.002874 USDT, supported by strong volume.
Retest: A successful retest of the breakout level turning into support strengthens the case for upside continuation.
Bullish Targets:
Target 1: 0.004419 USDT (nearest resistance).
Target 2: 0.006574 USDT.
Extended Target: 0.0177 – 0.0318 USDT if broader altcoin momentum strengthens.
✨ If this bullish breakout occurs, it could mark the beginning of a major reversal after years of consolidation.
---
📉 Bearish Scenario
Confirmation: A weekly close below the 0.0017 USDT support zone with strong bearish follow-through.
Implication: A breakdown of this historical support could open the door to much lower levels (sub-0.001), with an extreme projection toward 0.0006 USDT.
Note: Descending triangles often resolve bearishly in textbook cases, but in crypto they can also serve as accumulation zones before explosive rallies.
---
🛡️ Risk Management
Avoid entering positions solely because the price “looks cheap” — wait for clear confirmation.
Always set a Stop Loss below support (for longs) or above invalidation (for shorts).
Manage position sizing carefully → high reward potential but also high risk.
Use indicators (RSI, MACD, Volume) to confirm momentum shifts.
Weekly close is the strongest signal — avoid acting on intraday noise.
---
⏳ Timeframe & Potential
As this is a weekly timeframe pattern, confirmation may take several weeks to months.
The closer price gets to the triangle apex, the more explosive the breakout is likely to be.
Broader altcoin market sentiment will strongly influence which direction this resolves.
---
✨ Conclusion
MBL/USDT is at a critical crossroads:
Holding the 0.0017 – 0.0023 support and breaking the descending trendline could trigger a multi-fold rally.
Losing this support zone could lead to a sharp drop into uncharted sub-0.001 territory.
📍 This setup is highly attractive for swing traders and mid-to-long term investors waiting for a major move after extended consolidation.
---
#MBL #MBLUSDT #Crypto #Altcoins #TechnicalAnalysis #DescendingTriangle #Support #Breakout #Bullish #Bearish
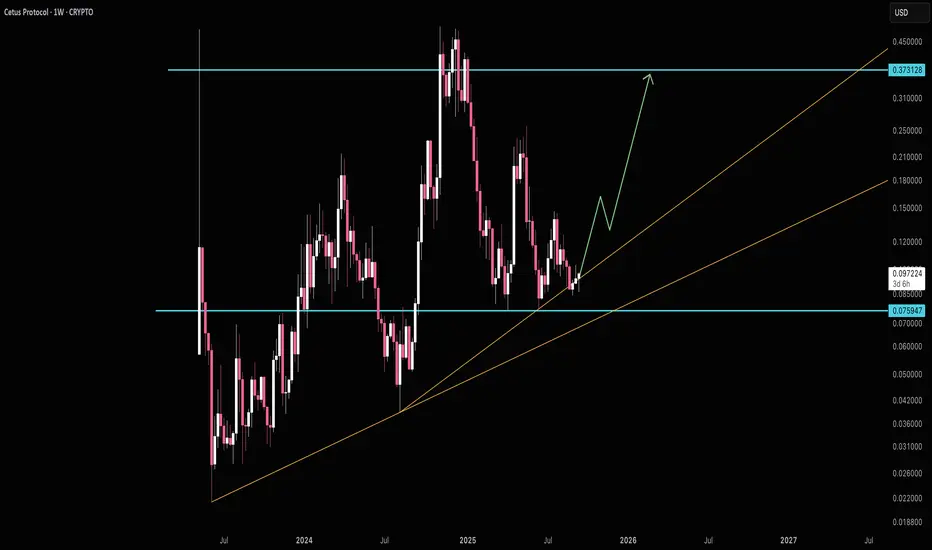
An interesting setup for Small Risk/Big RewardCetus is looking very interesting to me. I took a position here hoping for big upside. If you're not aware Cetus is a DEX on Sui network. The CETUS token can be staked and yeilds a return of the DEX fees. That upper 0.373 area has been resistance a few times now and I'm speculating it'll target that area once again.
Good luck!
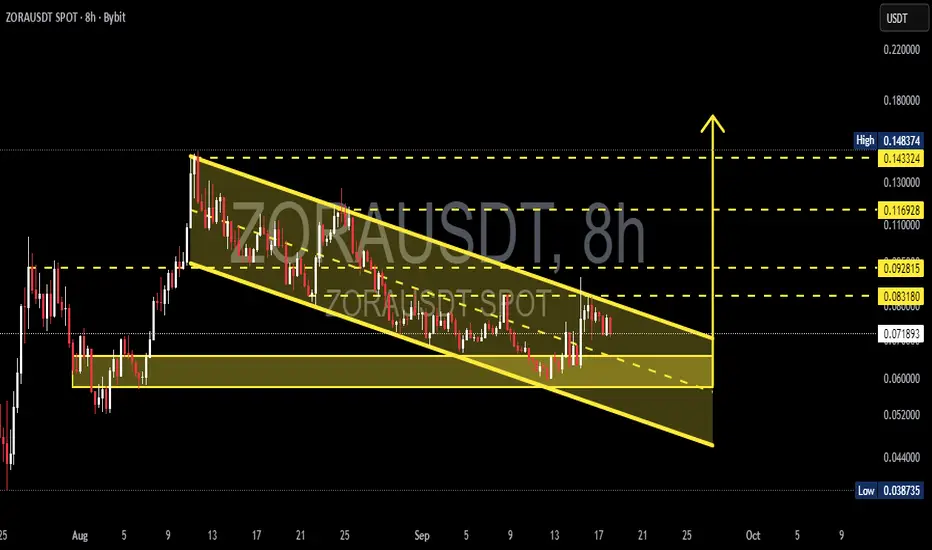
ZORA/USDT — Descending Channel Reaching Decision Point?Currently, ZORA/USDT is trading inside a well-defined descending channel, formed since the mid-August peak. The structure shows a sequence of lower highs and lower lows, reflecting mid-term bearish control. However, this pattern also resembles a falling wedge, which often signals a potential bullish reversal if a breakout occurs.
---
🔹 Technical Structure
Main Pattern: Descending channel (slightly converging, similar to a falling wedge).
Current Price: ~0.0719 USDT
Demand Zone: 0.055 – 0.062 (strong accumulation area tested multiple times).
Key Support: 0.0387 (chart low).
Resistance Levels:
0.0831 → first breakout trigger
0.0928 → next psychological resistance
0.1169 → mid-term target if momentum holds
0.1433 – 0.1483 → major resistance zone / previous rally high
---
🔹 Bullish Scenario
1. Price must close above the channel’s upper trendline and 0.0831 on the 8H timeframe.
2. A valid breakout should be confirmed with strong volume + successful retest of the upper channel as new support.
3. If confirmed, bullish targets are:
🎯 Target 1 → 0.0928
🎯 Target 2 → 0.1169
🎯 Target 3 → 0.1433 – 0.1483
📍 Note: A failed breakout (false breakout) could send price back into the channel.
---
🔹 Bearish Scenario
1. If price gets rejected at the upper channel or fails to close above 0.0831, downside pressure may return.
2. A strong breakdown below the demand zone (0.055–0.062) opens the path toward 0.0387.
3. Bearish outlook is invalidated if the price sustains above 0.0831 with confirmation.
---
🔹 Conclusion
ZORA/USDT is approaching a critical decision zone.
The descending channel structure provides two clear paths:
🚀 Bullish breakout above 0.0831 → upside targets 0.0928 – 0.1433.
📉 Breakdown below 0.055–0.062 → potential continuation toward 0.0387.
Key decision levels: 0.0831 (resistance) and 0.055–0.062 (support zone).
---
📢 Trading Notes
Always wait for 8H/1D candle close for confirmation before execution.
Risk management is crucial — never enter without a stop loss.
Descending channels often lead to explosive moves once a breakout is confirmed — be prepared.
---
ZORA/USDT is consolidating inside a descending channel. 0.0831 is the breakout trigger for a bullish reversal, while 0.055–0.062 remains the key demand zone. Breakout → targets 0.0928 – 0.1433. Breakdown → risk toward 0.0387. Watch candle close + volume for confirmation.
---
#ZORA #ZORAUSDT #Crypto #Altcoins #TechnicalAnalysis #TradingView #ChartPattern #Breakout #SupportResistance #PriceAction
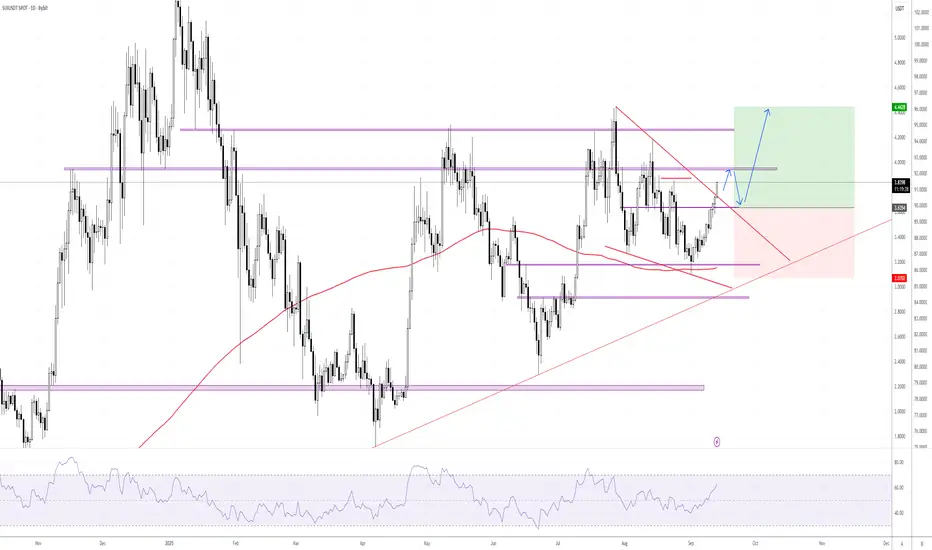
The key is whether it can rise above 3.9509
Hello, fellow traders.
Please "Follow" to always get the latest information quickly.
Have a great day.
-------------------------------------
(SUIUSDT 1D Chart)
Since the HA-High ~ DOM (60) ranges on the 1W and 1D charts partially overlap, a breakout above the 3.9509-4.7328 range is expected to lead to a sharp rise.
Therefore, the 3.9509-4.7328 range is considered a resistance zone.
The HA-Low and HA-High indicators are converging as price movements move.
If this convergence occurs, the converged range, i.e., the HA-Low ~ HA-High range, can be considered a buy zone.
If the price falls below the 2.4495-2.8161 range, trading should be halted and the situation should be monitored.
Currently, the M-Signal indicator on the 1M chart is moving between 2.4495 and 2.8161. Therefore, if the price falls below this level, a stop loss should be considered and a response strategy should be developed.
Based on a basic trading strategy, a buy signal is signaled when support is found in the 2.4495-2.8161 range.
However, if the price falls below the M-Signal indicator on the 1M chart, a downtrend is likely, requiring a response strategy.
-
I mentioned the resistance range as 3.9509-4.7328. However, since the HA-High ~ DOM (60) range on the 1D chart is 3.9509-4.3260, a buy signal can be made when the price finds support within this range and rises.
However, since the buy signal is near the resistance level, a quick and short response is required.
The first sell range is 4.7328-4.96.
-
Thank you for reading to the end.
I wish you successful trading.
--------------------------------------------------

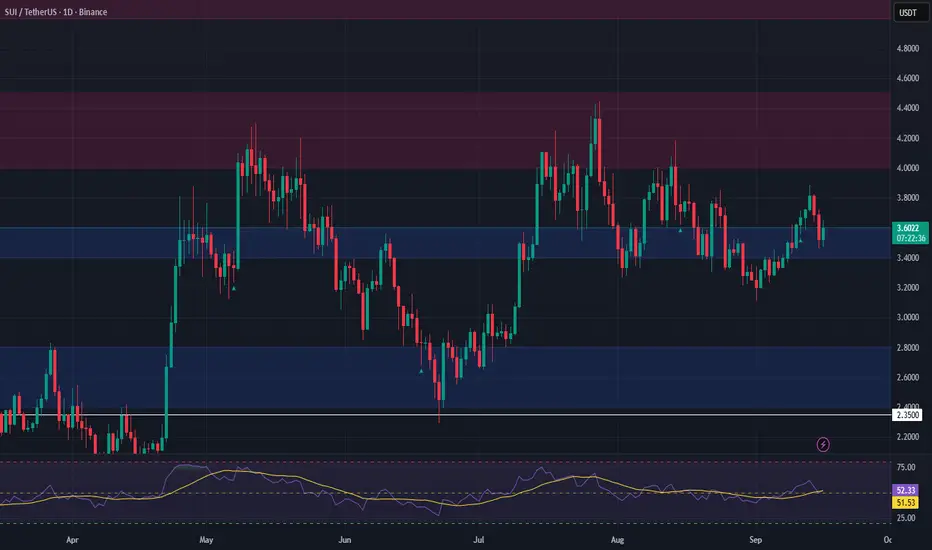
SUI Trade Setup – Bullish Structure Intact Amid VolatilitySUI continues to hold a bullish market structure despite increased volatility driven by macro headlines. Price action remains above the bull market support band, indicating strength and resilience. A notable confluence zone has formed between $2.40 and $2.80, where buyers previously stepped in aggressively.
This area is shaping up as a high-probability accumulation zone, especially if a liquidation wick drives price into it. A bounce from this range could initiate the next expansion leg upward.
🔹 Trade Setup
• Entry Zone: $2.40 – $2.80
• Take Profit Targets:
🥇 $3.40 – $3.60
🥈 $4.00 – $4.50
• Stop Loss: Daily close below $2.35
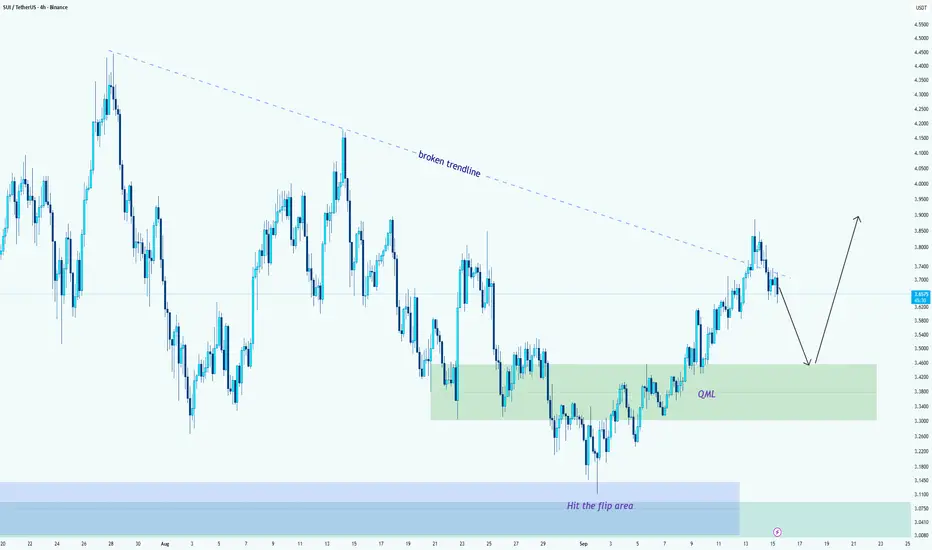
SUI/USDT --> Two-Step Setup: Retest QML, Then RallyHello guys!
Short version first: I expect a pullback to the QML (3.30–3.45), then a bounce that resumes the upside toward 3.80–3.90 (and potentially higher if momentum continues).
Why this makes sense (the plan):
Step 1 --> Pullback to QML:
Price broke the long descending trendline and impulsed higher, but the move is showing a normal two-leg structure: first leg up, now a corrective leg down. The green QML box (3.30–3.45) is the nearby demand zone and the most logical place for buyers to re-enter.
Step 2 --> Bounce & continuation:
If the QML holds and we get a bullish rejection (pinbar, engulfing, clear wick rejection, or a nice bullish close), the most likely path is a continuation back toward the recent supply area — 3.80– 3.90 as the first meaningful resistance. If momentum keeps, extensions toward the next structural highs become possible.
Final note
This is a two-step game: first, the retest, then the real trade. Don’t chase the breakout now; patience at the QML will give a cleaner, higher-reward setup.
SUI Wedge BreakoutSui formed a bullish Wedge and it broke out.
If the price established above 3.63, We can expect a bullish move up to 4.4 area.
Stops at 3.07.
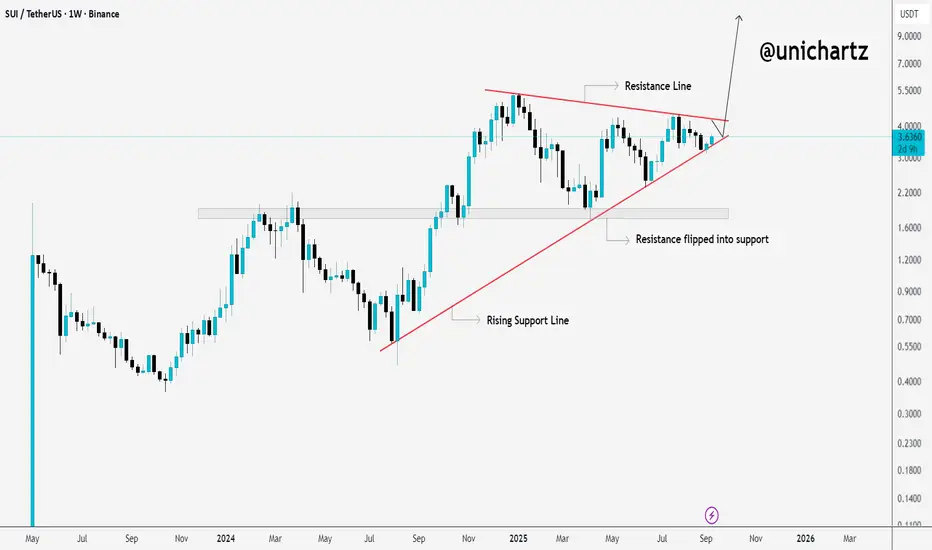
SUI at a Crossroads: Next Move Could Be HugeCRYPTOCAP:SUI has been moving inside a big triangle pattern, with rising support holding the lows and strong resistance capping the highs. Notice how the old resistance around $1.60 has already flipped into support, a healthy sign showing buyers are still in control.
Right now, SUI is sitting at the apex of the triangle. A breakout above resistance could open the door for a sharp move higher, while losing that rising support would mean buyers need to regroup at lower levels.
In simple terms: the squeeze is on, and whichever side breaks, momentum will likely follow fast.
DYOR, NFA
Stay updated everyday follow us on TradingView
#PEACE
SUI Swing Long Opportunity - AltcoinSUI Swing Long Opportunity
📊 Market Sentiment
Market sentiment remains strongly bullish as the FED is expected to deliver a 0.25% rate cut, with speculation building for a possible 0.5% cut in September. Monetary policy shifts are being driven by both inflation trends and weakening labor market data. The latest August and September job reports were soft, signaling that the economy is cooling rapidly. This environment continues to fuel expectations for a major bullish run in the weeks ahead.
📈 Technical Analysis
Price ran the HTF liquidity and bounced from there.
Price tested the HTF key resistance level three times and was rejected, but today it finally broke and closed above the HTF key SR. I expect this level to hold.
Price also broke the bearish trendline that had been controlling the bearish trend since July 27th.
📌 Game Plan
I will be looking to build a long position when we retest the broken HTF Key Level at $3.44.
Possibly, price may also retest the broken trendline, but I won’t be relying on that scenario.
🎯 Setup Trigger
Retest of the broken HTF key level.
📋 Trade Management
Stoploss: $3.34 (below the HTF key level with 2 consecutive 4H candle closures)
Target:
TP: $3.71
💬 Like, follow, and comment if you find this setup valuable!
⚠️ Disclaimer: This content is for informational and educational purposes only and does not constitute financial, investment, or trading advice. Always do your own research before making any financial decisions.

IDOLUSDT - Break or Breakdown? IDOL at Decision Zone!Currently, MEET48/USDT is sitting at a critical decision zone after a parabolic rally from 0.012 → 0.0428. The euphoric surge was followed by a healthy correction and distribution phase, forming lower highs capped by a descending trendline (yellow) while price consolidates within the 0.030 – 0.033 box zone (yellow box).
This area now acts as the ultimate battlefield between buyers and sellers. The next decisive move will determine whether we get a bullish continuation breakout or a bearish breakdown into deeper correction.
---
Visible Patterns
1. Descending Trendline (seller pressure)
Price has repeatedly failed to close above this yellow line → showing sellers are defending strongly.
2. Consolidation Box (accumulation zone)
The 0.030–0.033 zone is the current tug-of-war area. As long as price holds above it, buyers still have a chance.
3. Two Technical Interpretations:
Descending Triangle (bearish bias): if price continues to press against support.
Falling Wedge (bullish bias): if price breaks to the upside, often signaling trend continuation after a pullback.
---
Bullish Scenario
Trigger: 4H candle close above 0.033 with strong volume confirmation.
Targets:
TP1 → 0.0361 (first resistance)
TP2 → 0.0405
TP3 → 0.0428 (local high/ATH)
Narrative: A breakout signals buyers regaining control and resuming the prior rally after consolidation.
---
Bearish Scenario
Trigger: 4H candle close below 0.030 with high selling pressure.
Targets:
First support zone → 0.024 – 0.025
Extended target → 0.0115 (historical low shown on chart)
Narrative: A breakdown confirms sellers dominating the zone, opening room for a deeper correction.
---
Key Takeaway
0.030 – 0.033 = Decision Zone
Breakout above → continuation higher.
Breakdown below → deeper correction.
Watch volume and 4H candle close for confirmation.
---
Notes for Traders
Avoid FOMO, wait for confirmation before entering.
Use scaling strategies (partial entries/exits).
Always manage risk with stop loss outside the box zone.
MEET48 is a low-cap altcoin → expect potential false moves due to low liquidity.
---
#MEET48 #MEET48USDT #CryptoAnalysis #Altcoin #TechnicalAnalysis #Breakout #DescendingTriangle #FallingWedge #SupportResistance

SUI | Watching for Key Resistance Flip — Long Setup BuildingDescription:
Sui (SUI) is shaping up for a potential bullish continuation, with price action currently hovering just below a critical resistance zone. A confirmed break and retest of this level could open the door for a strong upside move.
📍 Trade Setup:
Entry Zone: $3.40 – $3.60
Stop Loss: Just below $3.30
Take Profit Targets:
TP1: $4.00 – $4.20
TP2: $5.00 – $5.20
This setup is built around a support-to-resistance flip. If bulls can reclaim the overhead resistance and turn it into a base, it could confirm bullish momentum continuation.
#SUI #Crypto #Altcoins #SwingTrade #TechnicalAnalysis #TradingSetup

#SUI/USDT → Resistance breakout and entry into the buying zone#SUI
The price is moving within a descending channel on the 1-hour frame, adhering well to it, and is heading for a strong breakout and retest.
We have a bearish trend on the RSI indicator that is about to be broken and retested, which supports the upward breakout.
There is a major support area in green at 3.14, which represents a strong support point.
For inquiries, please leave a comment.
We are in a consolidation trend above the 100 Moving Average.
Entry price: 3.29
First target: 3.38
Second target: 3.51
Third target: 3.67
Don't forget a simple matter: capital management.
When you reach the first target, save some money and then change your stop-loss order to an entry order.
For inquiries, please leave a comment.
Thank you.

SUIUSDTThe chart is on best support but I not see confirmation candle or volume of buy for entry.
Next level is for best support is 2.91$. I think the price will touch this level with a shadow. What are you think?

$SUI: my green zones are back. Time to refill our bags.CRYPTOCAP:SUI is showing strong momentum, but the current consolidation could be forming an M-pattern — a bearish setup that might push the price down into my green box buy zone.
A bounce from this area has historically delivered solid profits, and the setup looks similar to previous cycles where we saw strong recoveries.
This pattern isn’t unique to CRYPTOCAP:SUI — it’s part of a broader market structure we’re seeing across many altcoins, suggesting a shared macro setup that could present multiple buying opportunities.
------------------------------
The altcoin market just saw a solid pump, following the massive CRYPTOCAP:BTC and CRYPTOCAP:ETH institutional billion-dollar purchases.
On the Daily timeframe, we’re actually printing higher lows, showing clear market strength. The top of the range was rejected, and now it’s highly probable that the crypto market will enter a consolidation phase — a move that could push several altcoins into my buying zones.
💡 Reminder: My buying zones are areas where it’s statistically safer to buy and hold, with an almost guaranteed chance of making a solid profit on the next bounce.
What could spark the infamous Altseason?
Many altcoins share one thing in common: a major resistance line (marked in yellow). For them to pump to the moon, this line needs to be broken.
We’re also seeing a price compression — meaning the breakout could be imminent. This pullback might be your last chance to enter a long position before the real Altseason kicks off.
Possible Altseason catalysts:
📉 FED Interest Rate Cut of 1% or more.
📈 Institutional adoption through altcoin index ETFs — imagine BlackRock launching ALT10, ALT50, ALT100 ETFs, attracting massive institutional money into the altcoin market.
I believe both events could happen before the end of the year.
DYOR — but the window might be closing fast. 🚀

SUI long IdeaSUI LONG idea
Symmetrical triangle was broken, Market structure broken to bullish.
Breakout-retest and descending wedge will be broken up soon.
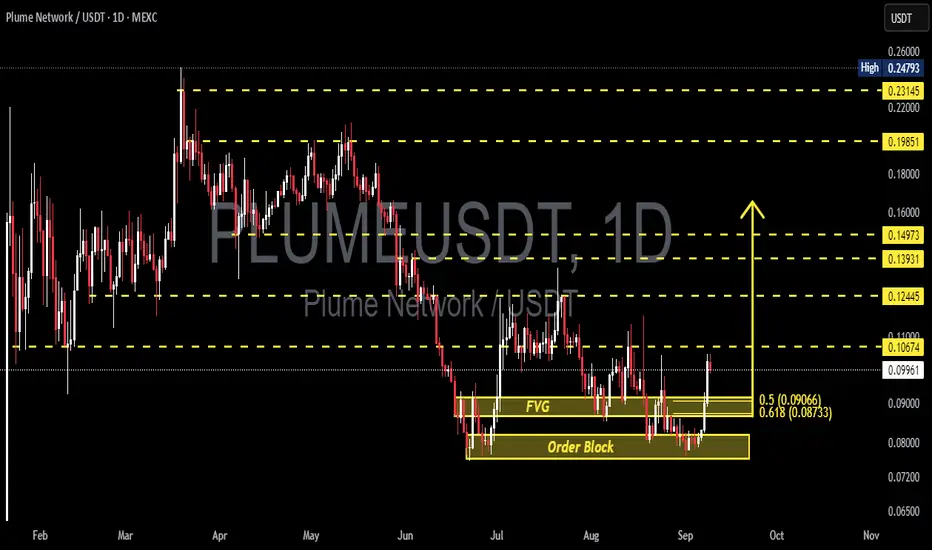
PLUME/USDT (1D) — Decision: Major Reversal or Deeper Correction?🔎 Technical Outlook
PLUME is currently at a critical stage after months of decline since April. The price has found a strong demand zone around 0.076–0.082, aligned with a daily Order Block, reinforced by a Fair Value Gap (FVG) highlighting an imbalance zone that often acts as a turning point.
From this zone, PLUME bounced sharply toward 0.100–0.106, which now stands as the first key resistance. This strong reaction suggests accumulation by larger players — but the real battle begins here: will PLUME break above 0.10674 to confirm a bullish reversal, or face rejection and revisit the demand zone?
---
🟢 Bullish Scenario
1. Upside Confirmation:
A daily close above 0.10674 would signal short-term bullish momentum. Breakout could open the path toward higher resistance levels:
Target 1: 0.12445
Target 2: 0.13931
Target 3: 0.14973
Major Upside Zone: 0.19851 → 0.23145
2. Entry Ideas:
Conservative: wait for a retest at 0.090–0.092 (FVG) with stop-loss below 0.078.
Aggressive: buy after a daily close above 0.10674 with volume confirmation.
3. Why Bullish Could Work:
Strong bounce from demand zone.
FVG often gets filled before continuation.
Breaking 0.10674 would form a higher high and signal structure shift.
---
🔴 Bearish Scenario
1. Rejection at Resistance:
If the price fails to break 0.10674, PLUME is likely to revisit:
The FVG area (0.087–0.091).
The Order Block (0.076–0.082).
2. Breakdown of Demand Zone:
Losing this support zone could send PLUME lower toward 0.065.
3. Short Setup Idea:
Entry: rejection near 0.105–0.107 with bearish confirmation.
Stop-loss: above 0.112.
Take-profit: first at 0.087–0.091, then 0.076–0.082.
---
📌 Pattern in Play
Order Block + FVG: strong demand zone overlap.
Potential Reversal Zone: could mark a major turning point.
Key Pivot: 0.10674 — breakout or rejection here will define the next trend.
---
📝 Conclusion
PLUME is at a make-or-break moment:
Bullish Valid: daily close above 0.10674 → opens the way to 0.124–0.149 and potentially higher.
Bearish Valid: rejection at resistance and breakdown of the Order Block → downside risk toward 0.065.
The 0.076–0.091 demand zone is the last line of defense for buyers.
⚠️ Always apply strict risk management, as this setup is highly prone to false breakouts and fake pumps.
---
#PLUME #PLUMEUSDT #Crypto #TechnicalAnalysis #Altcoin #OrderBlock #FVG #PriceAction #CryptoTrading #SupplyDemand
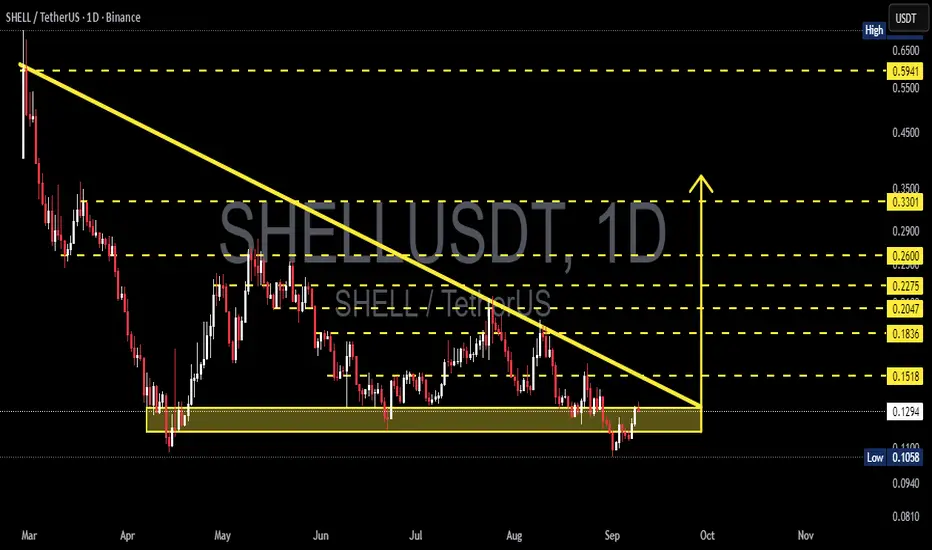
SHELL/USDT — Decision Point at the Edge of Descending TriangleCurrently, SHELL/USDT (1D) is at a critical stage after a prolonged downtrend since March. The chart clearly shows a Descending Triangle pattern, with strong support around 0.1058 – 0.1350.
Each time price dips into this zone, buyers step in for a rebound — yet sellers consistently push lower highs, forming a descending trendline. This signals the market is in a consolidation phase before a major decision: either a breakout to the upside or a breakdown to the downside.
---
🔎 Pattern and Chart Structure
Main pattern: Descending Triangle (default bias = bearish).
Strong support: 0.1058 – 0.1350 (demand zone, tested multiple times).
Dynamic resistance: Descending trendline (~0.1518 now).
Key levels to watch:
Resistance: 0.1836 → 0.2047 → 0.2275 → 0.2600 → 0.3301 → 0.5941.
Support: 0.0940 → 0.0810 (if breakdown).
---
🚀 Bullish Scenario
Bullish momentum may emerge if there’s a daily close above 0.1518 with strong volume, signaling buyers breaking through the descending pressure.
Initial target: 0.1836.
Mid targets: 0.2047 – 0.2275.
Extended targets: 0.2600 → 0.3301 → potentially 0.5941 if momentum accelerates.
Strategy: Enter after breakout confirmation, stop loss below 0.1300 or below 0.1058 for full invalidation.
---
🐻 Bearish Scenario
If price fails at the trendline and instead breaks down below 0.1058 on a daily close, the descending triangle plays out as a bearish continuation.
First target: 0.0940.
Next target: 0.0810.
Strategy: Enter short/re-entry on breakdown, with stop loss above 0.1200–0.1300.
---
📌 Conclusion: “Decision Zone”
SHELL/USDT is at a critical decision zone. Buyers are defending support, while sellers continue pressing down with lower highs.
Breakout above trendline → potential trend reversal.
Breakdown below support → bearish continuation.
Traders should avoid FOMO and wait for clear confirmation (breakout or breakdown). Risk management is essential: use stop loss and proper position sizing.
---
#SHELL #SHELLUSDT #Crypto #TechnicalAnalysis #SupportResistance #Breakout #DescendingTriangle #CryptoTrading
DEEP/USDT — Critical Support Zone: Rebound or Breakdown?Currently, DEEP/USDT is testing a major support area around 0.110 – 0.131 USDT (yellow box). This zone has acted as a strong demand level several times in the past, making it the key decision point: will price rebound toward higher resistance levels, or will it break down and extend the bearish trend?
---
🔹 Price Structure & Pattern
Earlier this year, DEEP reached a high of 0.34498 before facing a sharp correction.
Since May, the chart has been moving in a sideways range, but with a clear pattern of lower highs — showing ongoing selling pressure.
The yellow box (0.110 – 0.131) represents the main demand/support zone. Whether price holds or breaks this zone will define the next major move.
---
✅ Bullish Scenario
If the support holds and price bounces:
Step-by-step upside targets:
1. 0.1767 → +35%
2. 0.2017 → +54%
3. 0.2228 → +70%
4. 0.3019 – 0.3428 → +130% from current levels
Bullish confirmation: a reversal candle (bullish engulfing / pin bar) with strong volume, or a daily close above 0.1767.
Strategy: Enter near support with a conservative SL below 0.095 to avoid fakeouts.
---
❌ Bearish Scenario
If support fails and the daily close drops below 0.110:
Immediate downside target: 0.0900
Extended breakdown may push price toward the 0.0457 major low.
Bearish confirmation: strong daily close below the yellow zone with high selling volume.
---
🎯 Conclusion
DEEP is at a make-or-break level. A rebound from support could trigger a rally of over +100%, while a breakdown might lead to a retest of its historical lows. Traders should wait for clear confirmation (candle + volume) before entering. Always apply strict risk management and avoid impulsive trades.
---
#DEEPUSDT #Altcoin #CryptoAnalysis #PriceAction #SupportResistance #TechnicalAnalysis #CryptoTrading

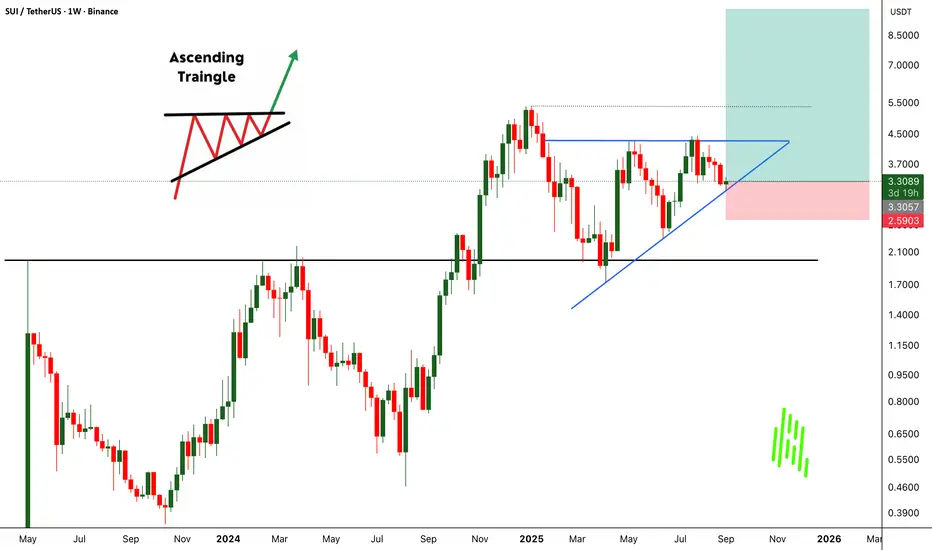
SUIUSDT Weekly Outlook!! Target $10CRYPTOCAP:SUI has once again bounced strongly from its key support zone, making it the third touch at this level. Each time price defends this area, it reinforces the strength of buyers stepping in, showing that demand remains intact.
On the weekly chart, BINANCE:SUIUSDT is now shaping a clean Ascending Triangle pattern. This is typically a bullish continuation setup, and the structure is becoming clearer with every retest. The longer price consolidates under the resistance, the stronger the breakout move is likely to be once bulls finally push through.
All eyes remain on the $4.4 breakout level. A successful close above this resistance could open the door for a powerful move to the upside. My target remains unchanged at $10, supported by the bullish technical formation and repeated validation of support.
BINANCE:SUIUSDT Currently trading at $3.3
Buy level : Above $3.3
Stop loss : Below $2.62
Target 1: $4
Target 2: $5
Target 3: $7
Target 4: $10
Max leverage 2x
Always keep stop loss
Follow Our Tradingview Account for More Technical Analysis Updates, | Like, Share and Comment Your thoughts
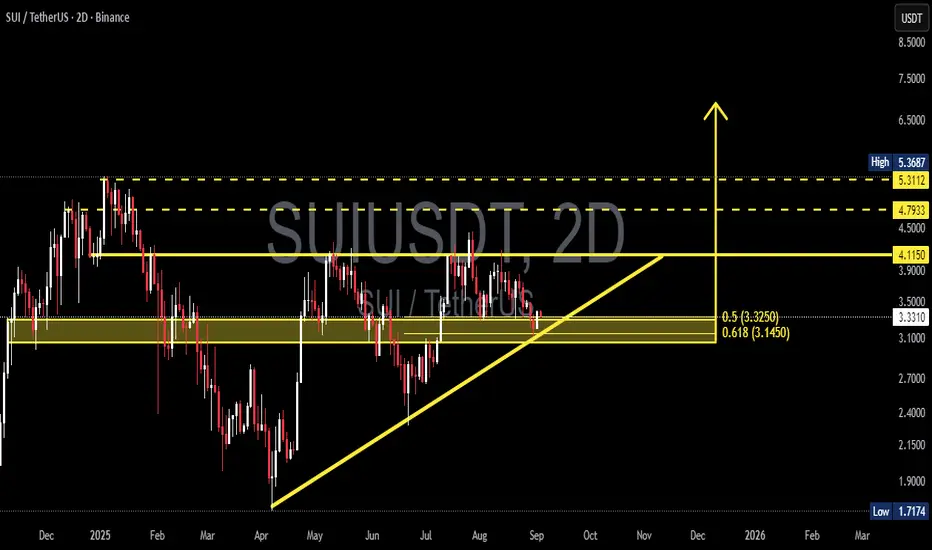
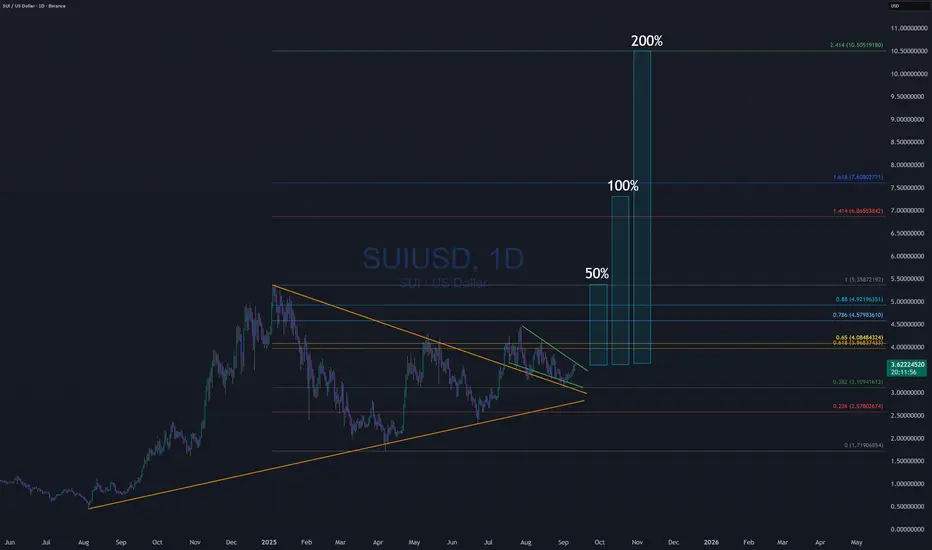
SUIUSDT — Test Golden Pocket: Breakout or Breakdown Ahead?🔎 Overview:
SUI/USDT is currently sitting at a critical decision point. Since April 2025, price action has been forming higher-lows supported by an ascending trendline (yellow). On the upside, we see a flat resistance around 4.115, creating an Ascending Triangle pattern — a classic bullish continuation structure that often precedes a breakout.
However, price is now testing the key demand zone at 3.33–3.15, which perfectly aligns with the Fibonacci golden pocket (0.5 & 0.618 retracement). This zone will likely determine the next major move: either a strong rebound to the upside or a deeper breakdown.
---
📈 Bullish Scenario (Breakout Potential):
Trigger: Price holds above 3.33–3.15 and breaks 4.115 with a strong 2D candle close.
Pattern Implication: A breakout from the ascending triangle usually results in a move equal to the pattern’s height (~0.9–1.1 points), projecting targets around 5.0–5.3.
Targets:
TP1 = 4.79 (intermediate liquidity)
TP2 = 5.31–5.37 (major resistance & previous high)
Extra Signal: A breakout with rising volume would strengthen the bullish outlook significantly.
---
📉 Bearish Scenario (Breakdown Risk):
Trigger: A decisive close below 3.10, which would break both the ascending trendline and the golden pocket.
Consequence: This breakdown could open the door to a deeper retracement.
Targets:
2.70 (minor support)
2.40 (major support)
2.15 (previous demand zone)
Extreme case: 1.72 (historical low)
Invalidation: A recovery above 3.35 followed by a breakout over 4.115 would nullify the bearish setup.
---
📌 Conclusion:
SUI is at a make-or-break level. The 3.33–3.15 zone is the battlefield between bulls and bears, marking the golden pocket of this structure. Holding this level keeps the door open for a bullish breakout towards 5.0–5.3, while losing it could trigger a significant drop toward the 2.70–2.15 range.
📊 Strategy: Wait for a confirmed 2D close before positioning. Manage risk tightly and watch how price reacts at this golden pocket zone — it will set the tone for the next major trend.
---
#SUI #SUIUSDT #CryptoAnalysis #AscendingTriangle #PriceAction #SupplyDemand #GoldenPocket #Fibonacci #CryptoBreakout #SupportResistance #SwingTrading