#SUI/USDT → Resistance breakout and entry into the buying zone#SUI
The price is moving within an ascending channel on the 1-hour frame, adhering well to it, and is on its way to breaking strongly upwards and retesting it.
We have support from the lower boundary of the ascending channel, at 3.40.
We have a downtrend on the RSI indicator that is about to break and retest, supporting the upside.
There is a major support area in green at 3.50, which represents a strong basis for the upside.
Don't forget a simple thing: ease and capital.
When you reach the first target, save some money and then change your stop-loss order to an entry order.
For inquiries, please leave a comment.
We have a trend to hold above the 100 Moving Average.
Entry price: 3.51
First target: 3.60
Second target: 3.72
Third target: 3.90
Don't forget a simple thing: ease and capital.
When you reach the first target, save some money and then change your stop-loss order to an entry order.
For inquiries, please leave a comment.
Thank you.
SUI

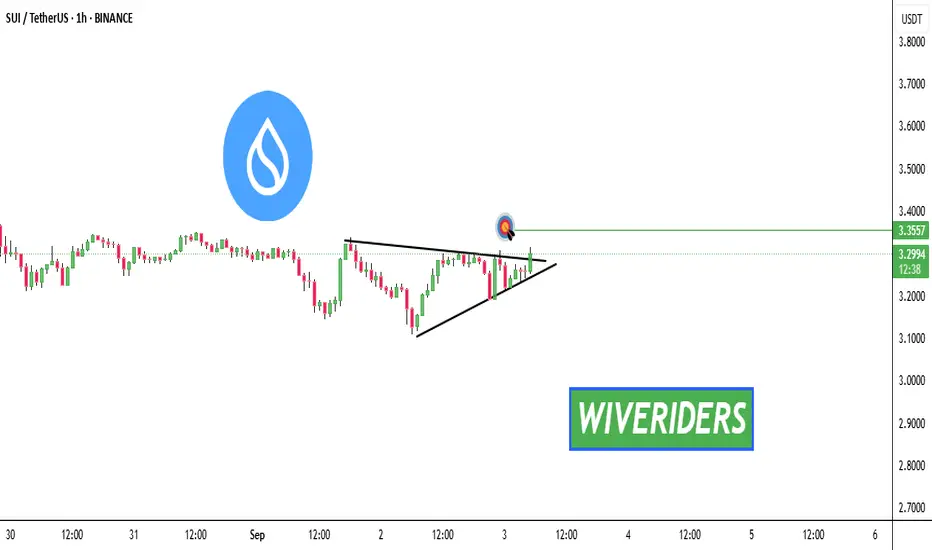
SUI Breakout Alert!🚨 CRYPTOCAP:SUI Breakout Alert! 🚨
CRYPTOCAP:SUI has developed a bullish ascending setup 📈
👉 Price action is pressing against resistance, showing breakout potential.
⚠️ Key point: Stay cautious of fakeouts — confirmation is needed before entry.
👉 If the breakout holds, the first target aligns with the green level 🎯
This move would indicate strong bullish continuation with buyers taking control ✅
SUI/USDT - Ready to Ride the Wave!🚀 Trade Setup Details:
🕯 #SUI/USDT 🔼 Buy | Long 🔼
⌛️ TimeFrame: 1D
--------------------
🛡 Risk Management (Example):
🛡 Based on $1000 Balance
🛡 Loss-Limit: 1% (Conservative)
🛡 The Signal Margin: $48.26
--------------------
☄️ En1: 3.1925 (Amount: $4.83)
☄️ En2: 2.9529 (Amount: $16.89)
☄️ En3: 2.7933 (Amount: $21.72)
☄️ En4: 2.6424 (Amount: $4.83)
--------------------
☄️ If All Entries Are Activated, Then:
☄️ Average.En: 2.874 ($48.26)
--------------------
☑️ TP1: 3.8572 (+34.21%) (RR:1.65)
☑️ TP2: 4.4436 (+54.61%) (RR:2.64)
☑️ TP3: 5.3193 (+85.08%) (RR:4.11)
☑️ TP4: 6.6869 (+132.67%) (RR:6.4)
☑️ TP5: 8.6086 (+199.53%) (RR:9.63)
☑️ TP6: Open 🔝
--------------------
❌ SL: 2.2786 (-20.72%) (-$10)
--------------------
💯 Maximum.Lev: 3X
⌛️ Trading Type: Swing Trading
‼️ Signal Risk: 🙂 Low-Risk! 🙂
🔎 Technical Analysis Breakdown:
This technical analysis is based on Price Action, Elliott waves, SMC (Smart Money Concepts), and ICT (Inner Circle Trader) concepts. All entry points, Target Points, and Stop Losses are calculated using professional mathematical formulas. As a result, you can have an optimal trade setup based on great risk management.
📊 Sentiment & Market Context:
Market sentiment remains positive as traders eye key entry levels with well-defined risk management in place. With attractive profit targets and controlled stop-loss, this swing trade setup offers an excellent risk-reward profile for both conservative and aggressive traders.
⚠️ Disclaimer:
Trading involves significant risk, and past performance does not guarantee future results. This analysis is for informational purposes only and should not be considered financial advice. Always conduct your research and trade responsibly.
💡 Stay Updated:
Like this technical analysis? Follow me for more in-depth insights, technical setups, and market updates. Let's trade smarter together!

SIGN/USDT – Critical Accumulation Zone Before the Next Big Move!📊 Detailed Analysis of SIGN/USDT
Currently, SIGN/USDT is moving within a prolonged consolidation phase, with the key demand zone at 0.06700 – 0.07000 USDT (highlighted in yellow). This zone has acted as a strong base since mid-June, repeatedly rejecting downside pressure, and can be considered a major accumulation area.
---
🔎 Market Structure & Pattern
1. Sideways Accumulation
The price is forming a sideways base within the range of 0.067 – 0.078 USDT. Such structures often precede a significant move, either a breakout to the upside or a breakdown lower.
2. Strong Support Zone
Primary Support: 0.06700 – 0.07000 USDT
Next Supports: 0.06300 – 0.05950 USDT, if breakdown occurs.
3. Layered Resistance (Supply Zones)
R1: 0.07382 – 0.07814 USDT
R2: 0.08532 – 0.08938 USDT
R3: 0.09576 – 0.10137 USDT
This structure signals that the price is currently at a decision point, awaiting confirmation of the next big move.
---
✅ Bullish Scenario
As long as price holds above 0.06700, this zone can serve as a strong rebound point.
A breakout above 0.07382 – 0.07814 will open the way toward 0.08532 – 0.08938.
Further bullish momentum above 0.09576 may push the price to 0.10137 USDT, which is the major resistance zone.
If sustained, this could evolve into an Ascending Accumulation Pattern, strengthening the bullish outlook.
---
❌ Bearish Scenario
If the price breaks below 0.06700, a drop toward 0.06300 – 0.05950 becomes highly likely.
A confirmed daily close below this support would shift the structure into a downtrend continuation, possibly extending losses toward 0.05650.
This scenario would reinforce bearish momentum and invalidate the current accumulation zone.
---
🎯 Key Takeaway
0.06700 – 0.07000 USDT is the make-or-break zone.
Holding above it keeps the bullish rebound potential alive, while a breakdown will accelerate the bearish trend.
For traders, this level can act as a strategic entry point with strict risk management, as the market is preparing for its next decisive move.
#SIGNUSDT #CryptoAnalysis #PriceAction #SupportResistance #CryptoTrading #Altcoins #ChartAnalysis #BullishScenario #BearishScenario

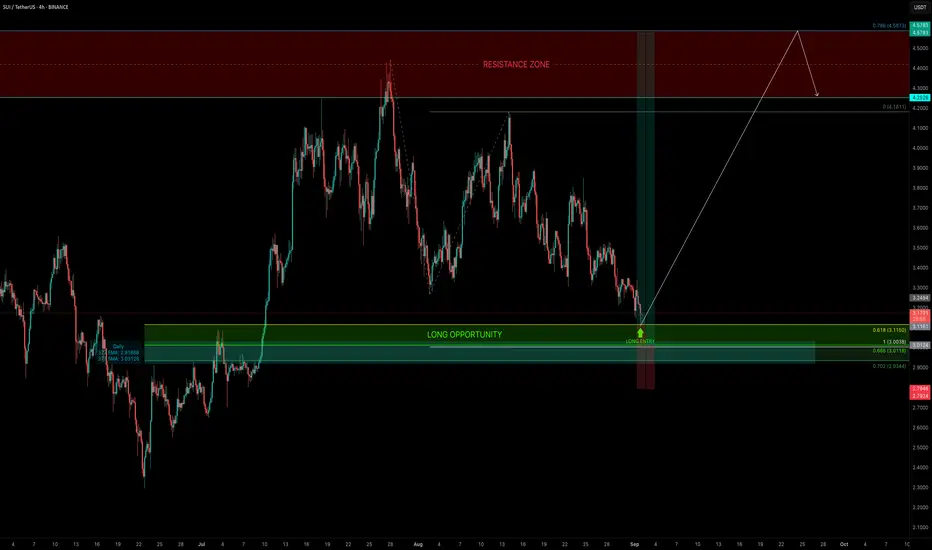
SUI — The $3 Confluence ZoneFor almost 2 months, SUI has been trading sideways in a range between $4 and $3. Today, price tapped the 0.618 Fib retracement ($3.115) of the entire move and bounced, giving a clean long trigger.
Looking ahead, the 1.0 trend-based Fib extension sits at $3.00 → a psychological key level in confluence with the 0.666 Fib retracement, making it the ideal long entry if price sees another drop.
🧩 Confluence Support Zone
0.618–0.702 Fib retracement → primary long entry range
Trend-based Fib extension 1.0: $3.00
0.666 Fib retracement: overlapping $3.00
377 EMA (daily): $2.919
377 SMA (daily): $3.03
🟢 Long Trade Setup
Entry Zone: $3.115 (0.618) → down to $3.00 (extension + retracement confluence)
Best Entry: Around $3.00
Stop-Loss: Below $2.80 (beneath 377 EMA support)
Target: Range highs
Potential Move: +50%
R:R: 1:5+
🔍 Indicators used
Multi Timeframe 8x MA Support Resistance Zones → to identify support and resistance zones such as the weekly 21 EMA/SMA.
➡️ Available for free. You can find it on my profile under “Scripts” and apply it directly to your charts for extra confluence when planning your trades.
_________________________________
💬 If you found this helpful, drop a like and comment!
SUI Wave (4) Still Underway?Its unclear weather CRYPTOCAP:SUI wave 4 is complete or still underway as a larger triangle of flat correction, in a ending diagonal wave 4 (defined by wave 4 falling to wave 1 at the 0.5 Fib).
Price terminated 3 waves up at the High Volume Node resistance and is now finding support at the weekly pivot, 0.236 Fibonacci retracement. Further decline brings up the the 0.382 High Volume Node support.
Weekly RSI is at the EQ.
Safe trading

SUI formed the triangle ┆ HolderStatBINANCE:SUIUSDT is shaping a massive triangle formation after a series of consolidations. The structure highlights indecision, but traders should prepare for a potential breakout. An upside move could aim for the $4.20–$4.50 range, while a downside push would likely test the $3.20 support. Watching these levels closely will help identify whether accumulation or distribution is underway.

SUI — Where Liquidity Turns Into OpportunitySUI has been trading sideways for the past 40 days, offering solid swing opportunities both long and short. At the moment, there is one long setup that stands out → the $3.33 zone, where multiple layers of confluence align.
🧩 Confluence Factors: 5
1.0 Trend-Based Fib Extension: $3.3319
Prior Low: $3.3272 → potential liquidity sweep (SSL)
Anchored VWAP: Supporting the zone
Weekly 21 EMA / SMA: Acting as dynamic support
40d Range Context: Range low positioning
🟢 Long Trade Setup
Entry Zone: ~$3.33 (liquidity sweep into support)
Stop-Loss: Below $3.25
Target: Range highs near $4.20
R:R Potential: 1:10+
Note: Wait for bullish confirmation (order flow or strong reaction) before entering.
Technical Insight
The $3.33 level combines liquidity, fib projection, VWAP support, and the weekly 21 EMA/SMA → all pointing to a high-probability reaction zone. In sideways environments, such confluence at range lows often defines pivot points for the next swing move. If defended, upside targets remain the range high around $4.20.
🔍 Indicators used
Multi Timeframe 8x MA Support Resistance Zones → to identify support and resistance zones such as the weekly 21 EMA/SMA.
➡️ Available for free. You can find it on my profile under “Scripts” and apply it directly to your charts for extra confluence when planning your trades.
_________________________________
💬 If you found this helpful, drop a like and comment!

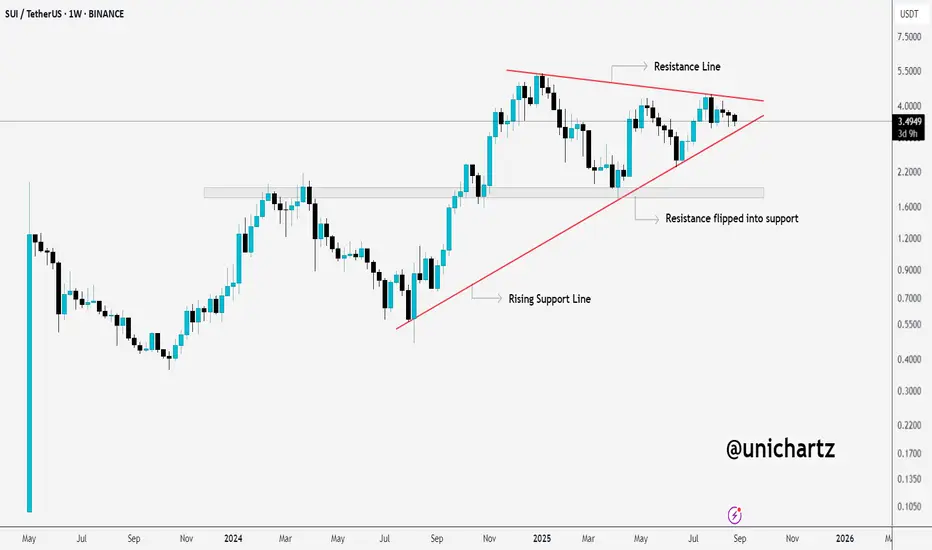
SUI Coiling for Big Move – Watch the ApexCRYPTOCAP:SUI is currently consolidating inside a symmetrical triangle, squeezed between a descending resistance line and a rising support line. This tightening structure suggests that a breakout move is on the horizon.
What’s notable is that a key resistance zone has now flipped into support, which gives bulls a solid base to defend. As long as SUI holds this rising trendline, the bias remains bullish.
DYOR, NFA
#PEACE
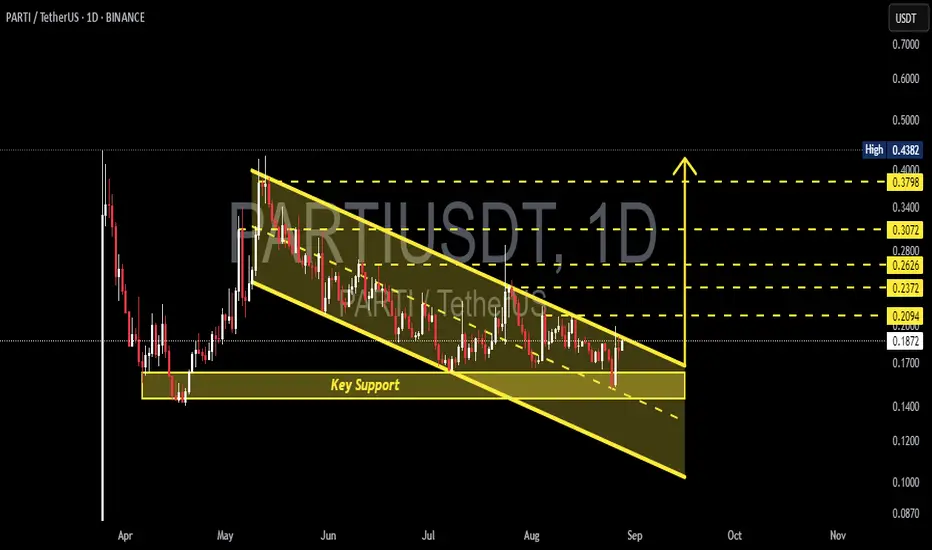
PARTI/USDT — Descending Channel & Key Support Zone!🔎 Market Structure & Pattern
Since May 2025, PARTI has been trading within a clear descending channel, forming consistent lower highs and lower lows.
Current price is around 0.187 USDT, sitting near the channel mid-line and close to the upper trendline resistance.
A key support zone lies between 0.14–0.16 USDT, which has historically acted as a strong demand area.
This setup often suggests a continuation of the bearish trend, but it can also turn into an accumulation pattern if a breakout occurs.
---
🟢 Bullish Scenario
Bullish potential will be unlocked if the price breaks out of the descending channel.
Breakout confirmation: Daily close above the upper trendline and above 0.2094 USDT.
Upside targets:
🎯 0.2094 → breakout trigger
🎯 0.2372 → intermediate resistance
🎯 0.2626 → short-term swing target
🎯 0.3072 → main breakout target
🎯 0.3798 – 0.4382 → major resistance zone (over 100% upside from current levels if confirmed)
Key factor: Breakout must be supported by increasing volume, otherwise it risks being a fake breakout.
---
🔴 Bearish Scenario
If the price fails to break out and gets rejected at the channel resistance:
Bearish confirmation: Rejection at the upper trendline or failure to hold above 0.187 / 0.16.
Downside targets:
🕳️ 0.16 → first support
🕳️ 0.14 → lower edge of key support zone
🕳️ A breakdown below 0.14 could lead to 0.10 – 0.12 USDT, the next potential demand zone.
A strong breakdown with volume would confirm continuation of the bearish trend.
---
📌 Key Technical Levels
Main Support: 0.14 – 0.16 (critical demand zone)
Key Resistance: 0.2094 (bullish trigger)
Upside Targets: 0.2372 | 0.2626 | 0.3072 | 0.3798
Bullish Invalidation: Daily close below 0.14
---
🧠 Conclusion & Bias
Currently, PARTI remains in a downtrend within the descending channel. However, price is approaching a decision zone at the key support (0.14–0.16).
If support holds + breakout occurs: A bullish reversal toward 0.237 / 0.262 / 0.307 is possible.
If support fails: Expect continuation of the bearish trend, targeting 0.12 or even lower.
👉 This is a critical decision point for PARTI — the next move will confirm whether we see a bullish reversal or a bearish continuation.
#PARTI #Crypto #TechnicalAnalysis #DescendingChannel #Breakout #BearishTrend #BullishReversal #PriceAction #SupportResistance #Altcoins #CryptoAnalysis
SUI : Heavy fall or stunning growth!Hello friends
Given the good growth we had, the price has pulled back well and has managed to hold itself well in the specified support area.
Now, given the lack of decline and weakening of sellers, we must wait for the reaction of buyers to see whether they will support the price in the support areas or not?
Given the good conditions of the currency pair, I buy in steps in the support areas and move with it to the specified goals, with capital and risk management.
*Trade safely with us*

SHELLUSDT —Accumulation Phase or Breakdown?📌 Overall Chart Overview
Currently, SHELLUSDT is trading within a Descending Triangle pattern on the daily timeframe. This structure is characterized by lower highs pressing down through a descending trendline, while the bottom side is being defended by a strong demand zone at 0.13 – 0.15 (yellow box).
This setup signals that the market is in a tug-of-war phase: sellers are consistently applying pressure, yet buyers are still holding the line at support. The outcome of this compression will likely lead to a major move in the coming weeks.
---
🔼 Bullish Scenario (Breakout)
If the price manages to close above 0.15 and break through the descending trendline:
It would confirm a bullish breakout, signaling the potential start of a short-term trend reversal.
Upside targets to watch:
T1: 0.2047 (minor resistance)
T2: 0.2275 – 0.2400 (supply zone)
T3: 0.2600 (psychological resistance)
Extension: 0.3301 (major level, opening the path toward 0.5941 in the mid-term).
A valid breakout usually comes with a surge in volume, so volume confirmation will be key.
---
🔽 Bearish Scenario (Breakdown)
On the other hand, if price fails to hold the 0.13 – 0.15 zone and we see a daily close below 0.13:
The Descending Triangle would be confirmed as a bearish continuation pattern.
Downside targets:
T1: 0.1200
T2: 0.1077 (previous major low)
Extension zone: 0.1000 – 0.0960 (psychological levels).
This would highlight seller dominance and potentially extend the downtrend further.
---
📊 Additional Insights
Volume & Momentum: Volume is currently flat, reflecting indecision. A spike in volume will likely be the early signal of a major move.
Sentiment: A breakout would turn this demand zone into a golden accumulation area for buyers. A breakdown, however, would act as a trap for weak longs.
Risk Management: Waiting for a daily candle close beyond 0.13–0.15 is the safest approach to avoid fakeouts.
---
✨ Conclusion
SHELLUSDT is at the apex of its Descending Triangle, and the 0.13 – 0.15 range is the critical battle zone. A breakout above 0.15 opens the door for a trend reversal toward 0.20 – 0.26, while a breakdown below 0.13 could drag price down to 0.1077 or even lower.
Traders should remain patient and wait for clear confirmation before committing to an aggressive position. The current market is in a “wait and see” phase, and a powerful move is likely coming soon. 🚀📉
#SHELLUSDT #CryptoAnalysis #Altcoin #PriceAction #TechnicalAnalysis #DescendingTriangle #SupportResistance #BullishBreakout #BearishBreakdown #CryptoTrading #RiskManagement

#sui usd#sui could go a bit lower, it could crash to $0 but it seems to have the strength not to fail this bull run… The goal is to hit at least 7 by end of year…. I would guess mid November we will see the top

BRETT/USDT — End of Consolidation, Beginning of a Big Move?BRETT/USDT is currently forming a symmetrical triangle pattern on the Daily timeframe (1D). This structure is shaped by lower highs (selling pressure) and higher lows (buying pressure), which are now converging near the apex zone (0.049–0.064). As price approaches the tip of the triangle, volatility often expands sharply, leading to a major directional breakout.
---
🔹 Pattern & Key Levels
Pattern: Symmetrical Triangle (neutral — can break either way).
Strong Support: 0.045 – 0.049
Key Resistance: 0.064
Major Horizontal Levels:
0.091 → mid resistance
0.115 → strong resistance
0.152 → psychological zone
0.211 – 0.236 → previous highs
Lower Supports: 0.037 / 0.031 / 0.026 / 0.023
---
🚀 Bullish Scenario
1. Breakout confirmation if daily close happens above 0.064 with strong volume.
2. A successful retest of 0.064 as support will further strengthen the bullish setup.
3. Upside targets:
TP1 = 0.091
TP2 = 0.115
TP3 = 0.152
Measured move projection (long-term potential) = ~0.277
4. Stop-loss idea: below 0.049 or under the lower trendline.
---
🔻 Bearish Scenario
1. Breakdown confirmation if daily close happens below 0.045.
2. Failed retest of 0.045–0.049 as resistance would confirm further downside.
3. Downside targets:
TP1 = 0.037
TP2 = 0.031
TP3 = 0.026
Final strong support = 0.0234
4. Stop-loss idea: above 0.058–0.064 (upper trendline zone).
---
⚖️ Conclusion
BRETT/USDT is approaching a critical decision zone. The symmetrical triangle shows market compression — pressure is building up for a powerful breakout.
A bullish breakout above 0.064 could fuel a rally toward 0.091 – 0.152 and potentially higher.
A bearish breakdown below 0.045 may trigger a correction toward 0.026 – 0.023.
Best strategy: Wait for breakout confirmation with daily close + volume, apply strict stop-losses, and take profits step by step at key levels.
#BRETTUSDT #BRETT #AltcoinAnalysis #CryptoBreakout #TechnicalAnalysis #SymmetricalTriangle #ChartPattern #CryptoTA #SupportResistance

Futures · A New Opportunity · Asymmetric Risk-Reward · HaedalOpportunities are endless. Let me show you.
HAEDALUSDT we traded before once already and the trade-numbers were a success. This is good because if we can see it go up once, we can do it again. Market conditions are very similar to what they were before the previous jump. All the signals are present for a new higher high jump.
Is the timing right? —Let's ask the chart.
A low in June leads to sideways and then a bullish jump. The bullish jump shows up only when HAEDALUSDT moves above EMA34 (green).
Present day HAEDALUSDT produced a higher low in August vs June. The action is moving just today above EMA34 and this is the signal we've been waiting for.
Since we have a higher low, we can expect at least a higher high on this upcoming bullish jump. I am sure the market will move much higher, but this is the minimum. The higher the better for sure.
Our job is to spot the right entry at the right time. Buy low before prices jump. Buy patiently when prices are trading near support. These conditions are present on this chart setup. Some can change in a flash though and cause a loss.
Let's talk a little bit about losses.
There is a lot to lose and there is high frequency of losing. This is normal. If you open a position with 5% of your capital and lose 100% of the position, you still have plenty of capital left to continue trading.
Losing is not wrong. You only need to protect yourself from losing everything or losing big. We cap our risk.
Our losers we try to keep them small and our winners big. Something like asymmetric risk/reward. A small loss if you lose vs a big pay if you win.
If you lose, you only lose that 3% or 5%. If you win, you can get anywhere between 10-20X. When we are talking spot, the range goes between 10-30% per trade. You can lose 3 to 10 times and still be in the game. One win can produce easily 5X, 4X or 10X if the trade is long-term.
Spot, the risk is less but the winners take longer to produce big results. Spot has no stress basically and it is so easy once you learn the basics, that you can't go wrong. This is the way to win for the average person, buy and hold.
As soon as we grow and we are comfortable with our buy and hold, we move to the more advanced tools to increase our risk but also our potential for rewards. You can't go wrong if you only use your profits to grow to the next step.
There is always time. There is no need to hurry, the market is not going away.
If the opportunity is real and yours to take, take the time to prepare. Once your skills are well developed, you can earn money with Crypto long-term. If you rush, you lose and have to try again. If you take your time, you can win big and winners we are all... All those of us who never give up.
Keep trying and go harder.
Never give up.
Go higher.
Namaste.

FUN/USDT — Accumulation at Demand Zone: Rebound or Breakdown?📖 Narrative & Full Analysis
FUN/USDT is currently standing at a critical crossroads. After a strong rally that pushed the price to the recent peak at 0.0248 USDT, the market faced a sharp correction and is now testing the demand zone (0.0075 – 0.0090) — an area that previously acted as major resistance and has now flipped into support.
This is the level that will define the next big move:
Will buyers defend this zone and fuel a new rally?
Or will sellers break through and trigger another deep leg down?
The structure shows accumulation in progress. The sideways consolidation above demand indicates that the market is building momentum, awaiting confirmation for the next direction.
---
📊 Key Technical Levels
📍 Current Price: 0.009467
🟨 Demand Zone (Key Support): 0.0075 – 0.0090
🔑 Upside Resistance / Targets:
0.013887 → first breakout confirmation
0.019766 → mid-term supply zone
0.022897 – 0.024800 → retest of previous highs
⚠️ Downside Risk if Breakdown:
0.0032 → mid-term support
0.001839 → historical low
---
📈 Bullish Scenario
Buyers successfully hold above the demand zone.
A daily close above 0.0139 would confirm bullish momentum.
If momentum builds, FUN could rally in stages: 0.0139 → 0.0197 → 0.022–0.0248.
Bullish strategy:
Accumulate within 0.0075 – 0.0090
Set a stop-loss below 0.0070
Scale out at resistance targets
Potential Reward: From current levels, upside could reach +150% or more if the demand zone holds.
---
📉 Bearish Scenario
If FUN loses the demand zone (daily close < 0.0070), support is broken.
This would open a path for a deeper decline towards 0.0032 and possibly 0.0018.
Bearish strategy:
Aggressive traders could short a confirmed breakdown.
Long-term holders should consider reducing risk or hedging if support fails.
---
🔍 Pattern & Sentiment
Pattern: Base-building / accumulation at demand zone.
Market Sentiment: Neutral-to-bearish in the mid-term, but with reversal potential if demand is respected.
Candlestick signals to watch: Long lower wicks and strong bullish closes from demand → early signs of reversal.
---
🧭 Conclusion & Outlook
FUN/USDT is at a make-or-break zone.
As long as the price holds 0.0075 – 0.0090, the setup favors a rebound with upside potential of +50% to +150%.
A confirmed breakdown below this zone, however, could trigger a 70–80% drop.
🚦This is a golden accumulation area for disciplined traders with tight stops. High risk, but potentially much higher reward.
#FUNUSDT #FUN #Altcoins #Crypto #TechnicalAnalysis #SupportResistance #Breakout #Bullish #Bearish

SEI : LIVE TRADEHello friends
We drew a Fibonacci to get the support area and a Fibonacci for the resistance areas.
Now using support and resistance we can understand where the buy and sell points are.
In this price growth we wait for a pullback and in case of a pullback we can enter a trade in the specified area with risk and capital management and move with it until the specified resistances which are targets.
*Trade safely with us*

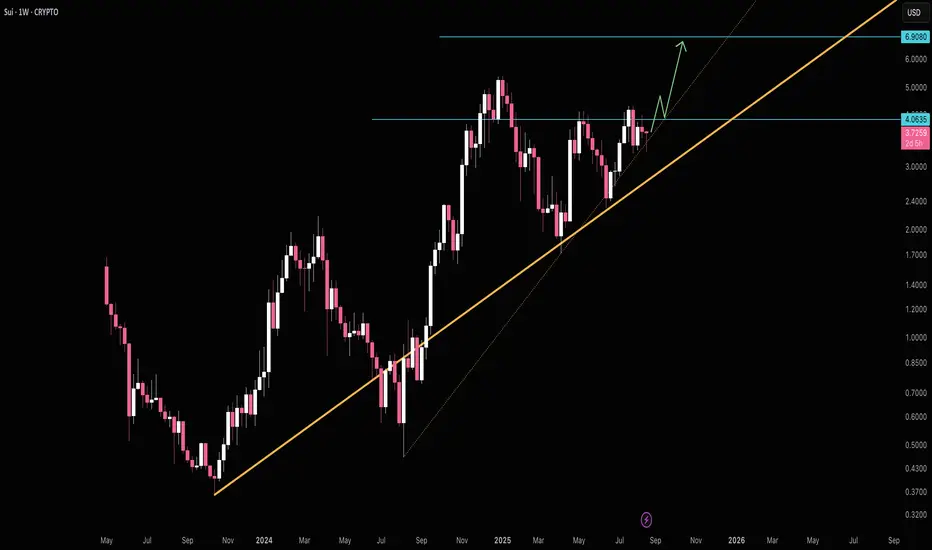
SUI to $6.9SUI's riding the uptrend up to breaking $4 resistance. $6.90 is next major resistance.
Good luck!
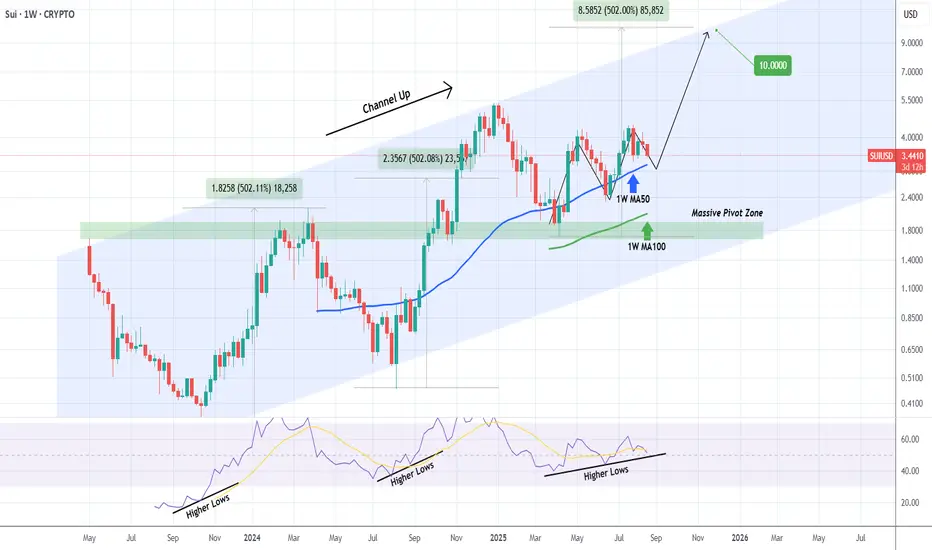
SUIUSD Strong Buy Signal approaching targeting $10.Sui (SUIUSD) has been pulling back lately and is close to its 1W MA50 (blue trend-line).
The long-term pattern is a 2-year Channel Up and since its last Higher High, a break below the 1W MA50 has been the most optimal buy signal technically.
With the 1W RSI already on Higher Lows similar to both previous Channel Up bottoms, we expect the price to start its final strong rally towards the pattern's Top (Higher Highs trend-line) again. Our Target is $10.00.
-------------------------------------------------------------------------------
** Please LIKE 👍, FOLLOW ✅, SHARE 🙌 and COMMENT ✍ if you enjoy this idea! Also share your ideas and charts in the comments section below! This is best way to keep it relevant, support us, keep the content here free and allow the idea to reach as many people as possible. **
-------------------------------------------------------------------------------
💸💸💸💸💸💸
👇 👇 👇 👇 👇 👇
SUI SCALP Long / Buy SetupIt's a scalp setup, don't hold any trade for so long, must use sl and never use more than 2% of your wallet size on SL. Market is risky can take a sharp movement any side, So be careful. Reason for this trade is, it has taken downside SL and didn't close the candle, So we can take the long trade n target early shorters sl. If tp hits first then ignore the trade.

SUI Game Plan - AltcoinSUI Game Plan - Altcoin
📊 Market Sentiment
Overall sentiment remains bullish, supported by expectations of a 0.25% rate cut in the upcoming FOMC meeting. A weakening USD and increasing global risk appetite are creating favorable conditions for further upside in crypto assets.
📈 Technical Analysis
Price was rejected from the broken HTF bullish trendline.
It retraced back to the daily swing demand zone to gather more liquidity.
Price is currently trading below the 0.5 Fibonacci equilibrium level, which I consider a discount zone.
📌 Game Plan
I expect a deeper retracement towards the 4H swing liquidity at $3.45.
Additionally, the 0.75 Fibonacci max discount level aligns with this 4H swing liquidity. Running that liquidity would likely trigger a strong bounce.
🎯 Setup Trigger
I’ll be watching for a 4H break of structure (BOS) to initiate entries.
📋 Trade Management
Stoploss: 4H–1H swing low confirming the BOS
Targets:
TP1: $3.90
TP2: $4.18
TP3: $4.44
💬 Like, follow, and comment if you find this setup valuable!
⚠️ Disclaimer: This content is for informational and educational purposes only and does not constitute financial, investment, or trading advice. Always do your own research before making any financial decisions.

SUI the large cap opportunity. SUI is still within structure; however, moving to the bottom of its range. Momentum and trend oscillators are moving to oversold conditions. In addition, there is still a slight imbalance below that could be filled.

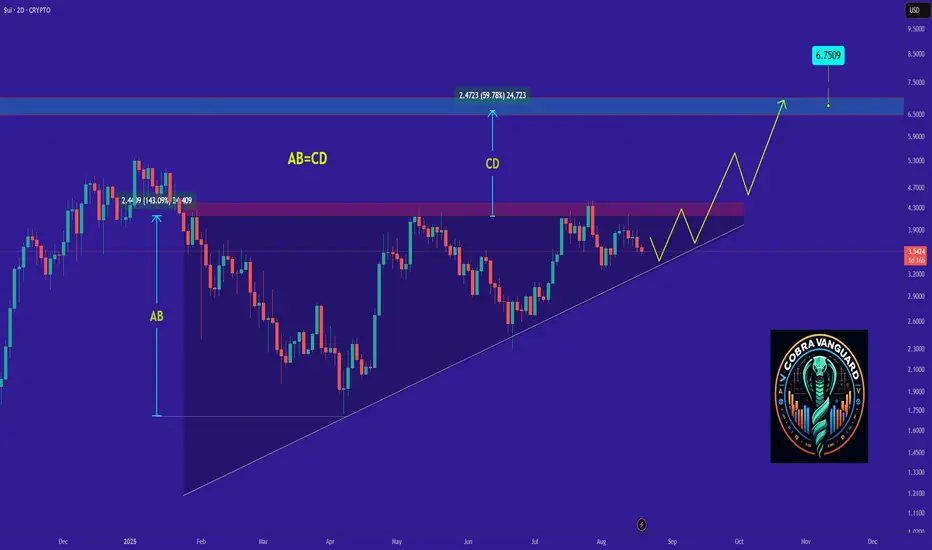
SUI is bullish now and many Traders don't see it !!The price on the 2d timeframe is within an ascending triangle, which can be promising. If the price breaks this pattern with bullish candles, it could easily rise by the distance of AB=CD .
Best regards CobraVanguard.💚