Why Is Crypto Tumbling? A Trader's Guide to the Recent Sell-OffWhy Is Crypto Tumbling? A Trader's Guide to the Recent Sell-Off 📉
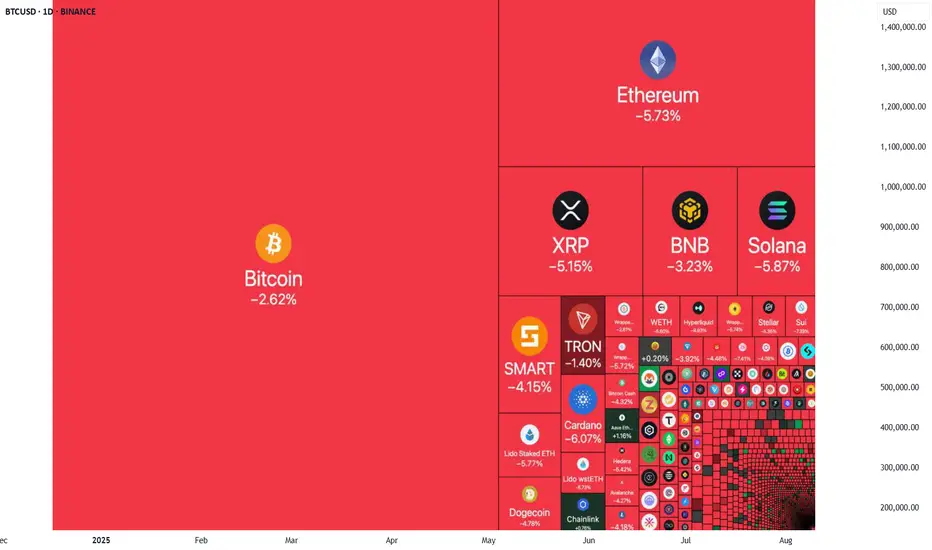
🚨 If you're watching the markets today, you've seen the sea of red. Bitcoin, Ethereum, and major altcoins have experienced a significant pullback, leaving many to wonder about the cause.
While sharp drops can be unsettling, for the strategic trader, they are critical moments to analyze, not to panic. The current downturn isn't random; it's driven by a convergence of clear geopolitical, technical, and macroeconomic factors.
Here’s a breakdown of what’s happening behind the charts:
1. Geopolitical Uncertainty 🌐
High-stakes diplomatic meetings are underway involving the US, EU, and Ukrainian leaders to discuss the Russia-Ukraine peace deal. Markets inherently dislike uncertainty. As traders await a clear outcome, many are de-risking their portfolios, leading to selling pressure on assets like cryptocurrencies.
2. A Healthy Market Reset 📊
The crypto market just came off a powerful rally where many assets saw gains of 50-100%. This rapid rise led to a buildup of high-leverage positions. Today's dip is forcing a "leverage flush," liquidating over-extended traders. While painful for some, this is a standard market mechanism that washes out speculative excess and often creates a more stable foundation for future growth.
3. Shifting Macroeconomic Tides 📉
Just a week ago, a September interest rate cut was seen as a certainty. Now, recent economic data has slightly lowered those odds. Financial markets, including crypto, are incredibly sensitive to central bank policy. The market is now pricing in this small but significant shift in expectations, contributing to the downward pressure.
The Trader's Perspective: Opportunity in Volatility 💡
So, what does this all mean? It underscores a core principle of successful trading: volatility has a source.
For the prepared trader, this isn't a signal to abandon ship. It's a signal to consult your strategy. This is precisely the kind of environment where a clear, data-driven forecast becomes invaluable.
By understanding the root causes of the sell-off, you can better anticipate market structure, manage risk, and identify potential zones of support where "smart money" may begin to re-accumulate.
This is where the difference between a professional and a novice trader becomes clear. Experienced traders welcome every correction or pullback in the market, seeing it as an opportunity to re-enter and profit from the next upward wave. 📈
Therefore, instead of worry and stress, shift your focus to finding key reversal points and defining new entry zones (Watchboxes) for future trades at more attractive prices. View this price correction as a strategic opportunity, not a threat. 🚀
What are your thoughts on this pullback? Are you seeing it as a risk or an opportunity? Let's discuss in the comments. 👇
Trade Smart!
Navid Jafarian
SUI
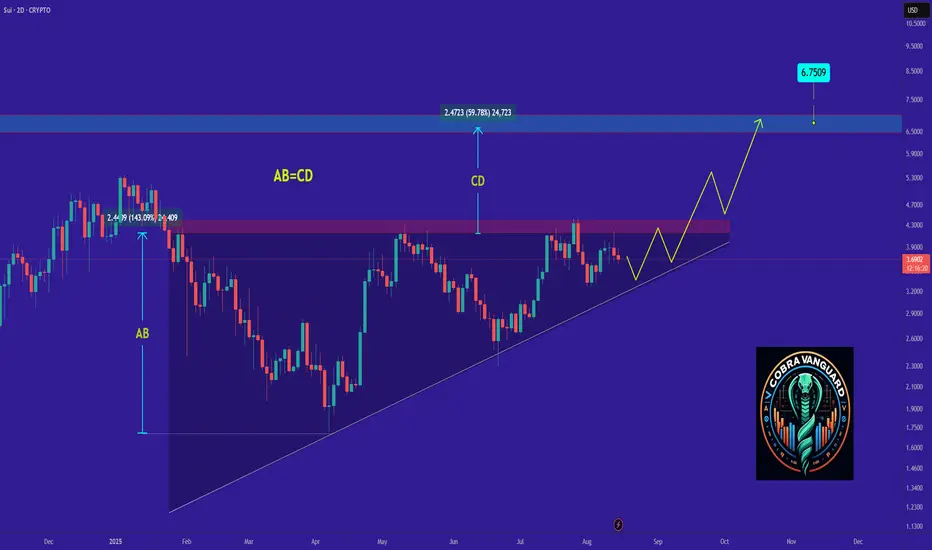
SUI's Situation, A Comprehensive Analysis !!!The price on the 2d timeframe is within an ascending triangle, which can be promising. If the price breaks this pattern with bullish candles, it could easily rise by the distance of AB=CD .
Best regards CobraVanguard.💚
BGB/USDT — Symmetrical Triangle: Breakout or Fakeout?Overview
BGB/USDT is consolidating within a symmetrical triangle pattern (descending resistance + slightly ascending support) as volatility narrows toward the apex. The price is currently around 4.58, after a rejection near the upper trendline — possibly a liquidity grab. This setup usually precedes a strong move once a valid breakout or breakdown occurs.
---
Pattern Explanation
Type: Symmetrical / contracting triangle
Key characteristics: Shrinking volatility, lower highs + higher lows, volume gradually decreasing.
Context: The structure formed after a strong correction from highs, which often implies a continuation bias unless a clear bullish breakout emerges.
---
Key Levels
Current price: 4.58
Near-term resistance: 5.03 → 5.60 → 5.99
Major resistance zones: 7.62 → 8.11 → 8.50 (ATH zone)
Support: Triangle base (dynamic support around 4.0–4.4), then 3.60 and 3.00 if breakdown continues.
---
Bullish Scenario (confirmation required)
Confirmation: Daily close above the upper trendline with strong volume and successful retest.
Entry idea: Conservative entry above 5.03 with retest confirmation.
Targets:
TP1: 5.60
TP2: 5.99
Aggressive: 7.62 → 8.11 → 8.50
Measured move projection: (8.50 − 3.60 = 4.90). Breakout from ~5.03 could project up to 9.93 (theoretical target).
Invalidation: Failure to hold above 5.03 or a rejection back inside the triangle.
Stop-loss: Below retest breakout (~4.40) or below triangle support.
---
Bearish Scenario (confirmation required)
Confirmation: Daily close below triangle support with above-average volume.
Entry idea: Short entry after breakdown + failed retest.
Targets:
TP1: 4.00
TP2: 3.60
TP3: 3.00 (if strong continuation).
Invalidation: Daily close above the upper trendline or reclaim above 5.03.
Stop-loss: Above failed breakout level or triangle resistance.
---
Things to Watch
Volume: Breakouts without volume are often fakeouts.
Retest: Strong confirmation if old resistance turns into new support (bullish) or old support flips into resistance (bearish).
Daily candle close: Wick alone is not reliable; wait for candle close.
Market correlation: BTC and ETH trends may influence BGB’s breakout direction.
---
Risk Management Notes
Limit risk per trade (1–2% capital).
Use scaling entries if breakout is sharp.
Always set stop-loss and take-profit in advance.
Be cautious of false breakouts — triangles often fake one side before moving in the opposite direction.
---
Conclusion:
BGB/USDT is consolidating in a symmetrical triangle, signaling a potential big move ahead. For bulls, watch for a close above 5.03 with volume. For bears, confirmation comes with a close below triangle support. Until then, the setup remains neutral.
> Disclaimer: This is not financial advice. Do your own research and manage risk accordingly.
#BGBUSDT #CryptoAnalysis #TechnicalAnalysis #SymmetricalTriangle #Breakout #SupportResistance #SwingTrade

SUI Setup – Support Zone Long OpportunitySUI, with its smaller market cap compared to majors like ETH, BTC, and SOL, remains more sensitive to market swings. Price has now retraced into a key support zone, offering a potential long entry for the next upside leg.
Trade Setup:
• Entry Zone: $3.40 – $3.60
• Take Profit Targets:
🥇 $4.00 – $4.20
🥈 $5.00 – $5.20
• Stop Loss: $2.90

WALUSDT — Breakout or Breakdown? Golden Pocket the Key!Quick Context: Since May, price has formed a series of lower highs connected by a descending trendline (yellow). Beneath it lies a strong demand zone at 0.406–0.420, aligning with Fibonacci 0.5 (0.419) and 0.618 (0.407) — the golden pocket. Current price is around 0.435, pressing against the trendline and approaching the apex of the pattern.
Pattern & Key Levels
Main Pattern: Descending Triangle (downward-sloping top, relatively flat base/zone). Theoretically slightly bearish, but since it sits right on the golden pocket with compression, the probability of an impulsive breakout in either direction is high.
Major Demand / Support: 0.406–0.420 (golden pocket + base).
Immediate Resistance: descending trendline + 0.44–0.46 area.
Next resistance targets (yellow dashed lines): 0.484 → 0.542 → 0.674 → 0.732.
Downside supports if broken: 0.380 → 0.350 → 0.296.
Bullish Scenario
1. Confirmation: Daily close above the trendline and ideally > 0.460 (clear breakout confirmation).
2. Healthy Retest: Pullback to 0.44–0.46 / trendline, now acting as support.
3. Step Targets:
T1: 0.484
T2: 0.542
T3: 0.674
T4: 0.732
4. Bullish Invalidation: Daily close back below 0.420; strong invalidation if < 0.406 (loss of golden pocket).
Bearish Scenario
1. Rejection: Fails to break 0.44–0.46 / trendline and turns down.
2. Weakness Confirmation: Daily close below 0.406 (loss of base + golden pocket).
3. Downside Targets:
S1: 0.380
S2: 0.350
S3: 0.296
4. Bearish Invalidation: Daily close above 0.460 with a successful retest flips bias to bullish.
Execution Notes
Apex Break: The closer price gets to the apex, the higher the risk of false breaks — always wait for a daily close to confirm.
Volume: A valid breakout should be accompanied by increasing volume.
Risk Management: Place stops beyond the invalidation zones of your chosen scenario (below 0.406 for breakout longs; above 0.460 for rejection shorts).
> Summary: WALUSDT is being squeezed between the descending trendline and golden pocket 0.406–0.420. A daily close above 0.460 could open the path to 0.484/0.542, while a breakdown below 0.406 may trigger a drop towards 0.380–0.350.
Not financial advice; purely for educational and technical reference.
#WALUSDT #Walrus #CryptoTA #PriceAction #DescendingTriangle #Fibonacci #SupportResistance #Breakout #RiskManagement

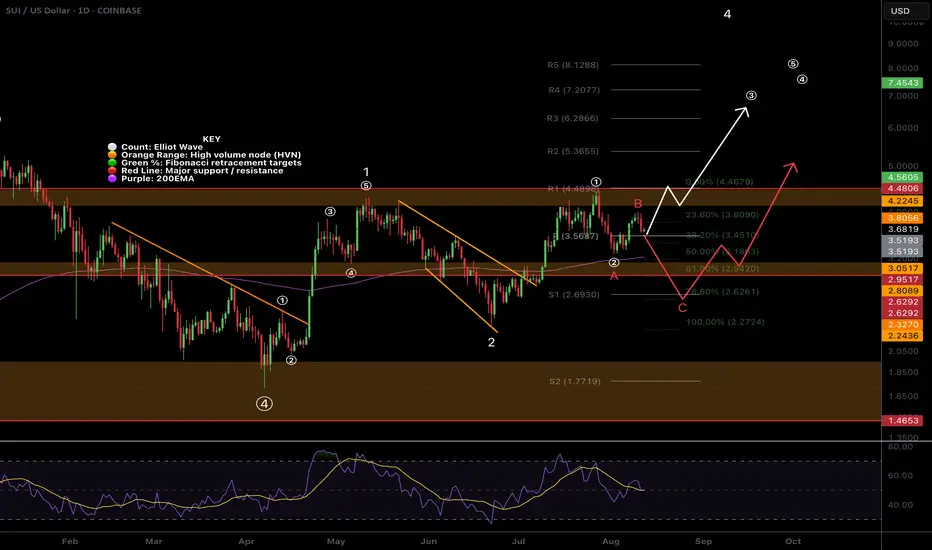
$SUI Short term bearish move coming?CRYPTOCAP:SUI is currently testing the daily pivot as support which must hold to keep the bullish count alive.
I have 2 Elliot Wave counts, short term bullish and bearish that I am patiently waiting to see unfold. Long term is still bullish.
The white count suggests that we have printed a micro wave (1) and are completing a wave (2) now at the daily pivot just above the daily 200EMA where price should move powerfully in a wave (3) of 3 upwards.
Alternatively, the red count, wave B of a larger corrective could also be complete at the recent swing high and losing the pivot and daily 20EMA would confirm this. Wave C has an initial target of the triple support 0.618 Fibonacci retracement, daily 200EMA and major support High Volume Node at $3 to complete wave 2 and a secondary target of the alt-coin golden pocket 0.786 Fibonacci retracement and S1 daily pivot at $2.7
The bearish analysis is my preferred count due to the amount of confluence, including the fact we are entering mid August and this move would also push daily RSI back into oversold.
This would set up new long signals so look out for those in the Substack Trading Signals
Safe trading
BMT/USDT – Major Rebound Potential from Accumulation Zone?🔍 Overview
BMT/USDT is currently trading at a critical support zone after a prolonged downtrend from the local peak at 0.32529. The 0.075 – 0.083 range, highlighted in yellow, has acted as a strong price defense area from March to August 2025.
The structure indicates a potential reversal pattern if the price can break above key resistance levels.
---
📈 Pattern & Technical Structure
Main Pattern: Potential Double Bottom or Accumulation Base on the daily chart.
Key Support:
Accumulation zone: 0.07500 – 0.08277
Final support: 0.06934 (lowest price of the year)
Layered Resistance Levels:
R1: 0.09637 → First psychological resistance
R2: 0.12859 → Short-term profit-taking area
R3: 0.14472 → Mid-term resistance
R4: 0.16288 → Major resistance before a strong rally
R5: 0.27013 → Long-term bullish target
---
🚀 Bullish Scenario
If the price breaks and sustains above 0.09637 with significant volume:
Short-term target: 0.12859 (+55% from current price)
Mid-term target: 0.14472 – 0.16288 (+74% to +96%)
Long-term major breakout target: 0.27013 (+226%)
Additional Confirmation:
RSI climbs above 50 and continues to strengthen
MACD forms a golden cross
Gradual increase in buying volume
---
⚠️ Bearish Scenario
If the price fails to hold above 0.075 and breaks 0.06934:
Potential downside targets:
S1: 0.06500 (-21%)
S2: 0.05700 (-31%)
Additional Confirmation:
Surge in selling volume
Daily candlestick closes below 0.06934
RSI breakdown below 40
---
🎯 Strategy & Risk Management
Buy at Support Strategy:
Entry at 0.082 – 0.083, SL below 0.06934, Target 0.12859 → Risk:Reward ± 3.4
Breakout Buy Strategy:
Entry after daily close above 0.09637, SL below 0.082, Target 0.14472 → Risk:Reward ± 2.24
---
📌 Conclusion
BMT/USDT is at a make-or-break zone: a successful breakout could trigger a strong rally, while a breakdown would extend the bearish trend. This is a decision point for swing and position traders to monitor closely.
#BMTUSDT #CryptoAnalysis #Altcoins #TechnicalAnalysis #PriceAction #Crypto #BreakoutTrading #SupportResistance #CryptoSignal #AltcoinSeason

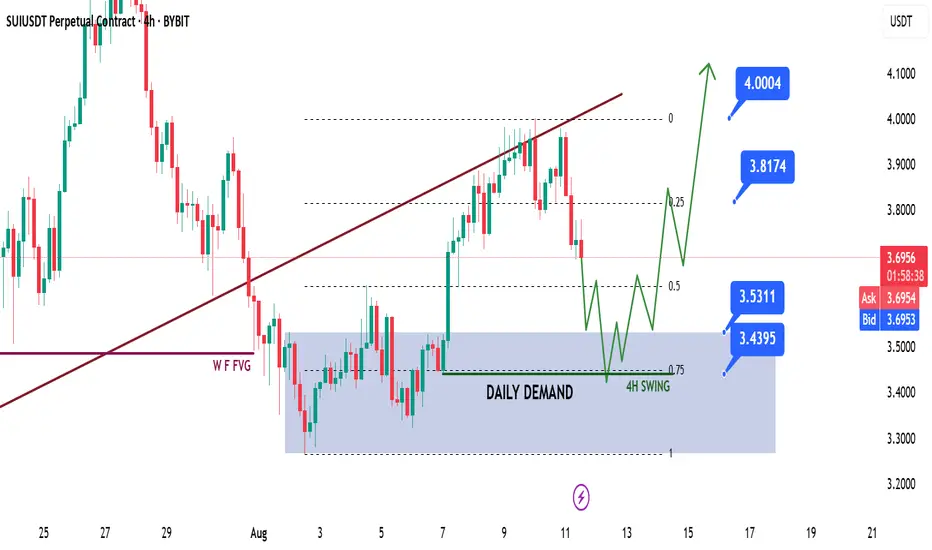
SUI | SUI Network Swing Long IdeaSUI | Swing Long Idea
📊 Market Sentiment
Overall sentiment remains bullish, supported by expectations of a 0.25% rate cut in the upcoming FOMC meeting. A weakening USD and increased risk appetite across global markets are creating favorable conditions for further upside in crypto assets.
However, tomorrow’s CPI data is a key risk event for markets. It will be released at 08:30 AM NY local time, and could cause notable volatility across risk assets.
📈 Technical Analysis
Price began a retracement after a strong bullish expansion.
The move deepened following a break of the bullish trendline.
Price bounced from the Weekly Fair Value Gap (W-FVG) and retested the broken trendline, only to face rejection again.
This suggests price may still want to head lower to collect liquidity before continuing higher.
📌 Game Plan
Primary watch level: Daily demand zone (blue box) at $3.53.
This level could be enough to spark continuation higher, but ideally I’d like to see the 4H swing liquidity at $3.44 taken out first to strengthen the setup.
🎯 Setup Trigger
Wait for a 4H break of structure after the game plan levels are met.
📋 Trade Management
Stoploss: 4H swing low that caused the break of structure
Targets:
TP1: $3.81
TP2: $4.00
TP3: $4.44
Will trail stops aggressively to secure profits as the trade moves in my favor.
💬 Like, follow, and comment if this breakdown supports your trading! More setups and market insights coming soon — stay connected!
ME/USDT (2D) — Last Stand at the Support Zone!ME/USDT is now at a make-or-break moment. After a prolonged downtrend since the start of the year, price action has formed a Descending Triangle — a combination of a falling trendline pressing down from above and a strong horizontal support between 0.65 – 0.85 USDT.
📌 Why this zone matters:
This yellow zone has repeatedly absorbed heavy selling pressure.
A breakdown below it could open the door to a much deeper fall.
Conversely, a breakout above could be the first sign of a trend reversal.
---
🔍 Pattern Analysis
Descending Trendline Resistance
Every rally attempt since the yearly top has been capped by this dynamic resistance, keeping lower highs intact.
Horizontal Support Zone (Yellow Box)
This area acts as the “last wall” for buyers. While it holds, the bullish case is alive.
Descending Triangle Structure
Statistically, this pattern tends to break down if formed after a strong downtrend — but in crypto, sudden sentiment shifts or fundamentals can flip the script.
---
📈 Bullish Scenario
1. Strong Breakout: A 2D candle close above the descending trendline and 0.98 USDT.
2. Successful Retest: Price retests the breakout zone and holds above it.
3. Upside Targets:
Target 1: 1.214 USDT (+57%)
Target 2: 1.921 USDT (+149%)
Extended Target: 2.699 USDT if momentum surges.
4. Volume Confirmation: Without strong volume, breakouts risk being fakeouts.
---
📉 Bearish Scenario
1. Breakdown: A 2D candle close below 0.65 USDT (bottom of the support zone).
2. Failed Retest: Price attempts to reclaim support but gets rejected.
3. Downside Targets:
Initial Target: 0.50 USDT
Extreme Target: 0.30 USDT (lowest point shown on chart).
4. Acceleration Risk: Strong volume + weak market sentiment can accelerate the drop.
---
📊 Key Levels to Watch
Resistance: 0.98 | 1.214 | 1.921 | 2.699 | 5.416
Support: 0.65 (major) | 0.50 | 0.30 (extreme low)
---
💡 Trader’s Notes
Descending triangle + strong support = high-stakes setup.
Wait for confirmed 2D candle closes and volume spikes before entering.
Always manage risk with clear stop-loss levels & proper position sizing (risk < 2% capital).
Watch for news catalysts or shifts in broader market sentiment.
#ME #MEUSDT #Crypto #TechnicalAnalysis #DescendingTriangle #Support #Resistance #Breakout #Breakdown

SUI – Ready to Drop from the $3.96 Supply WallSUI has rallied right into a key confluence area — the strong supply zone & bearish order block at $3.90–$4.00, which also aligns perfectly with the descending channel’s upper boundary.
📌 Bearish Scenario (preferred):
If price shows rejection at this zone and breaks below $3.85, a corrective move toward $3.55–$3.60 is highly probable, with potential extension toward $3.35 demand zone.
📌 Invalidation:
A 4H candle close above $4.05 would invalidate the short setup and open the door for a continuation toward $4.25+.
💡 Note: Confluence of channel resistance + supply OB + psychological $4 level makes this a high-probability short area. Watch for lower-timeframe BOS or liquidity sweep before entering.

SUI/USDTTesting/tracking Elliot wave.
SUI/USDT weekly chart
Sui might be in this super cycle wave. Possible wave 3 top is around $20
Sub cycle wave top is at $8
Pullbacks are on the chart and I’ve tried to place them where I think it’ll happen. While Elliot waves cannot tell you when price targets will hit, I’ve lined them up to market cycles of potential corrections.

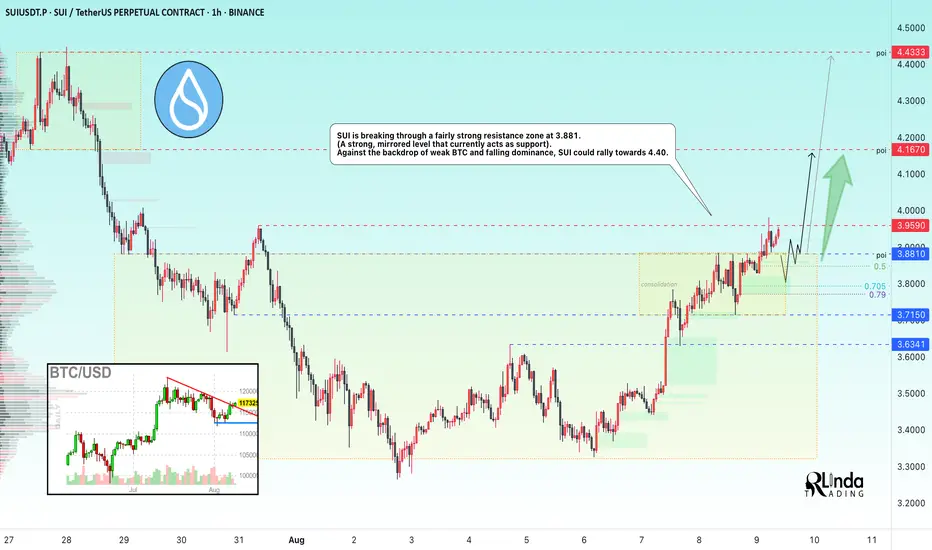
SUIUSDT → Resistance breakout and entry into the buying zoneBINANCE:SUIUSDT is breaking out of its trading range and local consolidation upward. Consolidation above the mirror level could trigger a continuation of the rally to 4.4 - 5.0.
Bitcoin has been trading in the red since the start of Saturday's session, but is gradually recovering. At this time, the altcoin market is rallying, while the Bitcoin dominance index is updating its decline
As for SUI, the coin is in a bullish trend both locally and globally, but ahead lies the 4.45 barrier, which separates the price from a rally to ATH. The coin is breaking through a fairly strong resistance zone at 3.881. (A strong, mirror level, which currently acts as support).
Resistance levels: 3.959, 4.167
Support levels: 3.881, 3.715
Since the price has entered the buying zone, there is a possibility of a retest of the mirror level and the liquidity zone that has formed below the specified support. If the bulls hold their defense above 3.88 - 3.9, then in the short and medium term, the price could show good growth...
Best regards, R. Linda!
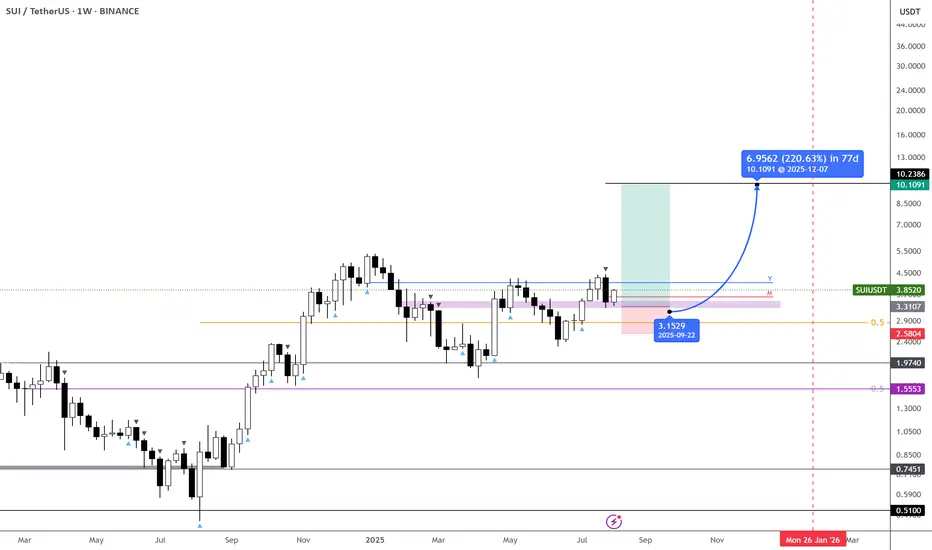
Long Signal on $SUI - $10 incoming?Sure, it’s been lagging compared to some other caps—but we finally have a strong monthly signal.
Constructive price action above the $3.30 pivotal zone makes this one a lot more appealing. It’s also setting up for a third attempt at $4, the last major level before a new ATH. Once this supply zone is cleared, the path toward double digits opens up.
Overall, BINANCE:SUIUSDT is one to keep on the list if you’re looking to play it a bit less aggressively over the coming months.
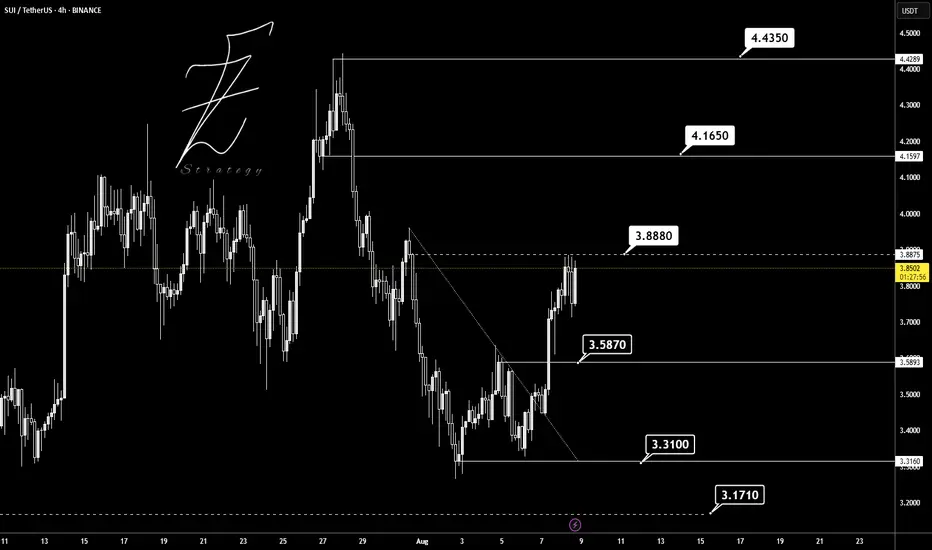
SUIUSDTI think will be bullish BINANCE:SUIUSDT if breaks above 3.88 $ and reach to 4.16 and 4.43 as the next target.
Supports: 3.58 - 3.31 - 3.17
Resistance: 3.88 - 4.16 - 4.43
Please control risk management ⚠️
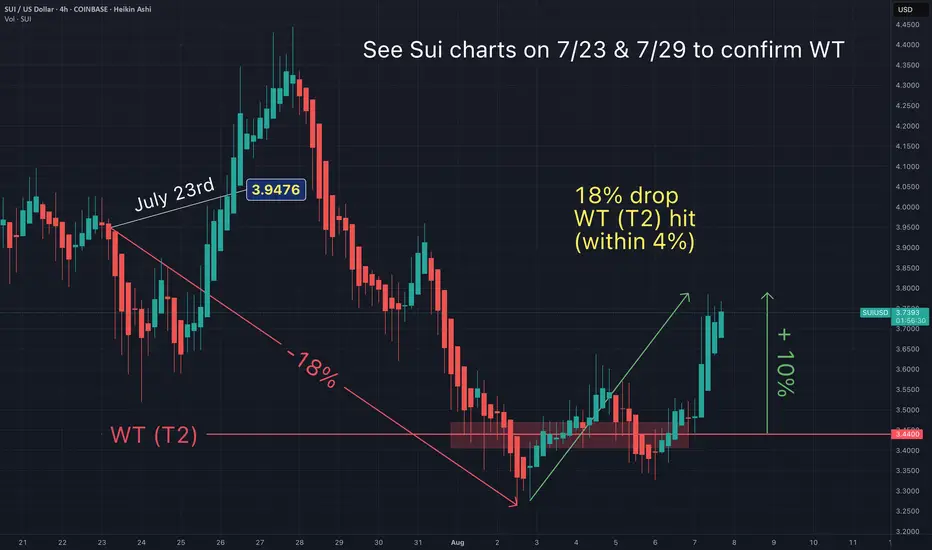
You will ask yourself "how did he know Sui would do that"?Here's a simplified summary of my prediction made on 7/23 & 7/29 for my ideal entry.
Feel free to review my Sui charts on those days to confirm.
I keep stats on my accuracy and so should you.
How else would you know what influencer to actually follow?
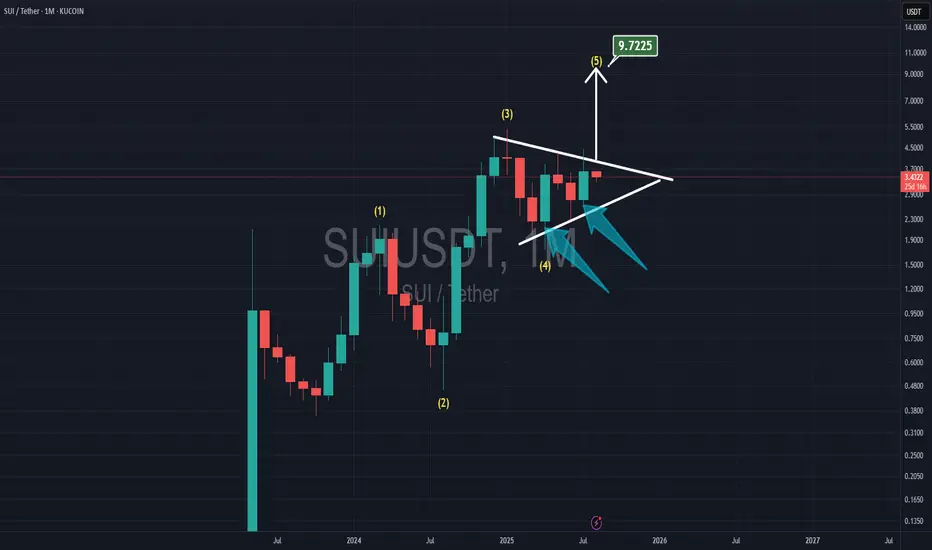
SUI TO $10.00With Elliot waves count, now SUI is in the 5th wave.
It has 2 bullish monthly candles for April & July, and SUI is playing inside the triangle which shows me with the breakthrough the resistance, the target is at $10
Can SUI end the year at over $10?Sounds wild sitting here in August.
But those are the type pf moves possible on a new cycle blockchain entering the last parabolic run of the 4 year cycle.
Now we are still unsure when this cycle will end?
Q4 of 2025 or does extend April/May of 2026.
Either way SUI has potential of compressed price action, waiting for #ETH to break above $4100 is probably going to be the trigger that starts the party.

Where could Bitcoin and the rest of the market be headed?Just a brief overview of my thoughts on bitcoin and the rest of the market. We are currently sitting around the area that I had suspected may be our weekly low. Where we go from here is still unclear but I wanted to take time for a good overview and share my plans and how to trade it so that I could still be profitable even if we just chop for a while. Also, the potential for a true alt season may really be right around the corner. This is the type of term that has been thrown around so much lately but it has been years since we have had one. Alts have been lagging so I have some suspicion of what may happen next and share the things to look for to confirm this, and how I plan to trade accordingly.

Sui bounce off my T2 now confirmed. Heading lower to my T3?On Aug 1st I wrote:
"I hope my T3 doesn't hit (after this next bounce)."
Now that the bounce off my T2 has been confirmed, I've become cautious.
I hope I'm wrong about Sui (and alts) going lower, for the bulls sake.
Sui may bottom when Eth does around $2950 (see my Eth "Descent" chart)
May the trends be with you.

SUI Swing Buy / Long SetupSui is on Strong and decision Order block on 1 day Timeframe, If we break this then SUI will take correction till recent weekly low. If we hold this then new ath. Book some or 80% on mentioned area, rest hold till 6$.

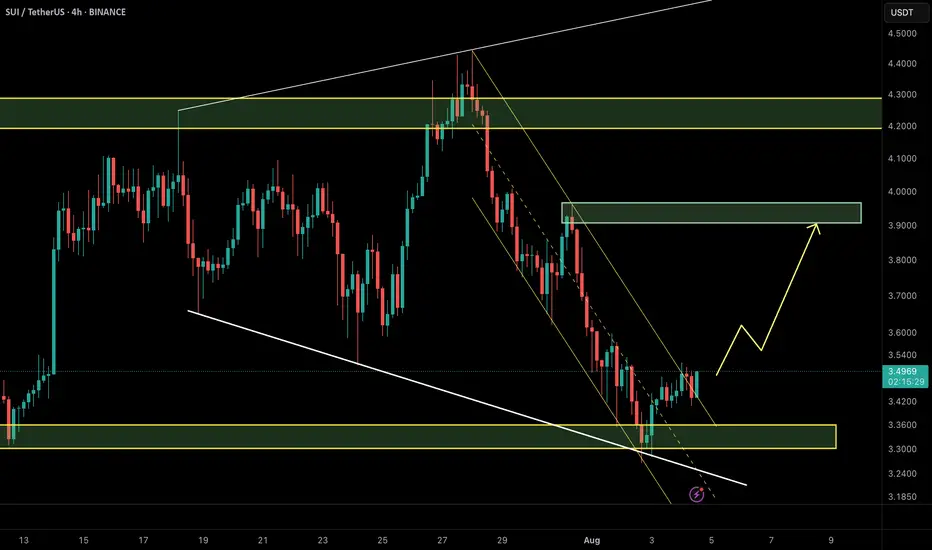
SUI/USDT – Price Outlook (2H TF)🔍 Updated Aug 4, 2025 | SMC + NeoWave
SUI has broken out of the descending channel and is currently holding above the strong demand zone around $3.35–$3.40. This zone overlaps with a bullish order block and prior trendline support.
📌 Bullish Scenario (preferred):
Price confirms support → Push toward $3.90–$4.00 supply zone.
📌 Invalidation:
A close below $3.35 invalidates the setup and suggests continuation of the correction.
💡 Tip: A breakout of structure (BOS) + mitigation of OB = solid confluence for long setups.
SUI | Sui Network - Swing Long Idea - Altcoin
📊 Market Sentiment
Market sentiment remains bullish, supported by expectations of a 0.25% rate cut at the upcoming FOMC meeting. The weakening USD and rising risk appetite across global markets are favoring crypto assets in particular.
📈 Technical Analysis
SUI recently gained bullish momentum, largely following Bitcoin's strength.
We’re now seeing a healthy retracement, which is expected after a strong move.
The break of the LTF bullish trendline suggests potential for a deeper pullback toward HTF confluence zones.
📌 Game Plan
I'm eyeing the HTF demand zone around $3.06, which aligns with the 0.5 Fibonacci retracement—a key discount zone.
Just below this, we also have a higher time frame bullish trendline, which could offer dynamic support.
These overlapping levels provide a strong confluence for a swing long idea.
🎯 Setup Trigger
I’ll wait for a 4H bullish break of structure and the formation of an LTF demand zone before entering.
📋 Trade Management
Stoploss: Below 4H demand swing low
Target: Up to $4.44
I’ll trail my stop to lock in profits aggressively along the way.
💬 Like, follow, and comment if this breakdown supports your trading!
More setups and market insights coming soon — stay connected!

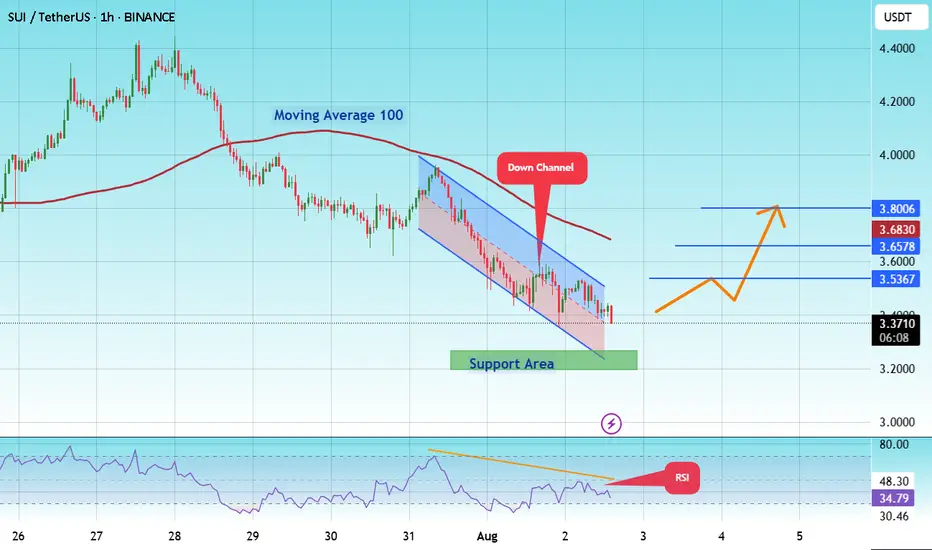
#SUI/USDT Update – Bounce Setup from Demand Zone?#SUI
The price is moving within a descending channel on the 1-hour frame and is expected to break and continue upward.
We have a trend to stabilize above the 100 moving average once again.
We have a downtrend on the RSI indicator that supports the upward break.
We have a support area at the lower boundary of the channel at 3.27, acting as strong support from which the price can rebound.
We have a major support area in green that pushed the price higher at 3.20.
Entry price: 3.38
First target: 3.58
Second target: 3.65
Third target: 3.80
To manage risk, don't forget stop loss and capital management.
When you reach the first target, save some profits and then change the stop order to an entry order.
For inquiries, please comment.
Thank you.