#SUI/USDT – Bullish Triangle Breakout Confirmed | Resistance#SUI
The price is moving within a descending channel on the hourly timeframe. It has reached the lower boundary and is heading towards a breakout, with a retest of the upper boundary expected.
The Relative Strength Index (RSI) is showing a downward trend, approaching the lower boundary, and an upward bounce is anticipated.
There is a key support zone in green at 1.76, and the price has bounced from this level several times. Another bounce is expected.
The RSI is showing a trend towards consolidation above the 100-period moving average, which we are approaching, supporting the upward move.
Entry Price: 1.81
First Target: 1.85
Second Target: 1.90
Third Target: 1.94
Stop Loss: Below the green support zone.
Remember this simple thing: Money management.
For any questions, please leave a comment.
Thank you.
Suianalysis

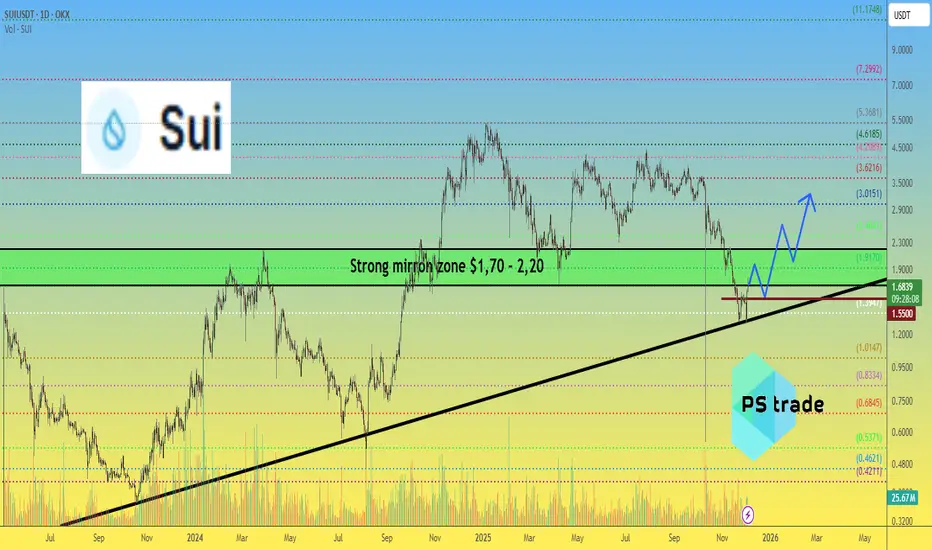
SUI price Update — Double Bottom & Next Targets📉 In November, the price of CRYPTOCAP:SUI was saved twice right at the edge — perfectly on the trendline support, forming a classic double bottom.
📈 Yesterday we finally saw the effect: a strong +30% pump, and the full technical target of this pattern points directly toward $2.
But what comes next is where it gets interesting:
🔹 Buyers must not allow OKX:SUIUSDT to drop below $1.55 — that’s the critical structural level.
🔹 Then CRYPTOCAP:SUI needs to break out and firmly hold above the mirror zone at $1.70–2.20.
🔹 And afterward… it must push through $3, opening the road to much bigger levels.
🎯 Just a few “simple” steps 😄 — and the pathway toward $7, or even $11, becomes fully realistic for #SUI.
🤔 What do YOU think: is CRYPTOCAP:SUI entering its next expansion phase?
______________
◆ Follow us ❤️ for daily crypto insights & updates!
🚀 Don’t miss out on important market moves
🧠 DYOR | This is not financial advice, just thinking out loud
SUI is on the verge of another rally (4H)From the point where we marked the green arrow on the chart, a bullish phase has started on SUI. This area acted as a key reaction zone where buyers stepped in decisively, shifting market sentiment from corrective to bullish.
Based on the current price structure, it appears that we are developing an ABC corrective pattern. In this structure, Wave B has formed as a triangle, which is a common consolidation pattern before continuation. The triangle suggests decreasing volatility and balance between buyers and sellers before the next impulsive move.
At the moment, price action indicates that we are still inside Wave B, with one final sub-wave remaining wave “e” of the triangle. Once this last leg of the triangle is completed, the corrective phase should be fully exhausted.
After the completion of this final wave, the market is expected to resume its bullish move in the form of Wave C, which typically unfolds as a strong impulsive rally. This next move should bring expansion in both momentum and volume compared to the corrective structure we are currently seeing.
To manage risk and execution efficiently, two entry zones have been clearly marked on the chart, and positions should be built using a DCA (Dollar-Cost Averaging) approach rather than a single entry. This allows better positioning in case of short-term volatility during the end of Wave B.
The projected targets for Wave C are also outlined on the chart, based on classical Elliott Wave projections and prior market structure. These levels represent logical areas where partial or full profit-taking can be considered.
⚠️ Invalidation:
This analysis will be invalidated if a candle closes below the marked invalidation level. A confirmed close below that level would indicate that the current wave structure is no longer valid and that the market may be transitioning into a different scenario.
As always, this setup is based on technical structure and probability, not certainty. Proper risk management is essential.
If you have a coin or altcoin you want analyzed, first hit the like button and then comment its name so I can review it for you.
This is not a trade setup, as it has no precise stop-loss, stop, or target. I do not publish my trade setups here.

Rising Channel Breakdown → Waiting for Better Buy Prices on SUISUI has been moving inside a well-defined rising channel on the higher timeframe, forming higher highs and higher lows. However, price is now trading near the lower boundary of the channel , showing signs of weak momentum and potential breakdown.
Historically, a loss of the rising channel support often leads to a deeper corrective move, especially after an extended uptrend. Current structure suggests that downside continuation is more likely before any sustainable bullish scenario.
📌 Key points:
Long-term ascending channel
Price approaching / losing channel support
Increased risk of trend exhaustion and correction
🎯 Downside targets:
Target 1: $0.60
Target 2: $0.25
🛑 Conclusion:
At current levels, buying SUI is not attractive from a risk-reward perspective. A better strategy is to wait for deeper pullbacks and signs of stabilization near the mentioned targets before considering long positions.
This is a patience trade — better prices are likely ahead.

SUI/USDT : LIMITHello friends
As you can see, after the resistance level we set was broken, the price has grown well, and now with this bullish trend, there is a sign of sellers entering, and there is a possibility of price correction, and the price can grow again from these areas and move to our targets.
This analysis is technically reviewed and is not a buy or sell recommendation, so please follow risk and capital management.
*Trade safely with us*

FireHoseReel | SUI Under Strong Accumulation Pressure🔥 Welcome to FireHoseReel!
Let’s jump into the SUI analysis.
👀 SUI – 4H Overview
After forming a double-bottom structure around $1.34, SUI has started moving higher and is now approaching its major resistance with strong buying momentum.
📊 SUI Volume Analysis
SUI volume has increased significantly, while selling pressure has weakened. This shift is allowing price to move higher smoothly.
As long as buy volume remains sustained, SUI can continue the upside move it has initiated.
✍️ SUI Trading Scenarios
🟢 Long Scenario
A break above $1.5855, confirmed by continuing buy volume, activates the long setup.
Ideally, wait for a reaction → pullback with lower volume → renewed volume expansion to enter with an early trigger and better risk control.
🔴 Short Scenario
A break below the current double-bottom support at $1.3144, accompanied by a strong increase in sell volume, could provide a valid short setup.
❤️ Risk Management & Emotional Discipline
Crypto trading is highly risky. Without proper risk management and emotional control, trading is no different from gambling.
Logic must always come before emotions. Learn to manage your trades—and enjoy the process with control and discipline.

SUI — This Chart Still Wants HigherAlright, guys.
SUI is holding its bullish structure perfectly. The chart looks like it’s loading energy for the next move, and the momentum is still on the bulls’ side.
Here are my levels:
🎯 Target 1: 1.66
🎯 Target 2: 1.78
🎯 Target 3: 1.92
❌Invalidation:
Close below 1.54 → idea cancelled, bears take control.
🤑Risk/Reward:
• To T1: ~3R
• To T2: ~6.5R
• To T3: ~10R+
The setup speaks for itself — small risk, big potential.
⚠️Not financial advice, trade at your own risk, manage your leverage.
As long as price stays above the cancel zone, I’m looking up. Let’s see how far SUI decides to run.

SUI/USDT:LIVE TRADEHello friends
First of all, I must say that risk and capital management should be observed and any decision-making is your responsibility.
Given the decline we had, we now see that buyers have entered and are one by one setting higher ceilings and floors, which will cause the price to rise to the specified targets if the specified resistance is broken.
*Trade safely with us*

#SUI/USDT The Interesting part of the market#SUI
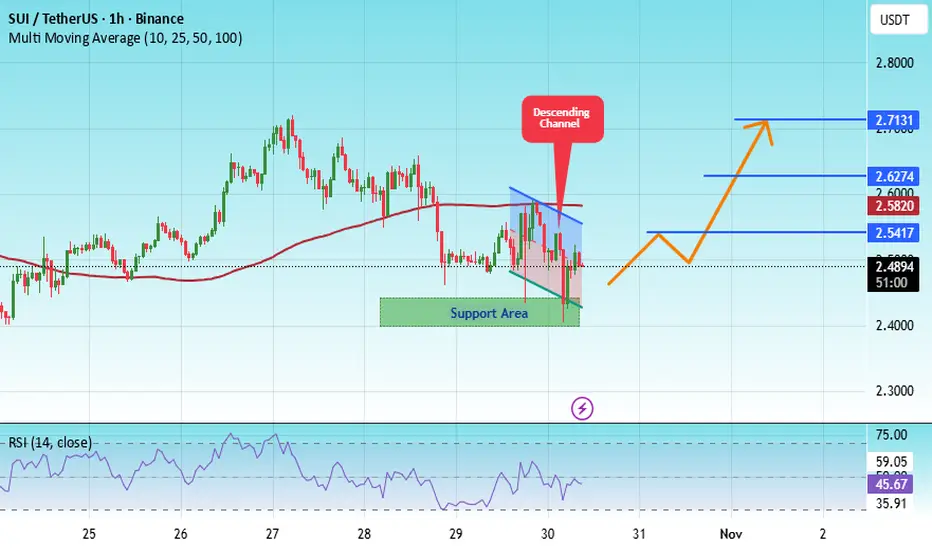
The price is moving within an ascending channel on the 1-hour timeframe and is adhering to it well. It is poised to break out strongly and retest the channel.
We have a downtrend line on the RSI indicator that is about to break and retest, which supports the upward move.
There is a key support zone in green at the price of 2.42, representing a strong support point.
We have a trend to stabilize above the 100-period moving average.
Entry price: 2.49
First target: 2.61
Second target: 2.62
Third target: 2.71
Don't forget a simple point: money management.
Upon reaching the first target, save some money and then change your stop-loss order to an entry order.
For any questions, please leave a comment.
Thank you.
SUI: SlippedSUI recently faced renewed pressure but is expected to recover soon. The magenta wave is likely to extend slightly further toward resistance at $4.57, where we anticipate this wave will peak. Afterward, a short-term correction in wave is likely before wave should drive price sustainably above the $4.57 level. A lower bottom would only become likely if support at $0.55 is breached. In that scenario, an alternative wave alt.B in turquoise would come into play, which we currently estimate has a 37% probability.

My point of View For SUIDear Follower
I got a multi request to analyze SUI
I see SUI most likely will hit $5.5 easily
I recommend liquidate 50% of your fund at that price then start use a trilling stop under each last new bottom for the rest of the fund
Good luck every one

SUI Analysis (1H)It seems that an ABC pattern is forming on the 1-hour chart, with wave B already completed.
Wave B appears to have been a triangle.
A buy/long position can be entered on the pullback to the green zone.
The targets marked on the chart are for wave C, which is a bullish wave.
A daily candle close below the invalidation level would invalidate this analysis.
For risk management, please don't forget stop loss and capital management
Comment if you have any questions
Thank You

SUI New Update (1H)This analysis is an update of the analysis you see in the "Related publications" section
The trigger line has been broken, and the 4-hour full-body candle | which were our confirmations | have failed.
The wave B pattern has shifted from a triangle to a diametric formation, and it seems that the pattern is developing in the structure we’ve outlined on the chart.
Let’s wait and see what happens.
For risk management, please don't forget stop loss and capital management
When we reach the first target, save some profit and then change the stop to entry
Comment if you have any questions
Thank You

Very bearish - waiting for re-entry
Sui price action is very bearish. I am waiting for an opportunity to re-enter.
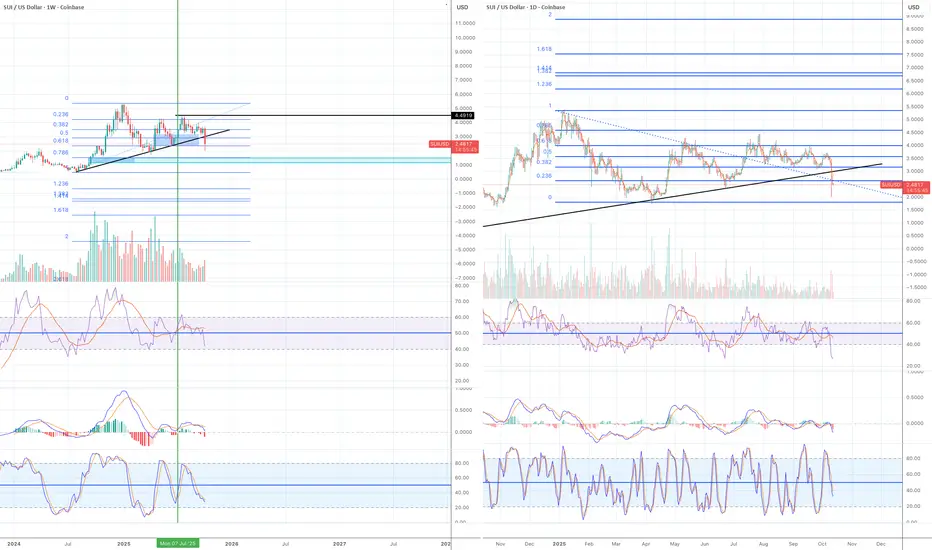
Weekly:
The price broke below the ascending support line. The current weekly candle hasn't completed yet, but a Friday daily candle broke and closed below the support line.
RSI and Stochastic have moved to the bear zone.
MACD lines have crossed to the downside and are starting to move to the bear zone.
Daily:
All momentum indicators are in the bear zone.
My plan:
There is a large unmitigated fair value gap in the $1.1-15 zone (blue rectangular box in the weekly chart).
If the price does not recover from $2.5 (Fib 0.618), it is likely to drop to 0.786 level and it is where FVG sits.
0.786 often works as the last line of defence. It the price doesn't recover from there, I won't be buying SUI.
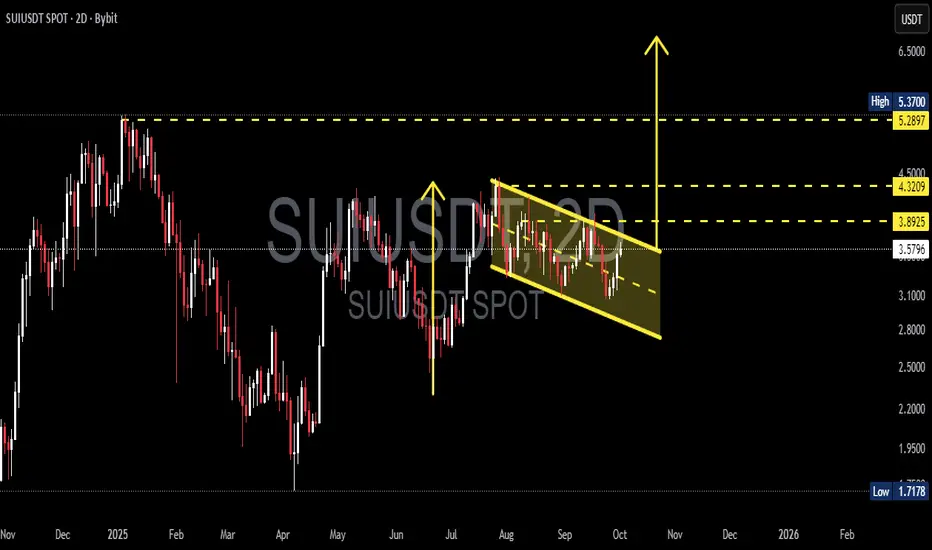
SUI/USDT — Bullish Flag, Consolidation Before the Next Rally?📌 Pattern Overview
SUI is currently forming a Bullish Flag pattern, which consists of:
Flagpole: the strong rally from June–July that pushed the price significantly higher.
Flag: a downward-sloping consolidation channel (descending channel) since August.
This pattern typically indicates a healthy pause after a strong uptrend, often followed by another bullish continuation.
---
🔍 Technical Analysis
Current Price: $3.58.
Upper flag line (resistance): around $3.89–$3.90.
Lower flag line (support): around $2.80.
Key horizontal levels: $3.89 → $4.32 → $5.29/$5.37 (previous high).
---
📈 Bullish Scenario (Valid Flag Breakout)
Confirmation: A breakout above the upper flag line with a strong 2D candle close and rising volume.
Flagpole projection target:
Previous flagpole measured from ~$2.0 → ~$5.3 = ~$3.3 move.
Breakout above ~$3.9 projects a target near $7.0 – $7.2.
Upside targets (step by step):
Target 1: $3.89 (first resistance).
Target 2: $4.32 (mid resistance).
Target 3: $5.29–$5.37 (previous top).
Extended target: $7.0 (flagpole projection).
Stop-loss: Below the breakout point or below the lower flag line (~$2.80).
---
📉 Bearish Scenario (Failed Flag)
Confirmation: Rejection at the upper flag line, or a breakdown below the channel.
Downside targets:
$2.80 (intra-flag support).
$2.20 → $1.72 (major support levels).
Extended target near $1.28 if a full breakdown occurs and the flag invalidates.
---
⚖️ Extra Confirmations
1. Volume: Breakout should be accompanied by a clear volume spike.
2. RSI: A move above 50–60 strengthens the bullish case.
3. MACD: Bullish crossover supports momentum continuation.
---
🎯 Conclusion
SUI is consolidating inside a Bullish Flag, a classic continuation pattern. A confirmed breakout could trigger a move towards $5.37, with an extended upside target near $7.0. Failure to break out, however, would bring price back to supports around $2.80 – $1.72.
Traders should wait for confirmation via candle close and volume before entering, and maintain strict risk management in case of pattern failure.
---
#SUI #SUIUSDT #Crypto #Altcoins #TechnicalAnalysis #BullishFlag #Breakout #PriceAction #CryptoTrading
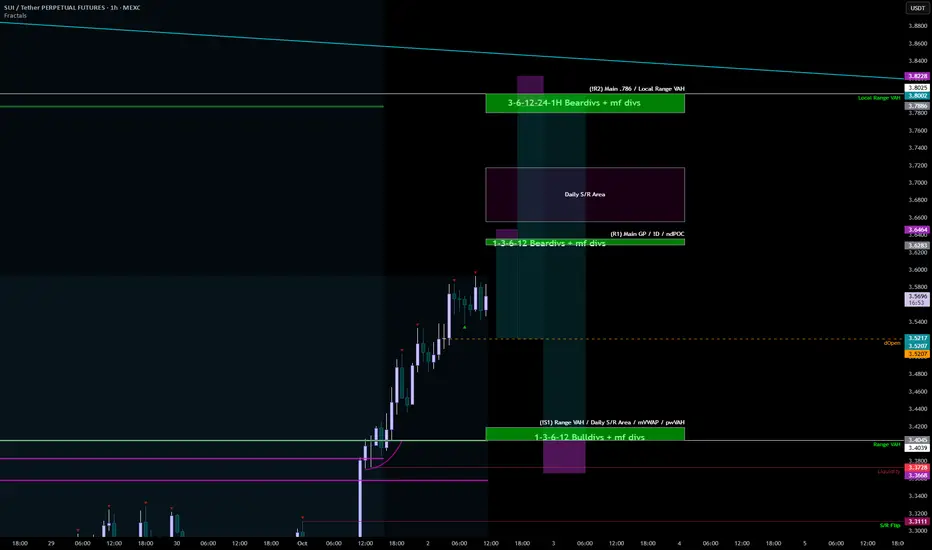
SUI 02.10Just as the sol easily broke above the local overbought zone around 3.4, there was no retest, so S1 is where we can retest, and losing this support is highly undesirable for further growth. The nearest resistance zones are 3.63, 3.8, and the main resistance zone is 4.05-4.10.
Support zones:
3.40-3.42
Resistance zones:
3.628-3.635
3.78-3.8
4.05-4.1
#SUI/USDT mid-term I believe this one will pump#SUI
The price is moving within a descending channel on the 1-hour frame, adhering well to it, and is heading for a strong breakout and retest.
We have a bearish trend on the RSI indicator that is about to be broken and retested, which supports the upward breakout.
There is a major support area in green at 3.27, representing a strong support point.
We are heading for consolidation above the 100 moving average.
Entry price: 3.30
First target: 3.38
Second target: 3.46
Third target: 3.56
Don't forget a simple matter: capital management.
When you reach the first target, save some money and then change your stop-loss order to an entry order.
For inquiries, please leave a comment.
Thank you.

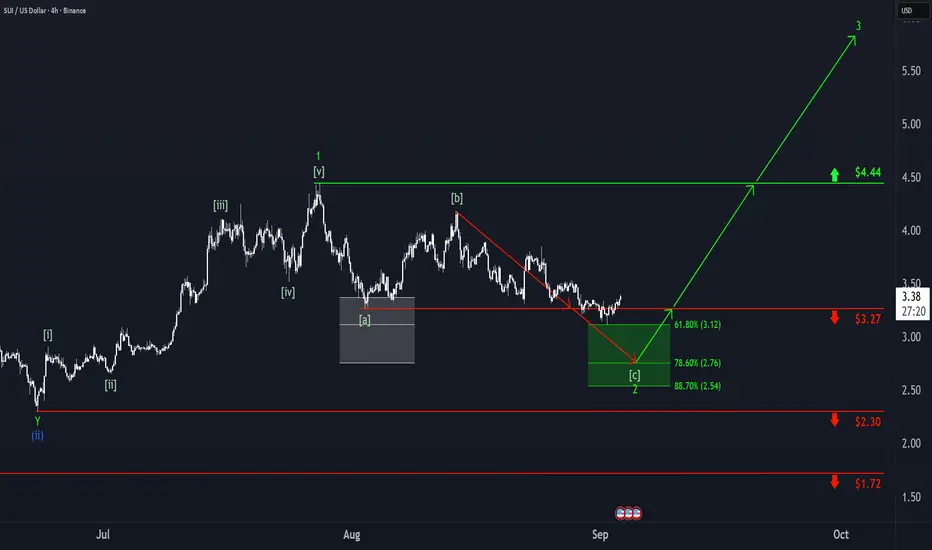
SUI: Alternative Scenario in Play as SUI Breaks Key SupportSUI has continued its downward trend since our last update, breaking below the $3.11 support level and triggering our alternative scenario. As a result, we now place the altcoin in the beige wave (C). We primarily expect this downward wave to drive price lower, with a bottom likely to form within the green long Target Zone between $2.76 and $2.30. This low should also mark the end of the larger wave 2 in bright green, which we had previously considered finished. From this price range, we anticipate a new upward impulse: green wave 3 is expected to push the coin above resistance at $4.44. Accordingly, prices within this zone could be considered for long entries.

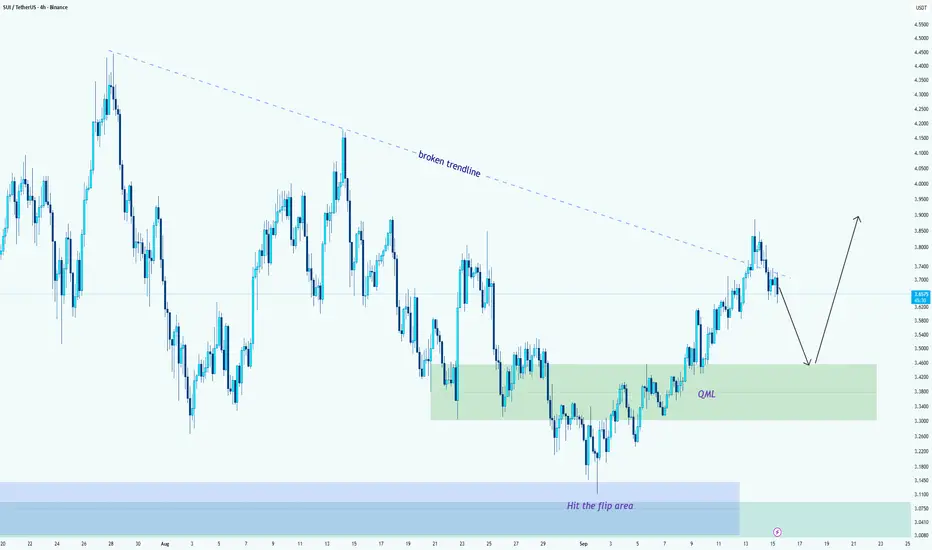
SUI/USDT --> Two-Step Setup: Retest QML, Then RallyHello guys!
Short version first: I expect a pullback to the QML (3.30–3.45), then a bounce that resumes the upside toward 3.80–3.90 (and potentially higher if momentum continues).
Why this makes sense (the plan):
Step 1 --> Pullback to QML:
Price broke the long descending trendline and impulsed higher, but the move is showing a normal two-leg structure: first leg up, now a corrective leg down. The green QML box (3.30–3.45) is the nearby demand zone and the most logical place for buyers to re-enter.
Step 2 --> Bounce & continuation:
If the QML holds and we get a bullish rejection (pinbar, engulfing, clear wick rejection, or a nice bullish close), the most likely path is a continuation back toward the recent supply area — 3.80– 3.90 as the first meaningful resistance. If momentum keeps, extensions toward the next structural highs become possible.
Final note
This is a two-step game: first, the retest, then the real trade. Don’t chase the breakout now; patience at the QML will give a cleaner, higher-reward setup.
SUI Wedge BreakoutSui formed a bullish Wedge and it broke out.
If the price established above 3.63, We can expect a bullish move up to 4.4 area.
Stops at 3.07.
SUIUSDTThe chart is on best support but I not see confirmation candle or volume of buy for entry.
Next level is for best support is 2.91$. I think the price will touch this level with a shadow. What are you think?

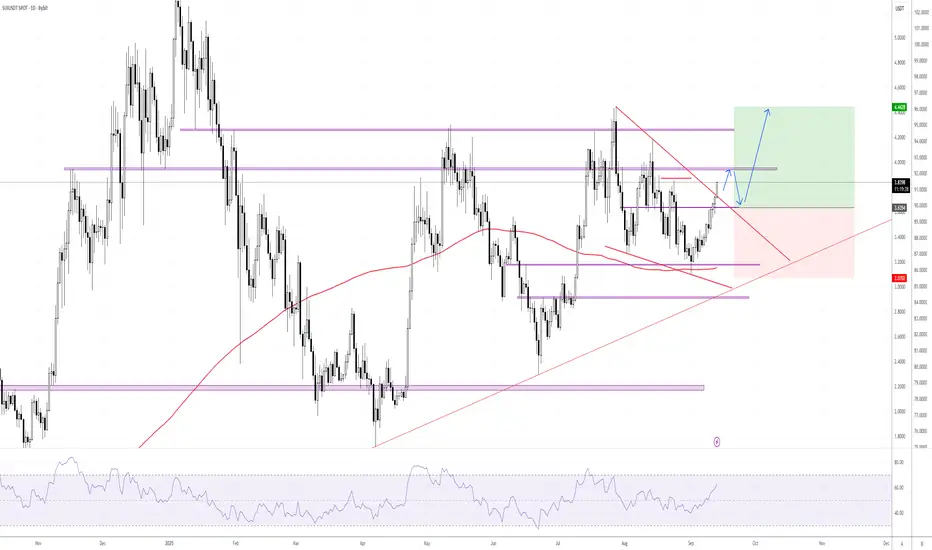
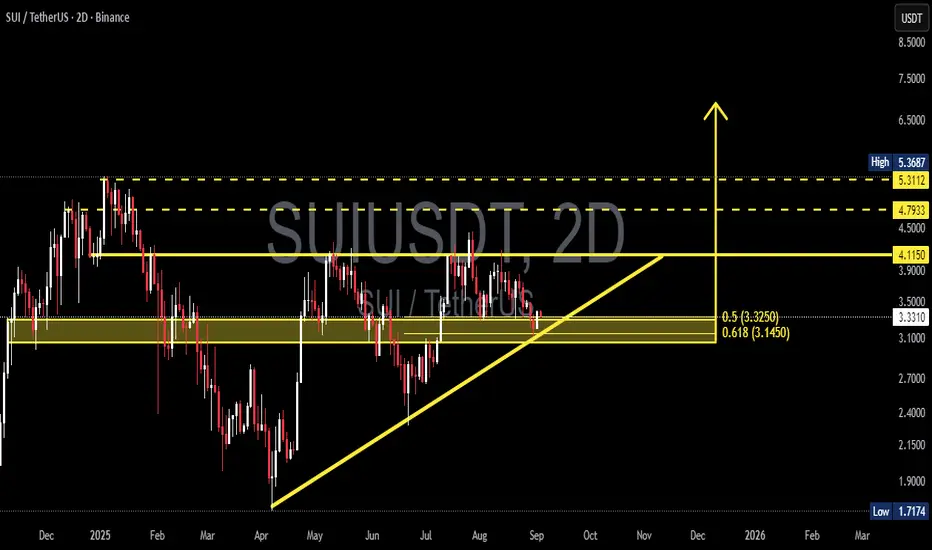
SUIUSDT — Test Golden Pocket: Breakout or Breakdown Ahead?🔎 Overview:
SUI/USDT is currently sitting at a critical decision point. Since April 2025, price action has been forming higher-lows supported by an ascending trendline (yellow). On the upside, we see a flat resistance around 4.115, creating an Ascending Triangle pattern — a classic bullish continuation structure that often precedes a breakout.
However, price is now testing the key demand zone at 3.33–3.15, which perfectly aligns with the Fibonacci golden pocket (0.5 & 0.618 retracement). This zone will likely determine the next major move: either a strong rebound to the upside or a deeper breakdown.
---
📈 Bullish Scenario (Breakout Potential):
Trigger: Price holds above 3.33–3.15 and breaks 4.115 with a strong 2D candle close.
Pattern Implication: A breakout from the ascending triangle usually results in a move equal to the pattern’s height (~0.9–1.1 points), projecting targets around 5.0–5.3.
Targets:
TP1 = 4.79 (intermediate liquidity)
TP2 = 5.31–5.37 (major resistance & previous high)
Extra Signal: A breakout with rising volume would strengthen the bullish outlook significantly.
---
📉 Bearish Scenario (Breakdown Risk):
Trigger: A decisive close below 3.10, which would break both the ascending trendline and the golden pocket.
Consequence: This breakdown could open the door to a deeper retracement.
Targets:
2.70 (minor support)
2.40 (major support)
2.15 (previous demand zone)
Extreme case: 1.72 (historical low)
Invalidation: A recovery above 3.35 followed by a breakout over 4.115 would nullify the bearish setup.
---
📌 Conclusion:
SUI is at a make-or-break level. The 3.33–3.15 zone is the battlefield between bulls and bears, marking the golden pocket of this structure. Holding this level keeps the door open for a bullish breakout towards 5.0–5.3, while losing it could trigger a significant drop toward the 2.70–2.15 range.
📊 Strategy: Wait for a confirmed 2D close before positioning. Manage risk tightly and watch how price reacts at this golden pocket zone — it will set the tone for the next major trend.
---
#SUI #SUIUSDT #CryptoAnalysis #AscendingTriangle #PriceAction #SupplyDemand #GoldenPocket #Fibonacci #CryptoBreakout #SupportResistance #SwingTrading
SUI: Dip and Go?On Monday, SUI dipped into our green Target Zone ($3.12 – $2.54) but quickly rebounded and climbed back above the $3.27 level. While it’s possible that wave 2 has already bottomed, we’re still allowing for potential new lows within this range. Once this interim correction wraps up, we expect an impulsive rally as green wave 3 takes shape, which should push well above the $4.44 resistance.