SUI is on the verge of another rally (4H)From the point where we marked the green arrow on the chart, a bullish phase has started on SUI. This area acted as a key reaction zone where buyers stepped in decisively, shifting market sentiment from corrective to bullish.
Based on the current price structure, it appears that we are developing an ABC corrective pattern. In this structure, Wave B has formed as a triangle, which is a common consolidation pattern before continuation. The triangle suggests decreasing volatility and balance between buyers and sellers before the next impulsive move.
At the moment, price action indicates that we are still inside Wave B, with one final sub-wave remaining wave “e” of the triangle. Once this last leg of the triangle is completed, the corrective phase should be fully exhausted.
After the completion of this final wave, the market is expected to resume its bullish move in the form of Wave C, which typically unfolds as a strong impulsive rally. This next move should bring expansion in both momentum and volume compared to the corrective structure we are currently seeing.
To manage risk and execution efficiently, two entry zones have been clearly marked on the chart, and positions should be built using a DCA (Dollar-Cost Averaging) approach rather than a single entry. This allows better positioning in case of short-term volatility during the end of Wave B.
The projected targets for Wave C are also outlined on the chart, based on classical Elliott Wave projections and prior market structure. These levels represent logical areas where partial or full profit-taking can be considered.
⚠️ Invalidation:
This analysis will be invalidated if a candle closes below the marked invalidation level. A confirmed close below that level would indicate that the current wave structure is no longer valid and that the market may be transitioning into a different scenario.
As always, this setup is based on technical structure and probability, not certainty. Proper risk management is essential.
If you have a coin or altcoin you want analyzed, first hit the like button and then comment its name so I can review it for you.
This is not a trade setup, as it has no precise stop-loss, stop, or target. I do not publish my trade setups here.
SUIBTC

#SUI/USDT Could switch sides soon. Be ready#SUI
The price is moving in a descending channel on the 1-hour timeframe. It has reached the lower boundary and is heading towards a breakout, with a retest of the upper boundary expected.
We are seeing a bearish trend in the Relative Strength Index (RSI), which has reached near the lower boundary, and an upward bounce is expected.
There is a key support zone in green at 1.37, and the price has bounced from this level several times. Another bounce is expected.
We are seeing a trend towards stabilizing above the 100-period moving average, which we are approaching, supporting the upward trend.
Entry Price: 1.40
First Target: 1.431
Second Target: 1.465
Third Target: 1.50
Remember a simple principle: Money Management.
Place your stop-loss order below the green support zone.
For any questions, please leave a comment.
Thank you.

#SUI/USDT Could switch sides soon. Be ready#SUI
The price is moving in a descending channel on the 1-hour timeframe. It has reached the lower boundary and is heading towards breaking above it, with a retest of the upper boundary expected.
We have a downtrend on the RSI indicator, which has reached near the lower boundary, and an upward rebound is expected.
There is a key support zone in green at 1.40. The price has bounced from this zone multiple times and is expected to bounce again.
We have a trend towards consolidation above the 100-period moving average, as we are moving close to it, which supports the upward movement.
Entry price: 1.43
First target: 1.46
Second target: 1.50
Third target: 1.56
Don't forget a simple principle: money management.
Place your stop-loss below the support zone in green.
For any questions, please leave a comment.
Thank you.

#SUI/USDT Could switch sides soon. Be ready#SUI
The price is moving in a descending channel on the 1-hour timeframe. It has reached the lower boundary and is heading towards breaking above it, with a retest of the upper boundary expected.
We have a downtrend on the RSI indicator, which has reached near the lower boundary, and an upward rebound is expected.
There is a key support zone in green at 1.38. The price has bounced from this zone multiple times and is expected to bounce again.
We have a trend towards consolidation above the 100-period moving average, as we are moving close to it, which supports the upward movement.
Entry price: 1.40
First target: 1.42
Second target: 1.44
Third target: 1.48
Don't forget a simple principle: money management.
Place your stop-loss below the support zone in green.
For any questions, please leave a comment.
Thank you.

SUIUSDT Forming Falling WedgeSUIUSDT is forming a clear falling wedge pattern, a classic bullish reversal signal that often indicates an upcoming breakout. The price has been consolidating within a narrowing range, suggesting that selling pressure is weakening while buyers are beginning to regain control. With consistent volume confirming accumulation at lower levels, the setup hints at a potential bullish breakout soon. The projected move could lead to an impressive gain of around 140% to 150% once the price breaks above the wedge resistance.
This falling wedge pattern is typically seen at the end of downtrends or corrective phases, and it represents a potential shift in market sentiment from bearish to bullish. Traders closely watching SUIUSDT are noting the strengthening momentum as it nears a breakout zone. The good trading volume adds confidence to this pattern, showing that market participants are positioning early in anticipation of a reversal.
Investors’ growing interest in SUIUSDT reflects rising confidence in the project’s long-term fundamentals and current technical strength. If the breakout confirms with sustained volume, this could mark the start of a fresh bullish leg. Traders might find this a valuable setup for medium-term gains, especially as the wedge pattern completes and buying momentum accelerates.
✅ Show your support by hitting the like button and
✅ Leaving a comment below! (What is your opinion about this Coin?)
Your feedback and engagement keep me inspired to share more insightful market analysis with you!

#SUI/USDT Could switch sides soon. Be ready#SUI
The price is moving in a descending channel on the 1-hour timeframe. It has reached the lower boundary and is heading towards breaking above it, with a retest of the upper boundary expected.
We have a downtrend on the RSI indicator, which has reached near the lower boundary, and an upward rebound is expected.
There is a key support zone in green at 1.33. The price has bounced from this zone multiple times and is expected to bounce again.
We have a trend towards consolidation above the 100-period moving average, as we are moving close to it, which supports the upward movement.
Entry price: 1.35
First target: 1.38
Second target: 1.42
Third target: 1.46
Don't forget a simple principle: money management.
Place your stop-loss below the support zone in green.
For any questions, please leave a comment.
Thank you.

FireHoseReel | SUI Under Strong Accumulation Pressure🔥 Welcome to FireHoseReel!
Let’s jump into the SUI analysis.
👀 SUI – 4H Overview
After forming a double-bottom structure around $1.34, SUI has started moving higher and is now approaching its major resistance with strong buying momentum.
📊 SUI Volume Analysis
SUI volume has increased significantly, while selling pressure has weakened. This shift is allowing price to move higher smoothly.
As long as buy volume remains sustained, SUI can continue the upside move it has initiated.
✍️ SUI Trading Scenarios
🟢 Long Scenario
A break above $1.5855, confirmed by continuing buy volume, activates the long setup.
Ideally, wait for a reaction → pullback with lower volume → renewed volume expansion to enter with an early trigger and better risk control.
🔴 Short Scenario
A break below the current double-bottom support at $1.3144, accompanied by a strong increase in sell volume, could provide a valid short setup.
❤️ Risk Management & Emotional Discipline
Crypto trading is highly risky. Without proper risk management and emotional control, trading is no different from gambling.
Logic must always come before emotions. Learn to manage your trades—and enjoy the process with control and discipline.

#SUI/USDT Could switch sides soon. Be ready#SUI
The price is moving in a descending channel on the 1-hour timeframe and is expected to break out and continue upwards.
We have a trend to stabilize above the 100-period moving average again.
We have a downtrend on the RSI indicator, which supports an upward move if it breaks above it.
We have a key support zone in green that pushed the price higher at 1.292.
Entry price: 1.325
First target: 1.372
Second target: 1.427
Third target: 1.497
For risk management, don't forget your stop-loss and money management.
The stop-loss is below the support zone in green.
Upon reaching the first target, take some profit and then change your stop-loss order to an entry order.
For any questions, please comment.
Thank you.

#SUI/USDT – Bullish Triangle Breakout Confirmed | Resistance #SUI
The price is moving in a descending channel on the 1-hour timeframe and is expected to break out and continue upwards.
We have a trend to stabilize above the 100-period moving average again.
We have a downtrend on the RSI indicator, which supports an upward move if it breaks above it.
We have a key support zone in green that pushed the price higher at 1.75.
Entry price: 1.77
First target: 1.80
Second target: 1.84
Third target: 1.88
For risk management, don't forget your stop-loss and capital management.
The stop-loss is below the support zone in green.
Upon reaching the first target, take some profit and then change your stop-loss order to an entry order.
For any questions, please comment.
Thank you.

#SUI/USDT – Bullish Triangle Breakout Confirmed | Resistance Li#SUI
The price is moving within an ascending channel on the 1-hour timeframe and is adhering to it well. It is poised to break out strongly and retest the channel.
We have a downtrend line on the RSI indicator that is about to break and retest, which supports the upward move.
There is a key support zone in green at the price of 1.98, representing a strong support point.
We have a trend to stabilize above the 100-period moving average.
Entry price: 2.02
First target: 2.04
Second target: 2.06
Third target: 2.02
Don't forget a simple money management tip:
Place your stop-loss order below the support zone in green.
Once you reach the first target, save some money and then change your stop-loss order to an entry order.
For any questions, please leave a comment.
Thank you.
#SUI/USDT The Interesting part of the market#SUI
The price is moving in a descending channel on the 1-hour timeframe and is expected to break out and continue upwards.
We have a trend to stabilize above the 100-period moving average again.
We have a downtrend on the RSI indicator, which supports an upward move if it breaks above it.
We have a key support zone in green that pushed the price up to 1.93.
Entry price: 1.96
First target: 1.97
Second target: 2.02
Third target: 2.04
For risk management, don't forget your stop-loss and capital management.
The stop-loss is below the support zone in green.
Upon reaching the first target, take some profit and then change your stop-loss order to an entry order.
For any questions, please comment.
Thank you.

#SUI/USDT The Interesting part of the market#SUI
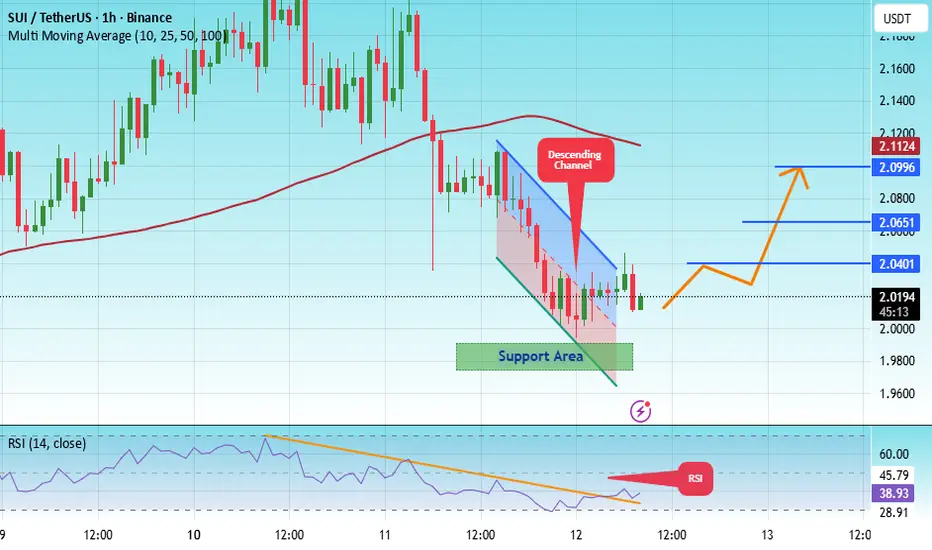
The price is moving within an ascending channel on the 1-hour timeframe and is adhering to it well. It is poised to break out strongly and retest the channel.
We have a downtrend line on the RSI indicator that is about to break and retest, which supports the upward move.
There is a key support zone in green at the price of 2.14, representing a strong support point.
We have a trend of consolidation above the 100-period moving average.
Entry price: 2.18
First target: 2.215
Second target: 2.26
Third target: 2.32
Don't forget a simple money management rule:
Place your stop-loss order below the support zone in green.
Once the first target is reached, save some money and then change your stop-loss order to an entry order.
For any questions, please leave a comment.
Thank you.
#SUI/USDT The Interesting part of the market#SUI
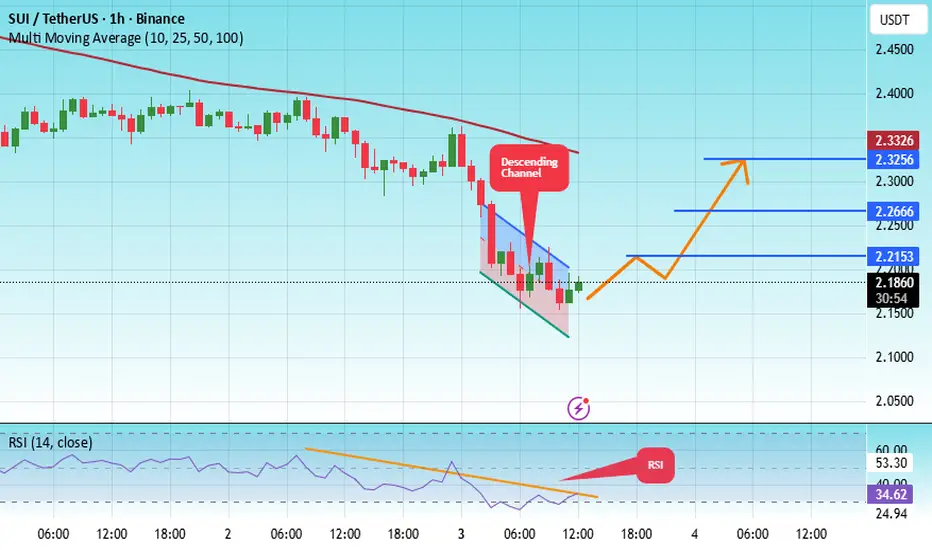
The price is moving within an ascending channel on the 1-hour timeframe and is adhering to it well. It is poised to break out strongly and retest the channel.
We have a downtrend line on the RSI indicator that is about to break and retest, which supports the upward move.
There is a key support zone in green at the price of 2.42, representing a strong support point.
We have a trend to stabilize above the 100-period moving average.
Entry price: 2.49
First target: 2.61
Second target: 2.62
Third target: 2.71
Don't forget a simple point: money management.
Upon reaching the first target, save some money and then change your stop-loss order to an entry order.
For any questions, please leave a comment.
Thank you.
#SUI/USDT - Head and Shoulders Long#SUI
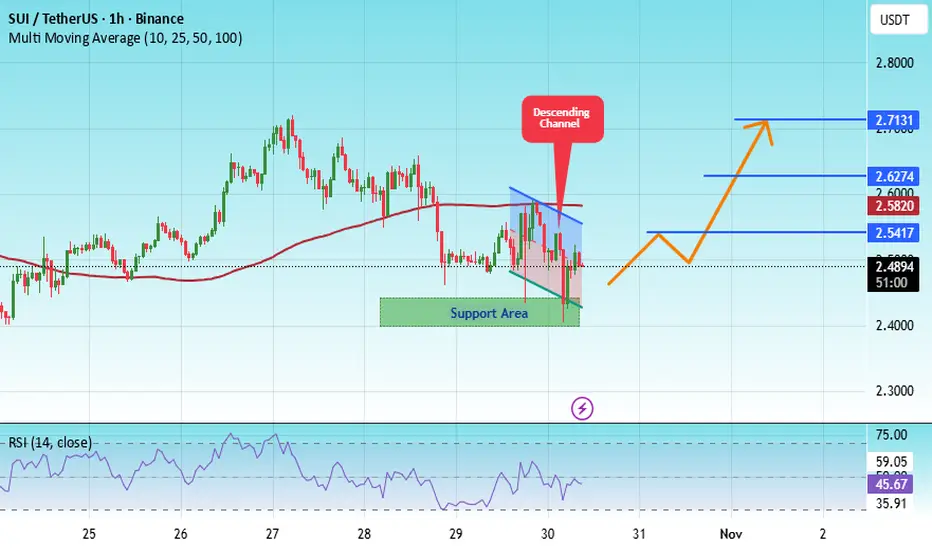
The price is moving within a descending channel on the 1-hour frame, adhering well to it, and is heading for a strong breakout and retest.
We have a bearish trend on the RSI indicator that is about to be broken and retested, which supports the upward breakout.
There is a major support area in green at 2.38, representing a strong support point.
We are heading for consolidation above the 100 moving average.
Entry price: 2.40
First target: 2.48
Second target: 2.54
Third target: 2.63
Don't forget a simple matter: capital management.
When you reach the first target, save some money and then change your stop-loss order to an entry order.
For inquiries, please leave a comment.
Thank you.

SUI New Update (1H)This analysis is an update of the analysis you see in the "Related publications" section
The trigger line has been broken, and the 4-hour full-body candle | which were our confirmations | have failed.
The wave B pattern has shifted from a triangle to a diametric formation, and it seems that the pattern is developing in the structure we’ve outlined on the chart.
Let’s wait and see what happens.
For risk management, please don't forget stop loss and capital management
When we reach the first target, save some profit and then change the stop to entry
Comment if you have any questions
Thank You

#SUI/USDT Bullish scenario#SUI
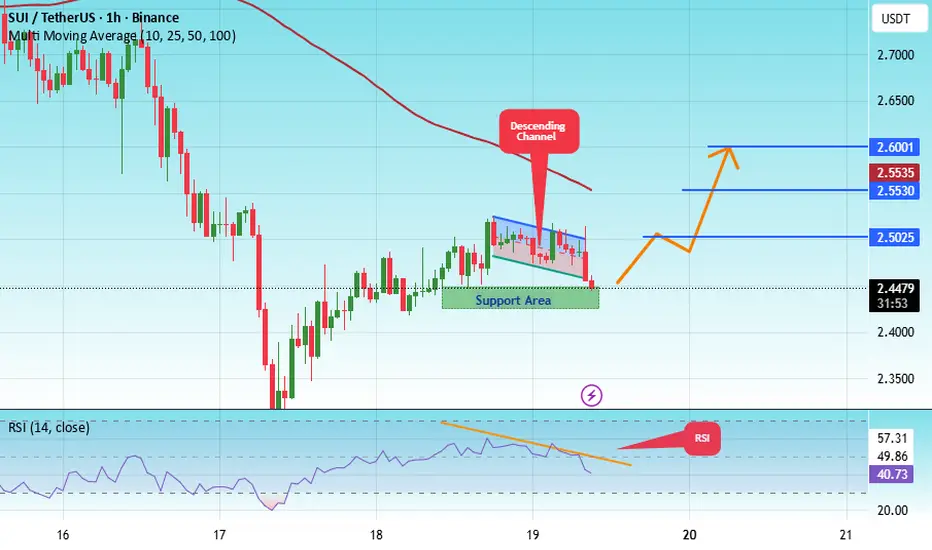
The price is moving within a descending channel on the 1-hour frame, adhering well to it, and is heading for a strong breakout and retest.
We have a bearish trend on the RSI indicator that is about to be broken and retested, which supports the upward breakout.
There is a major support area in green at 2.43, representing a strong support point.
We are heading for consolidation above the 100 moving average.
Entry price: 2.45
First target: 2.50
Second target: 2.55
Third target: 2.60
Don't forget a simple matter: capital management.
When you reach the first target, save some money and then change your stop-loss order to an entry order.
For inquiries, please leave a comment.
Thank you.
#SUI/USDT Bullish scenario#SUI
The price is moving within a descending channel on the 1-hour frame, adhering well to it, and is heading for a strong breakout and retest.
We have a bearish trend on the RSI indicator that is about to be broken and retested, which supports the upward breakout.
There is a major support area in green at 2.61, representing a strong support point.
We are heading for consolidation above the 100 moving average.
Entry price: 2.81
First target: 2.96
Second target: 3.11
Third target: 3.30
Don't forget a simple matter: capital management.
When you reach the first target, save some money and then change your stop-loss order to an entry order.
For inquiries, please leave a comment.
Thank you.

SUI 1D Analysis - Key Triggers Ahead☃️ Welcome to the cryptos winter , I hope you’ve started your day well.
⏰ We’re analyzing SUI on the 1-Day timeframe .
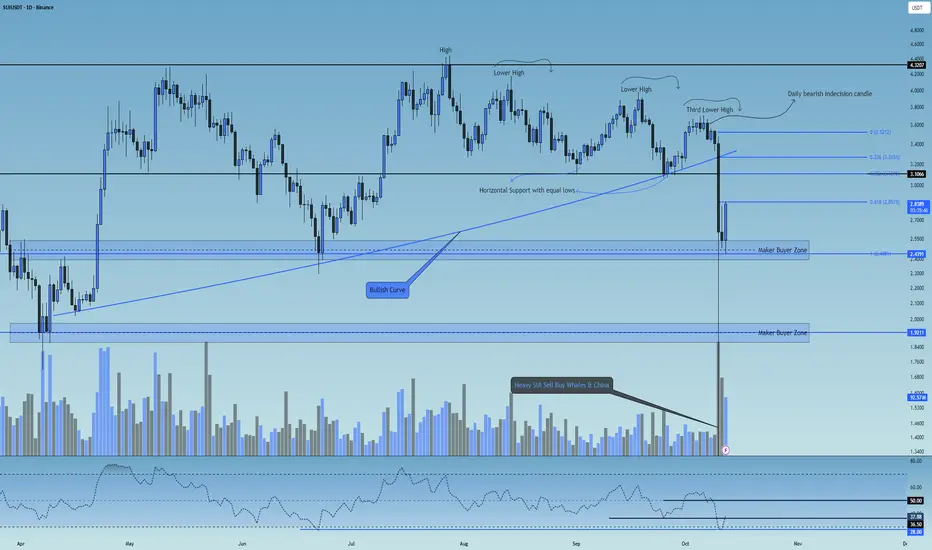
👀 On the daily timeframe of the SUI coin, we can see that SUI was moving along a slightly upward curved line, continuously forming higher highs and higher lows. After creating a top around the $4.3 zone, it faced a strong rejection and dropped toward the $3.3 support area. From there, it started forming lower highs and lower lows, practically entering a descending channel.
At the third and final lower high, SUI formed a strong daily indecision candle, which broke its multi-timeframe support at the $3.5 zone and continued moving downward. During the historic flash crash night of crypto, SUI opened around $3.4, then plunged to $0.5. Following exchange buybacks and market maker interventions, it made a massive upper shadow wick back toward the $2.6 zone, where it finally closed its daily candle.
🧮 Looking at the RSI oscillator, SUI experienced a heavy rejection from the 57 level, dropping below 50 and moving toward its daily oversold zone. The key RSI levels are currently around 36.5 and 50, with the 36.5 zone acting as the nearest crucial pivot level. A bounce from this region would slightly reduce the fear and FOMO of a deeper drop among traders.
🎮 A Fibonacci retracement drawn from $3.5 down to the market maker support zone at $2.43 reveals several important resistance levels. The 0.618 zone serves as a major resistance level—if this level breaks, it could lead to a higher low formation above $2.5, signaling a potential bullish reversal. The next resistance lies around 0.382, which is currently out of buyers’ immediate reach.
🕯 The recent candle sizes and volumes indicate strong selling pressure and rapid price teleportation downward. Signs of this drop could already be seen through the bearish indecision daily candle, but such an extreme dump couldn’t have been predicted purely by technicals. This crash was largely caused by Chinese fund managers selling their holdings, with large wallets entering risk-off mode, unwilling to take further losses. They, along with the Chinese government, sold off their SUI positions to prevent deeper damage—a case of “prevention is better than cure.”
During the recovery phase, exchanges executed significant buybacks, and because the price had fallen to major discounts, many market-making buyers placed strong limit orders at low levels, which helped drive the price back upward.
🪙On the weekly timeframe (SUI/BTC pair), this trading symbol has an extremely critical bottom—losing it could lead to a deep correction that would heavily impact SUI’s core structure. Thanks to buyer support and exchange buybacks, this bottom hasn’t yet been broken in the current weekly candle. There’s also a dynamic resistance trendline pressing down on its relative value; currently, SUI is in the final third of this price compression phase. If this trendline breaks, SUI could gain relative strength against Bitcoin and move upward.
🧠 Currently, SUI sits below its key resistance zone at $2.85. A break and daily close above this level could allow SUI to form a higher low compared to its flash crash bottom, retracing part of the recent drop and providing a better exit opportunity for many holders and traders.
This scenario will be updated with more precision and detail in future analyses.
❤️ Disclaimer : This analysis is purely based on my personal opinion and I only trade if the stated triggers are activated .
SUIUSDT Forming Falling WedgeSUIUSDT is currently trading within a falling wedge pattern, a classic bullish reversal setup that often signals the end of a downtrend and the start of a new upward rally. The price has been consolidating in a narrowing range, reflecting reduced selling pressure and a potential buildup for a breakout. With good volume supporting this pattern, the technical outlook is strengthening, pointing towards a possible 40% to 50%+ gain in the near term once a confirmed breakout occurs.
The falling wedge indicates that bears are losing control while bulls are preparing to push prices higher. Historically, this pattern leads to strong rallies as traders and investors anticipate a shift in momentum. If SUIUSDT breaks through its key resistance levels, it could trigger significant buying interest, opening the way for a sharp upward move.
Investor attention towards this project has also been growing, which further reinforces the bullish outlook. Market sentiment, coupled with favorable technicals, suggests that SUIUSDT could be at the beginning of a potential trend reversal. This makes it an attractive opportunity for those monitoring breakout setups in the crypto market.
✅ Show your support by hitting the like button and
✅ Leaving a comment below! (What is You opinion about this Coin)
Your feedback and engagement keep me inspired to share more insightful market analysis with you!

#SUI/USDT mid-term I believe this one will pump#SUI
The price is moving in a descending channel on the 1-hour frame and is expected to break and continue upward.
We have a trend to stabilize above the 100 moving average once again.
We have a downtrend on the RSI indicator that supports the upward move with a breakout.
We have a major support area in green that pushed the price higher at 3.62.
Entry price: 3.70.
First target: 3.75.
Second target: 3.82.
Third target: 3.90.
To manage risk, don't forget stop loss and capital management.
When you reach the first target, save some profits and then change the stop order to an entry order.
For inquiries, please comment.
Thank you.

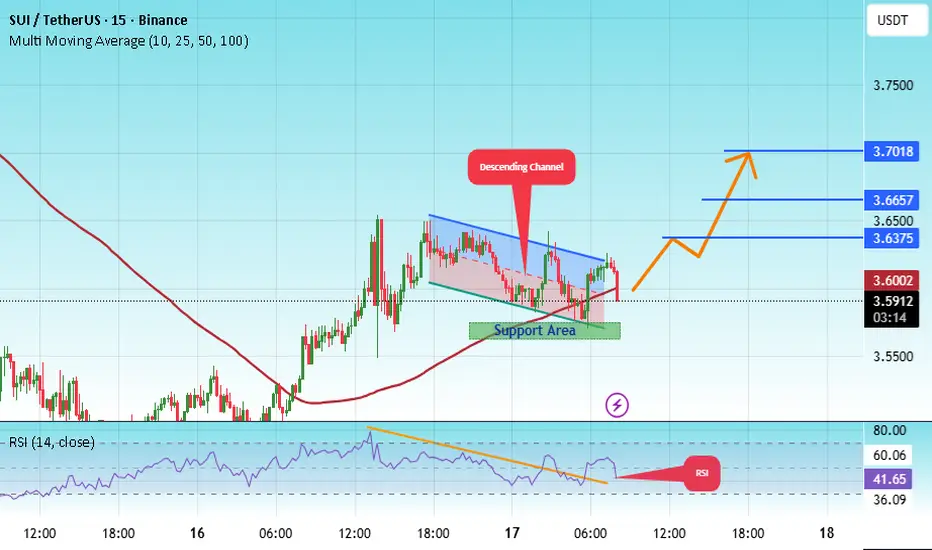
#SUI/USDT bullish structure formed at the chart#SUI
The price is moving within a descending channel on the 1-hour frame, adhering well to it, and is heading for a strong breakout and retest.
We have a bearish trend on the RSI indicator that is about to be broken and retested, which supports the upward breakout.
There is a major support area in green at 3.56, representing a strong support point.
We are heading for consolidation above the 100 moving average.
Entry price: 3.60
First target: 3.64
Second target: 3.66
Third target: 3.70
Don't forget a simple matter: capital management.
When you reach the first target, save some money and then change your stop-loss order to an entry order.
For inquiries, please leave a comment.
Thank you.
#SUI/USDT → Resistance breakout and entry into the buying zone#SUI
The price is moving within a descending channel on the 1-hour frame, adhering well to it, and is heading for a strong breakout and retest.
We have a bearish trend on the RSI indicator that is about to be broken and retested, which supports the upward breakout.
There is a major support area in green at 3.14, which represents a strong support point.
For inquiries, please leave a comment.
We are in a consolidation trend above the 100 Moving Average.
Entry price: 3.29
First target: 3.38
Second target: 3.51
Third target: 3.67
Don't forget a simple matter: capital management.
When you reach the first target, save some money and then change your stop-loss order to an entry order.
For inquiries, please leave a comment.
Thank you.

SUIUSDTThe chart is on best support but I not see confirmation candle or volume of buy for entry.
Next level is for best support is 2.91$. I think the price will touch this level with a shadow. What are you think?
