#SUI/USDT#SUI
The price is moving within a descending channel on the hourly timeframe. It has reached the lower boundary and is heading towards a breakout, with a retest of the upper boundary expected.
The Relative Strength Index (RSI) is showing a downward trend, approaching the lower boundary, and an upward bounce is anticipated.
There is a key support zone in green at 1.45, and the price has bounced from this level several times. Another bounce is expected.
The indicator is showing a trend towards consolidation above the 100-period moving average, which we are approaching, supporting the upward move.
Entry Price: 1.50
First Target: 1.52
Second Target: 1.56
Third Target: 1.60
Stop Loss: Below the green support zone.
Remember this simple thing: Money management.
For any questions, please leave a comment.
Thank you.
SUIUSD

SUI🚀 SUI Expansion Pattern Analysis – High-Probability Bullish Setup
Based on the current market structure, SUI appears to be developing an Expansion pattern, with Wave D nearing completion. This setup is a classic structure often used by market makers to accumulate liquidity from both buyers and sellers before a strong directional move.
The market is currently in the final stages of Wave D, which typically serves as a corrective phase within this pattern. Understanding this phase is crucial for traders who want to enter high-probability trades without chasing the market.
🟢 Key Support Zone & Wave E Outlook
The green highlighted zone on the chart represents the area where the bearish momentum of SUI is expected to exhaust. Once price reaches this zone, the market is likely to transition into Wave E, which in this pattern is inherently bullish.
From a trading perspective:
The green zone is ideal for DCA (Dollar-Cost Averaging) entries
Enter positions gradually rather than all at once to maximize risk-reward efficiency
Let the market confirm support before scaling in
🎯 Targets & Risk Management
All bullish targets are clearly marked on the chart for easy reference and trade planning
⚠️ Invalidation Level: A daily candle close below the invalidation level will negate this analysis and signal a structural failure
💡 Why This Pattern Matters
Expansion patterns like this are highly favored in trading because they:
Allow traders to enter near liquidity zones with a better risk-to-reward ratio
Highlight where market makers are likely to trap retail positions before a breakout
Provide a clear roadmap of expected wave progression, which is invaluable for planning entries and exits
By following this structure, traders can align with the market’s bullish momentum while minimizing unnecessary exposure to risk.
If you have a coin or altcoin you want analyzed, first hit the like button and then comment its name so I can review it for you.
This is not a trade setup, as it has no precise stop-loss, stop, or target. I do not publish my trade setups here.

SUI H1 Liquidity Sweep and Bullish FVG Reversal Setup📝 Description
After a clear distribution phase, BINANCE:SUIUSDT price executed a strong sell-side liquidity sweep and is now reacting from an H4 Fair Value Gap at discount, suggesting potential accumulation and corrective upside.
________________________________________
📈 Signal / Analysis
Primary Bias: Bullish while price holds above the swept liquidity low
Preferred Setup:
• Entry: 1.5543
• Stop Loss: Below 1.5322
• TP1: 1.5891
• TP2: 1.6428
• TP3: 1.6916 (HTF draw / prior distribution range)
________________________________________
🎯 ICT & SMC Notes
• Sell-side liquidity fully swept below range lows
• Strong displacement into H4 FVG
• Current structure shows absorption, not continuation
________________________________________
🧩 Summary
As long as price remains above the liquidity sweep low and holds inside the H4 FVG, a bullish corrective move toward higher PD arrays remains favored.
________________________________________
🌍 Fundamental Notes / Sentiment
With no fresh bearish catalyst and post-distribution liquidation completed, short-term sentiment supports a relief rally scenario.
________________________________________
⚠️ Risk Disclosure
Trading involves substantial risk and may result in capital loss. This analysis is for educational purposes only and does not constitute financial advice. Always apply proper risk management, predefined stop-loss levels, and disciplined position sizing aligned with your trading plan.

SUI Rock-n-Roll HandsTariffs or no tariffs—Greenland or no Greenland—SUI began breaking down well over seven days ago. The structure was already in place.
On January 14, SUI completed what I refer to as “rock and roll hands”: a long-duration double top with extended consolidation between the two peaks. This was not a sudden reaction to macro headlines, but a mature technical formation reaching resolution.
The retracement that occurred on Sunday, January 18 aligns perfectly with the wick printed on December 28, and it cleanly tags the 0.786 Fibonacci retracement when measured from $1.39 on December 31 to the $2.00 peak on January 5. The symmetry here is hard to ignore.
Given this alignment, there should be no surprise that SUI followed through to the downside. While macroeconomic factors may have acted as the catalyst, the move itself was technically inevitable.
Now that price has reached $1.51, SUI appears primed for another attempt at the $2.00 level.

#SUI/USDT – Bullish Triangle Breakout Confirmed | Resistance#SUI
The price is moving within a descending channel on the hourly timeframe. It has reached the lower boundary and is heading towards a breakout, with a retest of the upper boundary expected.
The Relative Strength Index (RSI) is showing a downward trend, approaching the lower boundary, and an upward bounce is anticipated.
There is a key support zone in green at 1.76, and the price has bounced from this level several times. Another bounce is expected.
The RSI is showing a trend towards consolidation above the 100-period moving average, which we are approaching, supporting the upward move.
Entry Price: 1.81
First Target: 1.85
Second Target: 1.90
Third Target: 1.94
Stop Loss: Below the green support zone.
Remember this simple thing: Money management.
For any questions, please leave a comment.
Thank you.

#SUI/USDT – Bullish Triangle Breakout Confirmed | Resistance#SUI
The price is moving within a descending channel on the hourly timeframe. It has reached the lower boundary and is heading towards a breakout, with a retest of the upper boundary expected.
The Relative Strength Index (RSI) is showing a downward trend, approaching the lower boundary, and an upward bounce is anticipated.
There is a key support zone in green at 1.80, and the price has bounced from this level several times. Another bounce is expected.
The RSI is showing a trend towards consolidation above the 100-period moving average, which we are approaching, supporting the upward move.
Entry Price: 1.81
First Target: 1.85
Second Target: 1.90
Third Target: 1.94
Stop Loss: Below the green support zone.
Remember this simple thing: Money management.
For any questions, please leave a comment.
Thank you.

#SUI/USDT RSI Exhaustion and Bearish Pullback Setup#SUI
The price is moving in an ascending channel on the 1-hour timeframe. It has reached the upper limit and is heading towards breaking it. A retest of the upper limit is expected.
We have an upward trend on the RSI indicator, which has reached near the upper limit. A downward reversal is expected.
There is a key support zone in green at the 2.00 price level. The price has bounced from this level multiple times and is expected to bounce from it again.
We have a trend of consolidation above the 100-period moving average, as we are moving close to it. This supports a downward move towards touching this level.
Entry price: 1.96
First target: 1.95
Second target: 1.90
Third target: 1.84
Stop loss: Above the resistance zone in green.
Don't forget a simple thing: money management.
For inquiries, please leave a comment.
Thank you.

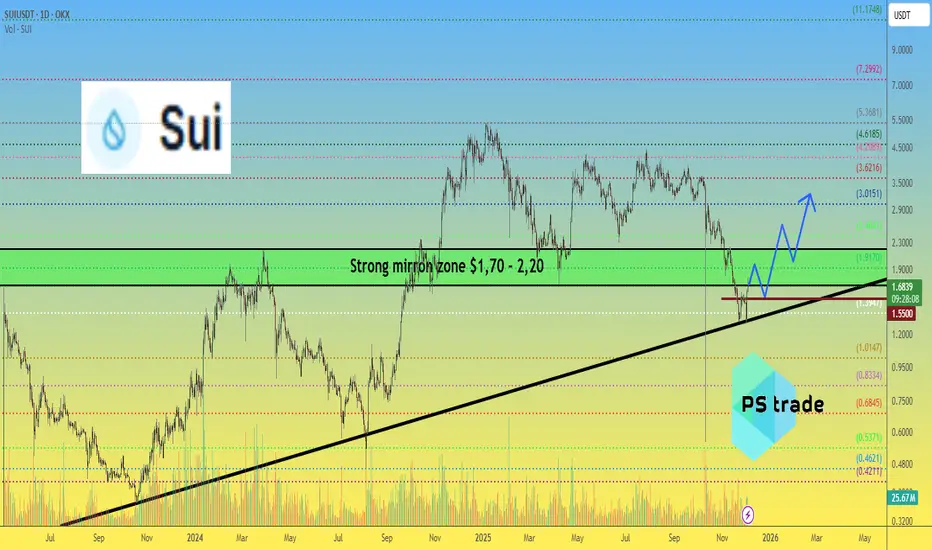
SUI price Update — Double Bottom & Next Targets📉 In November, the price of CRYPTOCAP:SUI was saved twice right at the edge — perfectly on the trendline support, forming a classic double bottom.
📈 Yesterday we finally saw the effect: a strong +30% pump, and the full technical target of this pattern points directly toward $2.
But what comes next is where it gets interesting:
🔹 Buyers must not allow OKX:SUIUSDT to drop below $1.55 — that’s the critical structural level.
🔹 Then CRYPTOCAP:SUI needs to break out and firmly hold above the mirror zone at $1.70–2.20.
🔹 And afterward… it must push through $3, opening the road to much bigger levels.
🎯 Just a few “simple” steps 😄 — and the pathway toward $7, or even $11, becomes fully realistic for #SUI.
🤔 What do YOU think: is CRYPTOCAP:SUI entering its next expansion phase?
______________
◆ Follow us ❤️ for daily crypto insights & updates!
🚀 Don’t miss out on important market moves
🧠 DYOR | This is not financial advice, just thinking out loud
#SUI/USDT – Bullish Triangle Breakout Confirmed | Resistance #SUI
The price is moving in a descending channel on the 1-hour timeframe and is expected to break out and continue upwards.
We have a trend to stabilize above the 100-period moving average again.
We have a downtrend on the RSI indicator, which supports an upward move if it breaks above it.
We have a key support zone in green that pushed the price higher at 1.75.
Entry price: 1.77
First target: 1.80
Second target: 1.84
Third target: 1.88
For risk management, don't forget your stop-loss and capital management.
The stop-loss is below the support zone in green.
Upon reaching the first target, take some profit and then change your stop-loss order to an entry order.
For any questions, please comment.
Thank you.

SUI is on the verge of another rally (4H)From the point where we marked the green arrow on the chart, a bullish phase has started on SUI. This area acted as a key reaction zone where buyers stepped in decisively, shifting market sentiment from corrective to bullish.
Based on the current price structure, it appears that we are developing an ABC corrective pattern. In this structure, Wave B has formed as a triangle, which is a common consolidation pattern before continuation. The triangle suggests decreasing volatility and balance between buyers and sellers before the next impulsive move.
At the moment, price action indicates that we are still inside Wave B, with one final sub-wave remaining wave “e” of the triangle. Once this last leg of the triangle is completed, the corrective phase should be fully exhausted.
After the completion of this final wave, the market is expected to resume its bullish move in the form of Wave C, which typically unfolds as a strong impulsive rally. This next move should bring expansion in both momentum and volume compared to the corrective structure we are currently seeing.
To manage risk and execution efficiently, two entry zones have been clearly marked on the chart, and positions should be built using a DCA (Dollar-Cost Averaging) approach rather than a single entry. This allows better positioning in case of short-term volatility during the end of Wave B.
The projected targets for Wave C are also outlined on the chart, based on classical Elliott Wave projections and prior market structure. These levels represent logical areas where partial or full profit-taking can be considered.
⚠️ Invalidation:
This analysis will be invalidated if a candle closes below the marked invalidation level. A confirmed close below that level would indicate that the current wave structure is no longer valid and that the market may be transitioning into a different scenario.
As always, this setup is based on technical structure and probability, not certainty. Proper risk management is essential.
If you have a coin or altcoin you want analyzed, first hit the like button and then comment its name so I can review it for you.
This is not a trade setup, as it has no precise stop-loss, stop, or target. I do not publish my trade setups here.

#SUI/USDT Could switch sides soon. Be ready#SUI
The price is moving in a descending channel on the 1-hour timeframe. It has reached the lower boundary and is heading towards a breakout, with a retest of the upper boundary expected.
We are seeing a bearish trend in the Relative Strength Index (RSI), which has reached near the lower boundary, and an upward bounce is expected.
There is a key support zone in green at 1.37, and the price has bounced from this level several times. Another bounce is expected.
We are seeing a trend towards stabilizing above the 100-period moving average, which we are approaching, supporting the upward trend.
Entry Price: 1.40
First Target: 1.431
Second Target: 1.465
Third Target: 1.50
Remember a simple principle: Money Management.
Place your stop-loss order below the green support zone.
For any questions, please leave a comment.
Thank you.

#SUI/USDT Could switch sides soon. Be ready#SUI
The price is moving in a descending channel on the 1-hour timeframe. It has reached the lower boundary and is heading towards breaking above it, with a retest of the upper boundary expected.
We have a downtrend on the RSI indicator, which has reached near the lower boundary, and an upward rebound is expected.
There is a key support zone in green at 1.40. The price has bounced from this zone multiple times and is expected to bounce again.
We have a trend towards consolidation above the 100-period moving average, as we are moving close to it, which supports the upward movement.
Entry price: 1.43
First target: 1.46
Second target: 1.50
Third target: 1.56
Don't forget a simple principle: money management.
Place your stop-loss below the support zone in green.
For any questions, please leave a comment.
Thank you.

SUI/USDT - Breakouts! Is This the Start of a Trend Reversal?On the 12-hour timeframe, SUI/USDT has successfully broken above the descending resistance trendline that had capped price action since October. This breakout indicates weakening selling pressure and opens the door for a trend transition from bearish toward early bullish conditions.
Price is currently trading around 1.48 USDT, hovering near the former trendline area, suggesting a post-breakout consolidation / retest phase.
---
Pattern Explanation
The dominant technical structure now is:
Descending Trendline Breakout (Potential Trend Reversal)
The long-term descending trendline has been decisively broken
Bearish lower-high structure is losing control
Sideways movement above the trendline suggests a successful retest attempt
Technically, this pattern often marks the early stage of a trend reversal, as long as price holds above the breakout zone.
---
Key Levels
Support (Post-Breakout):
1.45 – 1.48 USDT → Critical breakout retest zone
1.35 USDT → Invalidation level
Resistance / Upside Targets:
1.65 – 1.72 USDT → Nearest resistance
1.96 USDT → Strong supply zone
2.05 – 2.37 USDT → Major resistance area
2.70 USDT → Extended bullish target if reversal fully develops
---
Bullish Scenario (Primary Scenario)
The bullish case becomes the primary scenario if:
1. Price holds above the 1.45 – 1.48 USDT support zone
2. The former trendline acts as new support
3. Bullish continuation candles appear
Bullish Targets:
TP1: 1.65 USDT
TP2: 1.72 USDT
TP3: 1.96 USDT
TP4: 2.05 – 2.37 USDT
---
Bearish Scenario (Invalidation Scenario)
The bearish scenario only applies if:
1. Price falls back below the broken trendline
2. A strong close occurs below 1.35 USDT
Bearish Targets:
1.23 USDT
Lower supports if selling pressure accelerates
As long as price remains above the breakout area, bearish continuation is not favored.
---
Conclusion
The breakout above the descending trendline on SUI/USDT represents a potential early trend reversal signal. The key focus now is whether price can defend the breakout zone as support.
➡️ Holding above support = bullish continuation
➡️ Break back below = false breakout
This is a critical decision zone for the next directional move.
---
#SUIUSDT #SUIBreakout #TrendReversal #CryptoAnalysis #TechnicalAnalysis #Altcoin #SupportResistance #CryptoTrading

#SUI/USDT Could switch sides soon. Be ready#SUI
The price is moving in a descending channel on the 1-hour timeframe. It has reached the lower boundary and is heading towards breaking above it, with a retest of the upper boundary expected.
We have a downtrend on the RSI indicator, which has reached near the lower boundary, and an upward rebound is expected.
There is a key support zone in green at 1.38. The price has bounced from this zone multiple times and is expected to bounce again.
We have a trend towards consolidation above the 100-period moving average, as we are moving close to it, which supports the upward movement.
Entry price: 1.40
First target: 1.42
Second target: 1.44
Third target: 1.48
Don't forget a simple principle: money management.
Place your stop-loss below the support zone in green.
For any questions, please leave a comment.
Thank you.

Rising Channel Breakdown → Waiting for Better Buy Prices on SUISUI has been moving inside a well-defined rising channel on the higher timeframe, forming higher highs and higher lows. However, price is now trading near the lower boundary of the channel , showing signs of weak momentum and potential breakdown.
Historically, a loss of the rising channel support often leads to a deeper corrective move, especially after an extended uptrend. Current structure suggests that downside continuation is more likely before any sustainable bullish scenario.
📌 Key points:
Long-term ascending channel
Price approaching / losing channel support
Increased risk of trend exhaustion and correction
🎯 Downside targets:
Target 1: $0.60
Target 2: $0.25
🛑 Conclusion:
At current levels, buying SUI is not attractive from a risk-reward perspective. A better strategy is to wait for deeper pullbacks and signs of stabilization near the mentioned targets before considering long positions.
This is a patience trade — better prices are likely ahead.

SUIUSD; Heikin Ashi Trade Idea📈 Hey Traders!
Here’s a fresh outlook from my trading desk. If you’ve been following me for a while, you already know my approach:
🧩 I trade Supply & Demand zones using Heikin Ashi chart on the 4H timeframe.
🧠 I keep it mechanical and clean — no messy charts, no guessing games.
❌ No trendlines, no fixed sessions, no patterns, no indicator overload.
❌ No overanalyzing market structure or imbalances.
❌ No scalping, and no need to be glued to the screen.
✅ I trade exclusively with limit orders, so it’s more of a set-and-forget style.
✅ This means more freedom, less screen time, and a focus on quality setups.
✅ Just a simplified, structured plan and a calm mindset.
💬 Let’s Talk:
💡Do you trade supply & demand too ?
💡What’s your go-to timeframe ?
💡Ever tried Heikin Ashi ?
📩 Got questions about my strategy or setup? Drop them below — ask me anything, I’m here to share.
Let’s grow together and keep it simple. 👊

SUI SUIUSD SUIUSDT 3D-1W TFWe observe a global ascending channel with clearly defined buy and sell zones where the sell zones on the chart are marked sequentially as 1, 2, 3, and 4.
In addition, there is a secondary descending channel, which indicates that the current price is located within an area of global (long-term) accumulation.
At these levels it is already reasonable to start building a position, while keeping in mind that the price may still be pushed lower.
If further downside occurs it will represent an even better opportunity for accumulation. If the price does not go lower - the current entries remain justified.
In the event of a continuation within the descending channel and a confirmed breakout and consolidation above the red zone, a price move toward the maximum target in the purple zone.
All possible scenarios are illustrated on the chart.

Start of a full-blown uptrend: 2.0-2.1446
Hello, traders!
Follow us to get the latest information quickly.
Have a great day!
-------------------------------------
(SUIUSDT 1M chart)
To continue the uptrend, the price must rise above the M-Signal indicator on the 1M chart and hold.
Accordingly, the key question is whether the price can rise above the 2.0-2.1446 range and maintain its upward momentum.
If the upward movement fails, we should observe whether the M-Signal indicator on the 1M chart moves sideways until it declines near the Fibonacci level of 0.236 (1.3434).
-
(1W chart)
The key question is whether the price can find support and rise near the newly forming DOM (-60) ~ HA-Low range (1.4969-1.8396).
Based on the basic trading strategy, the target range is around the 4.2272-4.7328 range.
However, caution is advised when trading, as the price is currently forming below the M-Signal indicator on the 1M chart.
Therefore, I think it's best to start trading after confirming whether the price rises to around 2.0-2.1446 and maintains its strength.
-
(1D Chart)
When analyzing charts, it's best to observe the movements of the 1D chart as a basic trading strategy.
This is because most indicators are derived from the 1D chart.
In this sense, the key is whether the price can find support and rise around the 1.3451-1.5174 range, which is the DOM(-60) ~ HA-Low range on the 1D chart.
As mentioned earlier, to sustain the uptrend from a long-term perspective, the price must remain above the M-Signal indicator on the 1M chart. Therefore, the current price level is not suitable for trading.
A decline in the DOM(-60) ~ HA-Low range could lead to a step-down trend.
This means that the price is renewing its low, but it can also be considered a time for a split buy.
Therefore, you should consider how to execute a split buy before starting a trade.
If the price rises from the DOM(-60) to HA-Low range, the HA-High to DOM(60) range will form.
Therefore, if you bought near the DOM(-60) to HA-Low range, you should sell near the HA-High to DOM(60) range.
However, if the price rises from the HA-High to DOM(60) range, it's likely to form a step-up trend, so it's recommended to sell in steps.
As mentioned earlier, a step-up trend, like a step-down trend, means that the price is renewing its high.
Therefore, since a sharp decline is possible at any time, it's advisable to sell in steps at the appropriate time to secure profits.
-
In summary, if you encounter the DOM(-60) or HA-Low indicators, you should focus on finding the right time to buy and consider how to execute the split purchase.
Furthermore, if you encounter the DOM(60) or HA-High indicators, you should focus on finding the right time to sell and consider how to execute the split purchase.
This is the basic trading strategy.
If not, and you buy when the HA-High ~ DOM(60) range supports and rises, or sell when the DOM(-60) ~ HA-Low range resists and falls, it's best to maintain your stop loss.
-
Thank you for reading to the end.
I wish you successful trading.
--------------------------------------------------

SUI/USDT : LIMITHello friends
As you can see, after the resistance level we set was broken, the price has grown well, and now with this bullish trend, there is a sign of sellers entering, and there is a possibility of price correction, and the price can grow again from these areas and move to our targets.
This analysis is technically reviewed and is not a buy or sell recommendation, so please follow risk and capital management.
*Trade safely with us*

SUI/USD - Weekly Chart AnalysisThe price action on the weekly timeframe shows SUI moving within a well-defined bullish flag pattern, characterized by a strong impulsive move upward followed by a controlled, downward-sloping consolidation channel.
🔹 Pattern Structure
The overall structure forms a bullish flag, which is typically a continuation pattern appearing after a strong upward rally.
The price is currently trading near the lower boundary of the flag, an area that has historically acted as dynamic support throughout the consolidation phase.
The repeated bounces from this region highlight ongoing demand and suggest the pattern remains valid.
🔹 Market Behavior
The pullback within the flag appears orderly, with price respecting the upper and lower trendlines of the channel.
Volume behavior also supports the flag structure:
Momentum expanded during the impulsive rally, then contracted during consolidation—typical of a healthy continuation setup.
🔹 Potential Scenario
If the lower boundary continues to hold:
The chart suggests a potential upward breakout from the flag.
This breakout would align with the larger trend and indicate a continuation of the previous bullish leg.
A breakout from the flag’s upper trendline would confirm the move and open the way for a new expansion phase.
🔹 Summary
SUI is consolidating within a bullish flag, maintaining its structure and showing signs of strength at support. As long as the lower channel boundary remains intact, the pattern favors a continuation of the broader uptrend.

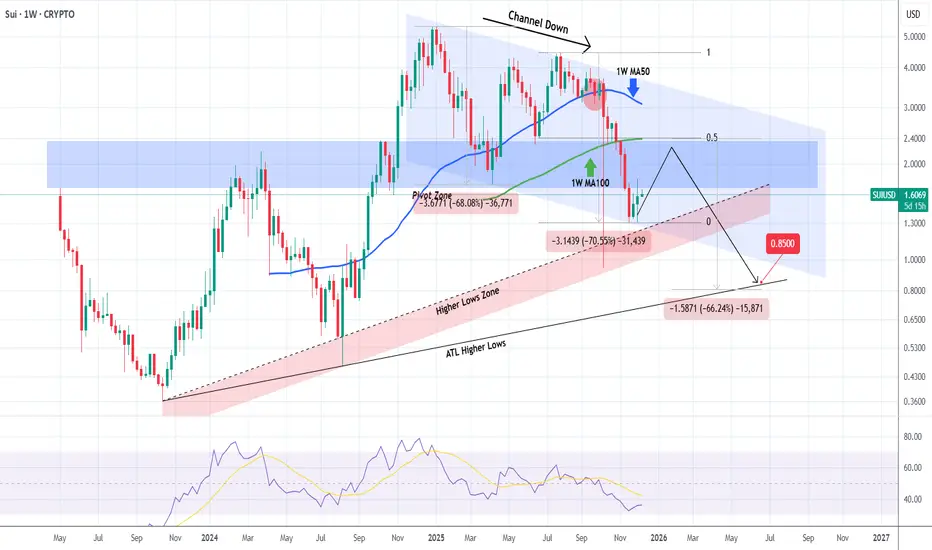
SUIUSD can target $0.85 after this dead-cat bounce is over.A month ago (November 05, see chart below) we gave a strong sell signal on Sui (SUIUSD), targeting 1.4320 right at the bottom of its 1-year Channel Down:
The price made direct contact with the pattern's bottom (thus hitting our Target) and rebounded, pricing a Lower Low. Right now the market is in the process of forming the Bullish Leg of the Channel Up (1W RSI almost got oversold also), which we don't expect to be completed like the previous one as this is a dead-cat bounce at the time, limited by the 1W MA50 (blue trend-line), which is technically the Resistance during Bear Cycles.
The 0.5 Fibonacci retracement level is also at a cluster level were the 1W MA50 could reject this bounce along with the 1W MA100 (green trend-line). We believe that the next Bearish Leg will likely break below the Channel Down and target the All Time Low Higher Lows trend-line around 0.8500, which will be a -66.00% decline from the top, similar to the previous two selling sequences.
---
** Please LIKE 👍, FOLLOW ✅, SHARE 🙌 and COMMENT ✍ if you enjoy this idea! Also share your ideas and charts in the comments section below! This is best way to keep it relevant, support us, keep the content here free and allow the idea to reach as many people as possible. **
---
💸💸💸💸💸💸
👇 👇 👇 👇 👇 👇
#SUI/USDT Could switch sides soon. Be ready#SUI
The price is moving in a descending channel on the 1-hour timeframe. It has reached the lower boundary and is heading towards breaking above it, with a retest of the upper boundary expected.
We have a downtrend on the RSI indicator, which has reached near the lower boundary, and an upward rebound is expected.
There is a key support zone in green at 1.33. The price has bounced from this zone multiple times and is expected to bounce again.
We have a trend towards consolidation above the 100-period moving average, as we are moving close to it, which supports the upward movement.
Entry price: 1.35
First target: 1.38
Second target: 1.42
Third target: 1.46
Don't forget a simple principle: money management.
Place your stop-loss below the support zone in green.
For any questions, please leave a comment.
Thank you.

FireHoseReel | SUI Under Strong Accumulation Pressure🔥 Welcome to FireHoseReel!
Let’s jump into the SUI analysis.
👀 SUI – 4H Overview
After forming a double-bottom structure around $1.34, SUI has started moving higher and is now approaching its major resistance with strong buying momentum.
📊 SUI Volume Analysis
SUI volume has increased significantly, while selling pressure has weakened. This shift is allowing price to move higher smoothly.
As long as buy volume remains sustained, SUI can continue the upside move it has initiated.
✍️ SUI Trading Scenarios
🟢 Long Scenario
A break above $1.5855, confirmed by continuing buy volume, activates the long setup.
Ideally, wait for a reaction → pullback with lower volume → renewed volume expansion to enter with an early trigger and better risk control.
🔴 Short Scenario
A break below the current double-bottom support at $1.3144, accompanied by a strong increase in sell volume, could provide a valid short setup.
❤️ Risk Management & Emotional Discipline
Crypto trading is highly risky. Without proper risk management and emotional control, trading is no different from gambling.
Logic must always come before emotions. Learn to manage your trades—and enjoy the process with control and discipline.
