#SUI/USDT Could switch sides soon. Be ready#SUI
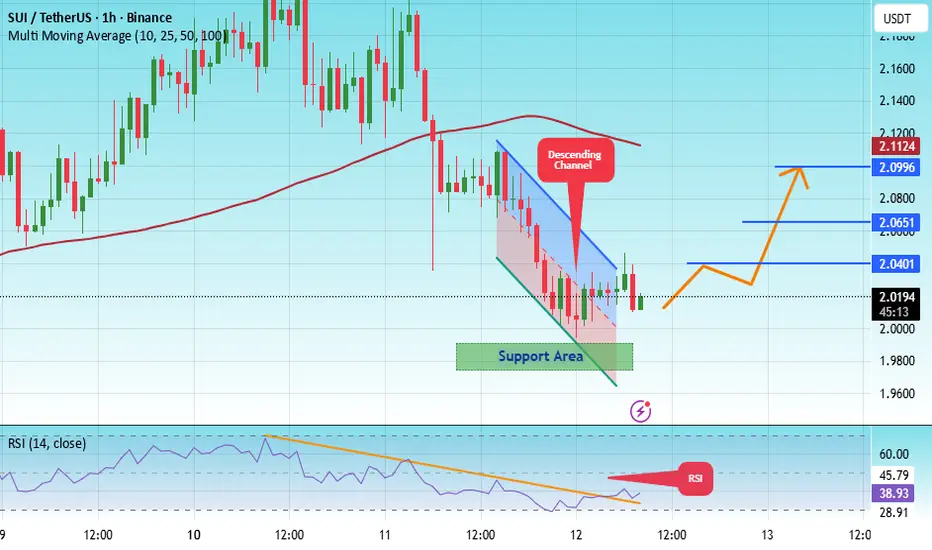
The price is moving in a descending channel on the 1-hour timeframe. It has reached the lower boundary and is heading towards breaking above it, with a retest of the upper boundary expected.
We have a downtrend on the RSI indicator, which has reached near the lower boundary, and an upward rebound is expected.
There is a key support zone in green at 1.33. The price has bounced from this zone multiple times and is expected to bounce again.
We have a trend towards consolidation above the 100-period moving average, as we are moving close to it, which supports the upward movement.
Entry price: 1.35
First target: 1.38
Second target: 1.42
Third target: 1.46
Don't forget a simple principle: money management.
Place your stop-loss below the support zone in green.
For any questions, please leave a comment.
Thank you.
SUIUSD

FireHoseReel | SUI Under Strong Accumulation Pressure🔥 Welcome to FireHoseReel!
Let’s jump into the SUI analysis.
👀 SUI – 4H Overview
After forming a double-bottom structure around $1.34, SUI has started moving higher and is now approaching its major resistance with strong buying momentum.
📊 SUI Volume Analysis
SUI volume has increased significantly, while selling pressure has weakened. This shift is allowing price to move higher smoothly.
As long as buy volume remains sustained, SUI can continue the upside move it has initiated.
✍️ SUI Trading Scenarios
🟢 Long Scenario
A break above $1.5855, confirmed by continuing buy volume, activates the long setup.
Ideally, wait for a reaction → pullback with lower volume → renewed volume expansion to enter with an early trigger and better risk control.
🔴 Short Scenario
A break below the current double-bottom support at $1.3144, accompanied by a strong increase in sell volume, could provide a valid short setup.
❤️ Risk Management & Emotional Discipline
Crypto trading is highly risky. Without proper risk management and emotional control, trading is no different from gambling.
Logic must always come before emotions. Learn to manage your trades—and enjoy the process with control and discipline.

SUI/USDT : SELL LIMIT
Hello friends
you can see that the price is moving in a range with a slight upward slope, and every time it hits the specified support, the power of buyers decreases, and now, in the last hit that we have identified, it seems that the price will not be able to record a higher ceiling and we will witness a price drop.
This analysis is purely technically reviewed and is not a buy or sell recommendation, so do not act emotionally and observe capital management.
*Trade safely with us*

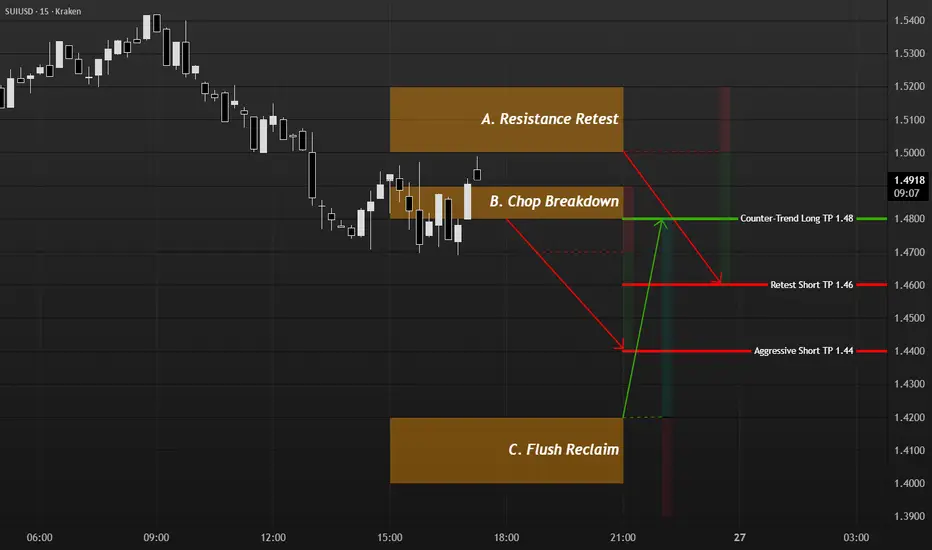
SUI intraday while BTC stallsBTC is chopping at key levels, so I’m not forcing trades there. Instead I’m using SUI on Kraken: strong push up from 1.33 to 1.55 on 24th, then clear distribution and break lower, which gives three structured ideas.
A. Base case: short a failed retest of 1.50–1.52 after rejection, invalidation above 1.54–1.55, targeting 1.46 then 1.42.
B. Aggressive: if price grinds under 1.48 and breaks, I look to sell a retest from below with the same invalidation and target at 1.44.
C. Counter-trend: I only consider a long after a sharp flush into 1.40–1.42 and a clean reclaim on 15m; below 1.40 the bounce idea is off.
This is a map, not signals. I size so a full stop costs about 0.5% of equity and take partial profits at the first target.
#SUI/USDT Could switch sides soon. Be ready#SUI
The price is moving in a descending channel on the 1-hour timeframe and is expected to break out and continue upwards.
We have a trend to stabilize above the 100-period moving average again.
We have a downtrend on the RSI indicator, which supports an upward move if it breaks above it.
We have a key support zone in green that pushed the price higher at 1.292.
Entry price: 1.325
First target: 1.372
Second target: 1.427
Third target: 1.497
For risk management, don't forget your stop-loss and money management.
The stop-loss is below the support zone in green.
Upon reaching the first target, take some profit and then change your stop-loss order to an entry order.
For any questions, please comment.
Thank you.

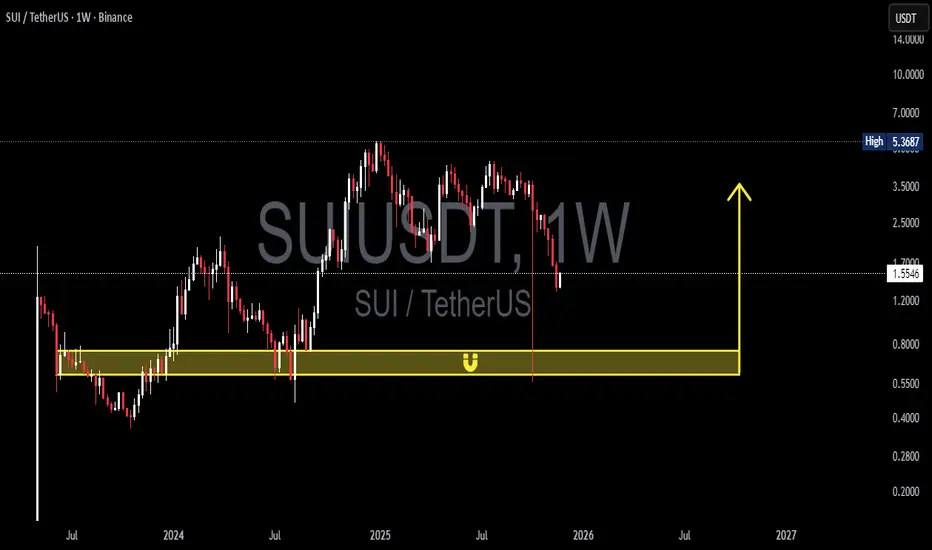
SUI/USDT — Massive Accumulation or Full Capitulation?SUI is standing right at the gateway where its entire macro cycle will be decided.”
The weekly chart reveals something uncommon: a sharp drop, deep liquidity sweep, and precise retest of the historical demand zone at 0.75–0.60 — the exact area that launched SUI’s major rally back in early 2024.
Moves like this usually indicate that smart money is revisiting an old accumulation zone, testing whether institutional demand is still alive or completely gone.
And right now…
SUI is back where its big story originally began.
---
🔥 Why the 0.75–0.60 Demand Zone Matters
Because this is the zone where:
The strongest historical sell-off was completely absorbed.
Large buyers first stepped in.
Institutional volume was concentrated.
And now: the zone where SUI’s macro trend will be determined again.
Price dropped into this zone with a large weekly candle, followed by a deep wick — a signature liquidity grab, meaning retail stop-loss orders have been taken out.
If demand reactivates here, SUI can enter a multi-month reversal phase.
If not… we enter capitulation territory.
---
📈 Bullish Scenario — “The Rebirth Case”
Bullish confirmation appears if:
Weekly forms a reversal candle / bullish engulfing inside the 0.75–0.60 block.
Volume spikes during the bounce.
Price reclaims 1.55, shifting structure from lower-high to neutral-bullish.
Upside targets:
1. 1.20–1.30
2. 2.20–2.50 (major supply zone)
3. 3.50+
4. Retest major high at 5.36 if momentum expands
If this unfolds, SUI could form a rare weekly V-shape accumulation return.
---
📉 Bearish Scenario — “The Breakdown Phase”
Bearish confirmation appears if:
Weekly closes below 0.60
Retest of 0.75–0.60 gets strongly rejected
This would flip the demand zone into new supply, signaling a macro distribution phase.
Downside targets:
0.40 (psychological support)
0.28 (final structural base)
0.20 in a worst-case capitulation wave
A breakdown here marks a confirmed lower-low on the weekly structure — a bearish macro reversal.
---
🎯 Key Patterns Observed
Liquidity Sweep + Rejection Pattern at major demand
Macro Lower-High Formation from the 5.36 peak
Potential Wyckoff Spring
Long wick = “Spring Test”
Market now waiting for confirmation
Liquidity Void in mid-range → large impulsive moves likely once direction is chosen
---
🪙 Core Insight — Short & Simple
SUI is currently in a macro decision zone.
The 0.75–0.60 block is the turning point that will decide whether this becomes:
a major long-term reversal, or
the beginning of a deep multi-month downtrend.
The weekly reaction from this zone will define SUI’s next big trend.
#SUI #SUIUSDT #CryptoTA #WeeklyChart #DemandZone #SmartMoneyConcepts #Wyckoff #LiquiditySweep #CryptoAnalysis #AltcoinOutlook #PriceAction
SUI TA (Y25.P4.Video1). Complete technical approachHi Traders,
Besides being an educational piece on how I approach the charts, we will dive into what is likely to play out from an Elliott Wave perpective and using support and resistance methods to find confluence with our fibonacci approach for levels to short and long.
I promise you newbies or intermediates, master this and you will have much more success in your trading. Experience obviously takes time.
All the best,
S.SAri

$SUI - Long term AnalysisShared MSS (Bear market) confirmed when this shitcoin was around $3.20.
now this is the bigger picture for the coming months..
(Nothing Guaranteed, It's just a scenario)

SUI/USDT Could switch sides soon. Be readySUI/USDT on the 1H chart appears to have completed a downward correction. The price action has followed a large descending channel and what looks like a corrective structure, ending with a final five-wave move.
Key Levels
Potential Entry: Upon confirmation of the breakout above $1.62.
Target 1: $1.9 (50% of the previous down trend)
Target 2: $1.973 (61% of the previous down trend)
Target 3: $2.070 (Testing previous resistance zone)
Invalidation/Stop-Loss: A move and close below the wave (5) low around $1.50
What do you do? Look for a bullish break with high volume from the immediate small consolidation pattern, then take your longs.
Good Luck!

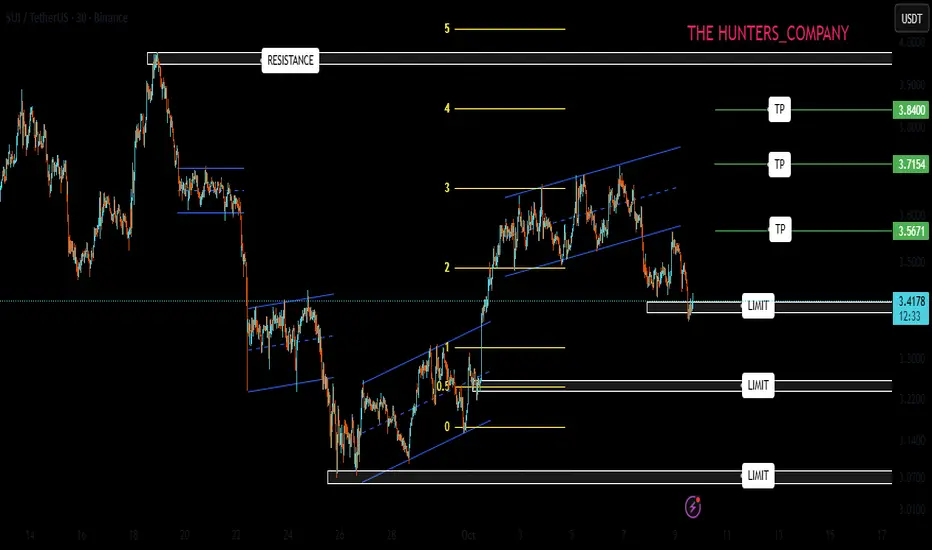
SUI/USDT:LIVE TRADEHello friends
First of all, I must say that risk and capital management should be observed and any decision-making is your responsibility.
Given the decline we had, we now see that buyers have entered and are one by one setting higher ceilings and floors, which will cause the price to rise to the specified targets if the specified resistance is broken.
*Trade safely with us*

#SUI/USDT – Bullish Triangle Breakout Confirmed | Resistance Li#SUI
The price is moving within an ascending channel on the 1-hour timeframe and is adhering to it well. It is poised to break out strongly and retest the channel.
We have a downtrend line on the RSI indicator that is about to break and retest, which supports the upward move.
There is a key support zone in green at the price of 1.98, representing a strong support point.
We have a trend to stabilize above the 100-period moving average.
Entry price: 2.02
First target: 2.04
Second target: 2.06
Third target: 2.02
Don't forget a simple money management tip:
Place your stop-loss order below the support zone in green.
Once you reach the first target, save some money and then change your stop-loss order to an entry order.
For any questions, please leave a comment.
Thank you.
#SUI/USDT The Interesting part of the market#SUI
The price is moving in a descending channel on the 1-hour timeframe and is expected to break out and continue upwards.
We have a trend to stabilize above the 100-period moving average again.
We have a downtrend on the RSI indicator, which supports an upward move if it breaks above it.
We have a key support zone in green that pushed the price up to 1.93.
Entry price: 1.96
First target: 1.97
Second target: 2.02
Third target: 2.04
For risk management, don't forget your stop-loss and capital management.
The stop-loss is below the support zone in green.
Upon reaching the first target, take some profit and then change your stop-loss order to an entry order.
For any questions, please comment.
Thank you.

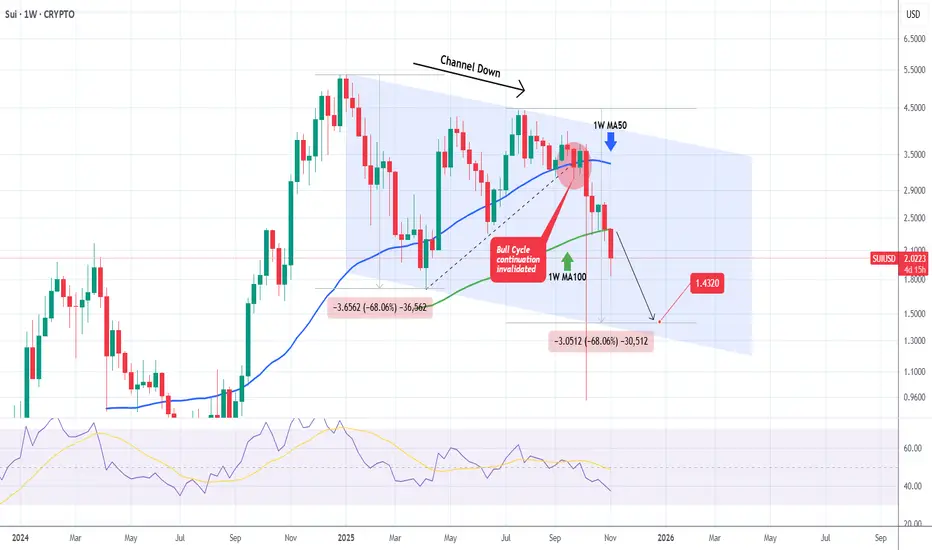
SUIUSD Channel Down to accelerate more selling towards 1.4320.Sui (SUIUSD) has established a Channel Down on the 1W time-frame, trading under Lower Highs since the December 30 2024 High. The Bull Cycle got invalidated on September 22 2025 when the price broke below the inner Higher Lows trend-line (dashed) and this week may confirm the new Bear Cycle as it will most likely close a 1W candle below the 1W MA100 (green trend-line).
We expect the current decline to repeat at least the -68.06% drop of the first Bearish Leg of the pattern and targe 1.4320.
-------------------------------------------------------------------------------
** Please LIKE 👍, FOLLOW ✅, SHARE 🙌 and COMMENT ✍ if you enjoy this idea! Also share your ideas and charts in the comments section below! This is best way to keep it relevant, support us, keep the content here free and allow the idea to reach as many people as possible. **
-------------------------------------------------------------------------------
💸💸💸💸💸💸
👇 👇 👇 👇 👇 👇
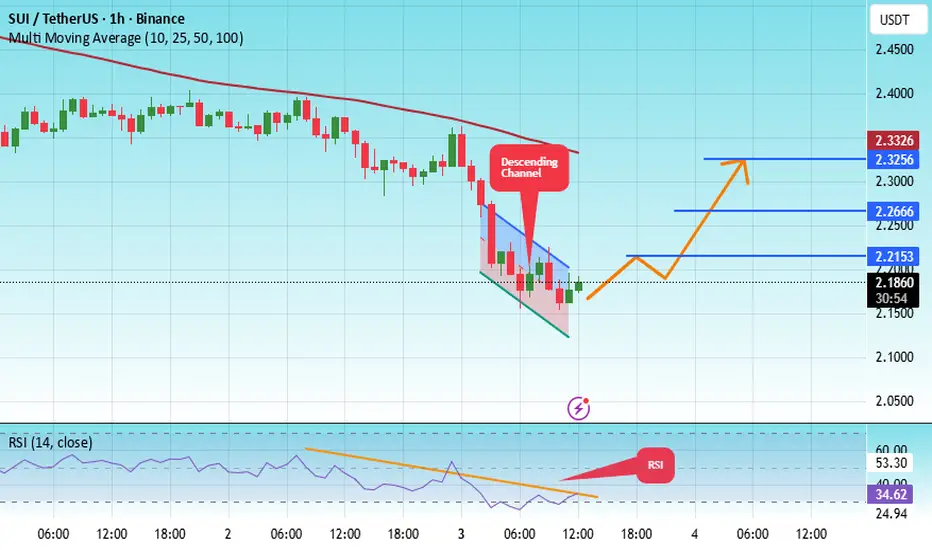
#SUI/USDT The Interesting part of the market#SUI
The price is moving within an ascending channel on the 1-hour timeframe and is adhering to it well. It is poised to break out strongly and retest the channel.
We have a downtrend line on the RSI indicator that is about to break and retest, which supports the upward move.
There is a key support zone in green at the price of 2.14, representing a strong support point.
We have a trend of consolidation above the 100-period moving average.
Entry price: 2.18
First target: 2.215
Second target: 2.26
Third target: 2.32
Don't forget a simple money management rule:
Place your stop-loss order below the support zone in green.
Once the first target is reached, save some money and then change your stop-loss order to an entry order.
For any questions, please leave a comment.
Thank you.
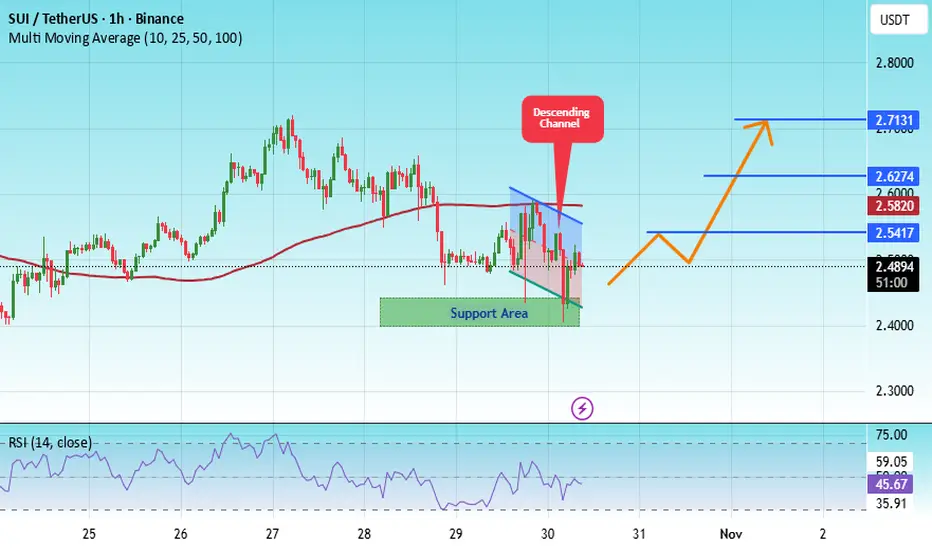
#SUI/USDT The Interesting part of the market#SUI
The price is moving within an ascending channel on the 1-hour timeframe and is adhering to it well. It is poised to break out strongly and retest the channel.
We have a downtrend line on the RSI indicator that is about to break and retest, which supports the upward move.
There is a key support zone in green at the price of 2.42, representing a strong support point.
We have a trend to stabilize above the 100-period moving average.
Entry price: 2.49
First target: 2.61
Second target: 2.62
Third target: 2.71
Don't forget a simple point: money management.
Upon reaching the first target, save some money and then change your stop-loss order to an entry order.
For any questions, please leave a comment.
Thank you.
#SUI/USDT - Head and Shoulders Long#SUI
The price is moving within a descending channel on the 1-hour frame, adhering well to it, and is heading for a strong breakout and retest.
We have a bearish trend on the RSI indicator that is about to be broken and retested, which supports the upward breakout.
There is a major support area in green at 2.38, representing a strong support point.
We are heading for consolidation above the 100 moving average.
Entry price: 2.40
First target: 2.48
Second target: 2.54
Third target: 2.63
Don't forget a simple matter: capital management.
When you reach the first target, save some money and then change your stop-loss order to an entry order.
For inquiries, please leave a comment.
Thank you.

My point of View For SUIDear Follower
I got a multi request to analyze SUI
I see SUI most likely will hit $5.5 easily
I recommend liquidate 50% of your fund at that price then start use a trilling stop under each last new bottom for the rest of the fund
Good luck every one

SUI/USDT ; A decline is the best buying opportunity.Hello friends
Given the price decline that we are witnessing, the price has created good channels at the specified support and buyers have entered and supported the price, which is a good sign for the currency.
Now, given the trend reversal and the price being pushed up by buyers, we can buy in steps with risk and capital management and move towards the specified targets.
We have also identified an important level that if the price reaches it, a correction can be expected and it is very important to take profits in these areas.
*Trade safely with us*
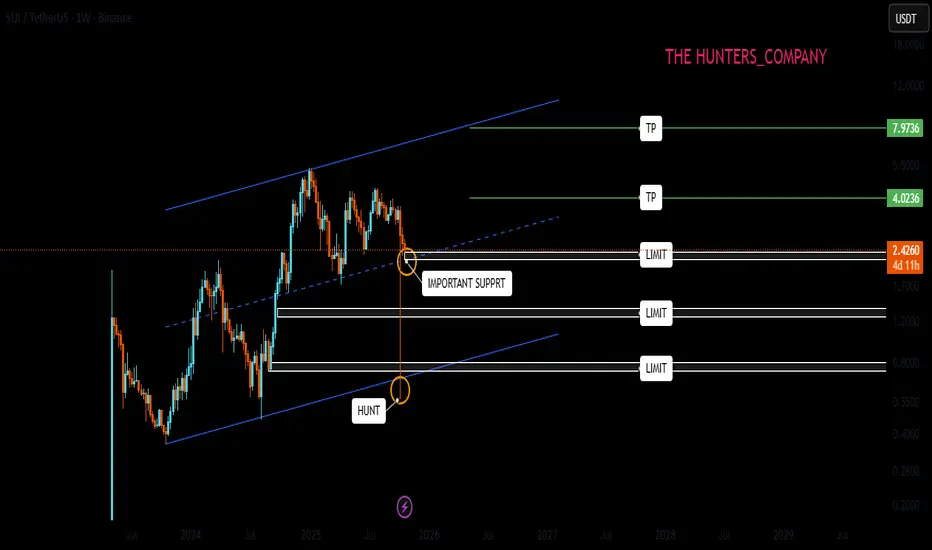
SUI ; The future of SUIHello friends
You see a long-term weekly channel that after setting a new ceiling in the weekly, the price corrected until the bottom of the channel even came below the channel, which many thought was destroyed, but the price returned and is now in an important range.
This weekly candle that guided you to the bottom of the channel is very important. There are many orders in the shadow of this candle and it is possible that the price will correct up to 50% of the shadow of the candle.
For this reason, the best way to buy is to manage risk and capital, and buy in steps in the specified areas and move with it to the set goals.
*Trade safely with us*
SUI Analysis (1H)It seems that an ABC pattern is forming on the 1-hour chart, with wave B already completed.
Wave B appears to have been a triangle.
A buy/long position can be entered on the pullback to the green zone.
The targets marked on the chart are for wave C, which is a bullish wave.
A daily candle close below the invalidation level would invalidate this analysis.
For risk management, please don't forget stop loss and capital management
Comment if you have any questions
Thank You

SUI New Update (1H)This analysis is an update of the analysis you see in the "Related publications" section
The trigger line has been broken, and the 4-hour full-body candle | which were our confirmations | have failed.
The wave B pattern has shifted from a triangle to a diametric formation, and it seems that the pattern is developing in the structure we’ve outlined on the chart.
Let’s wait and see what happens.
For risk management, please don't forget stop loss and capital management
When we reach the first target, save some profit and then change the stop to entry
Comment if you have any questions
Thank You

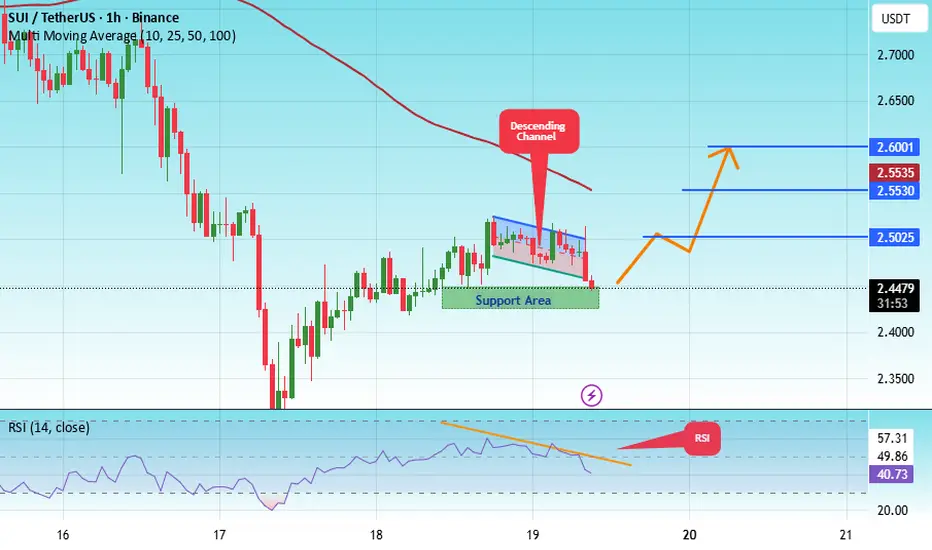
#SUI/USDT Bullish scenario#SUI
The price is moving within a descending channel on the 1-hour frame, adhering well to it, and is heading for a strong breakout and retest.
We have a bearish trend on the RSI indicator that is about to be broken and retested, which supports the upward breakout.
There is a major support area in green at 2.43, representing a strong support point.
We are heading for consolidation above the 100 moving average.
Entry price: 2.45
First target: 2.50
Second target: 2.55
Third target: 2.60
Don't forget a simple matter: capital management.
When you reach the first target, save some money and then change your stop-loss order to an entry order.
For inquiries, please leave a comment.
Thank you.
#SUI/USDT Bullish scenario#SUI
The price is moving within a descending channel on the 1-hour frame, adhering well to it, and is heading for a strong breakout and retest.
We have a bearish trend on the RSI indicator that is about to be broken and retested, which supports the upward breakout.
There is a major support area in green at 2.61, representing a strong support point.
We are heading for consolidation above the 100 moving average.
Entry price: 2.81
First target: 2.96
Second target: 3.11
Third target: 3.30
Don't forget a simple matter: capital management.
When you reach the first target, save some money and then change your stop-loss order to an entry order.
For inquiries, please leave a comment.
Thank you.
