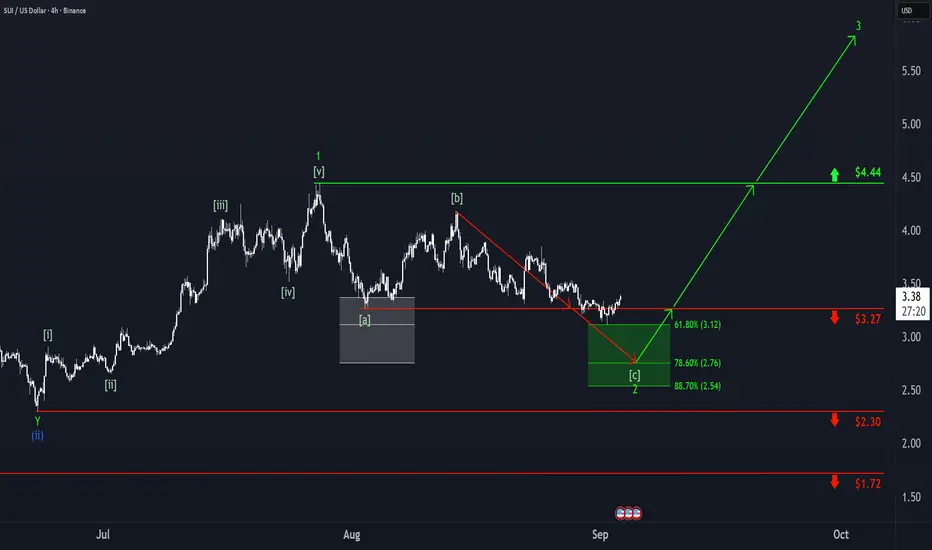
SUI: Dip and Go?On Monday, SUI dipped into our green Target Zone ($3.12 – $2.54) but quickly rebounded and climbed back above the $3.27 level. While it’s possible that wave 2 has already bottomed, we’re still allowing for potential new lows within this range. Once this interim correction wraps up, we expect an impulsive rally as green wave 3 takes shape, which should push well above the $4.44 resistance.
SUIUSD
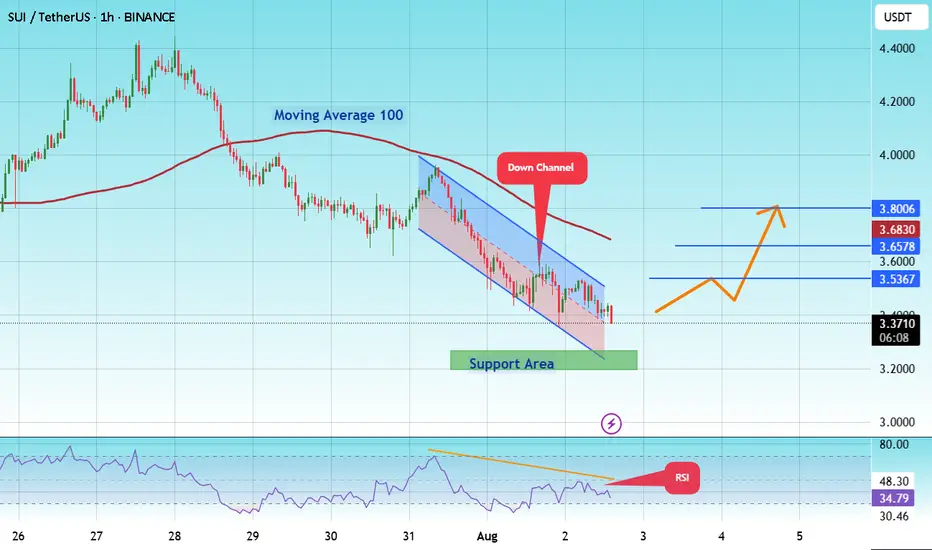
#SUI/USDT → Resistance breakout and entry into the buying zone#SUI
The price is moving within an ascending channel on the 1-hour frame, adhering well to it, and is on its way to breaking strongly upwards and retesting it.
We have support from the lower boundary of the ascending channel, at 3.40.
We have a downtrend on the RSI indicator that is about to break and retest, supporting the upside.
There is a major support area in green at 3.50, which represents a strong basis for the upside.
Don't forget a simple thing: ease and capital.
When you reach the first target, save some money and then change your stop-loss order to an entry order.
For inquiries, please leave a comment.
We have a trend to hold above the 100 Moving Average.
Entry price: 3.51
First target: 3.60
Second target: 3.72
Third target: 3.90
Don't forget a simple thing: ease and capital.
When you reach the first target, save some money and then change your stop-loss order to an entry order.
For inquiries, please leave a comment.
Thank you.

SUI/USDT - Ready to Ride the Wave!🚀 Trade Setup Details:
🕯 #SUI/USDT 🔼 Buy | Long 🔼
⌛️ TimeFrame: 1D
--------------------
🛡 Risk Management (Example):
🛡 Based on $1000 Balance
🛡 Loss-Limit: 1% (Conservative)
🛡 The Signal Margin: $48.26
--------------------
☄️ En1: 3.1925 (Amount: $4.83)
☄️ En2: 2.9529 (Amount: $16.89)
☄️ En3: 2.7933 (Amount: $21.72)
☄️ En4: 2.6424 (Amount: $4.83)
--------------------
☄️ If All Entries Are Activated, Then:
☄️ Average.En: 2.874 ($48.26)
--------------------
☑️ TP1: 3.8572 (+34.21%) (RR:1.65)
☑️ TP2: 4.4436 (+54.61%) (RR:2.64)
☑️ TP3: 5.3193 (+85.08%) (RR:4.11)
☑️ TP4: 6.6869 (+132.67%) (RR:6.4)
☑️ TP5: 8.6086 (+199.53%) (RR:9.63)
☑️ TP6: Open 🔝
--------------------
❌ SL: 2.2786 (-20.72%) (-$10)
--------------------
💯 Maximum.Lev: 3X
⌛️ Trading Type: Swing Trading
‼️ Signal Risk: 🙂 Low-Risk! 🙂
🔎 Technical Analysis Breakdown:
This technical analysis is based on Price Action, Elliott waves, SMC (Smart Money Concepts), and ICT (Inner Circle Trader) concepts. All entry points, Target Points, and Stop Losses are calculated using professional mathematical formulas. As a result, you can have an optimal trade setup based on great risk management.
📊 Sentiment & Market Context:
Market sentiment remains positive as traders eye key entry levels with well-defined risk management in place. With attractive profit targets and controlled stop-loss, this swing trade setup offers an excellent risk-reward profile for both conservative and aggressive traders.
⚠️ Disclaimer:
Trading involves significant risk, and past performance does not guarantee future results. This analysis is for informational purposes only and should not be considered financial advice. Always conduct your research and trade responsibly.
💡 Stay Updated:
Like this technical analysis? Follow me for more in-depth insights, technical setups, and market updates. Let's trade smarter together!

SUI Wave (4) Still Underway?Its unclear weather CRYPTOCAP:SUI wave 4 is complete or still underway as a larger triangle of flat correction, in a ending diagonal wave 4 (defined by wave 4 falling to wave 1 at the 0.5 Fib).
Price terminated 3 waves up at the High Volume Node resistance and is now finding support at the weekly pivot, 0.236 Fibonacci retracement. Further decline brings up the the 0.382 High Volume Node support.
Weekly RSI is at the EQ.
Safe trading

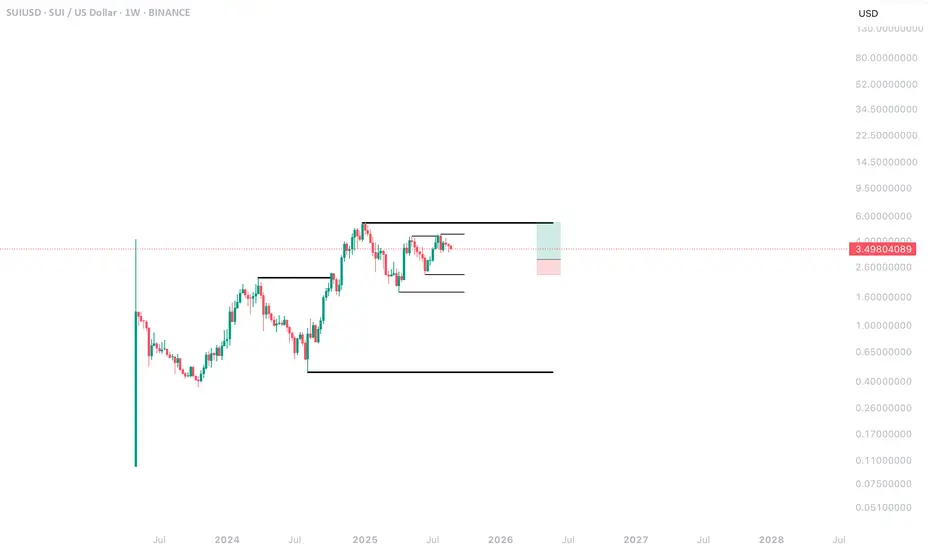
SUI formed the triangle ┆ HolderStatBINANCE:SUIUSDT is shaping a massive triangle formation after a series of consolidations. The structure highlights indecision, but traders should prepare for a potential breakout. An upside move could aim for the $4.20–$4.50 range, while a downside push would likely test the $3.20 support. Watching these levels closely will help identify whether accumulation or distribution is underway.

SUI : Heavy fall or stunning growth!Hello friends
Given the good growth we had, the price has pulled back well and has managed to hold itself well in the specified support area.
Now, given the lack of decline and weakening of sellers, we must wait for the reaction of buyers to see whether they will support the price in the support areas or not?
Given the good conditions of the currency pair, I buy in steps in the support areas and move with it to the specified goals, with capital and risk management.
*Trade safely with us*

SUI Weekly AnalysisBeen following SUI for a while now and bullish formation still intact.
Being patient for the “right” trade.
What does the “right” trade look like?
I’m looking for price to enter or come close to the last higher low in the most recent fractal. You can see me tracing HH & HL within a higher timeframe to verify direction.
To be more specific, I’m looking to enter around the last sell (supply) on the 4HR/1HR. I should see either a BOS or no new lows being made inside my defined range.
An analogy I like to use is I must trade like Jerome Powell cuts rates. I need to first see evidence that the “economy” (price) is changing.
Risk management is rule #1. If it doesn’t fit, be patient. There will always be another opportunity. ALWAYS!!!
SUIUSDT: Price Action AnalysisGiven that we had an accelerated move upwards, so it needs a break and correction. It seems that liquidity has not yet been filled at low prices, so it is expected that the trend will start to decline after reaching the 3.75 point and correct to the 3.4 point and continue its growth again.

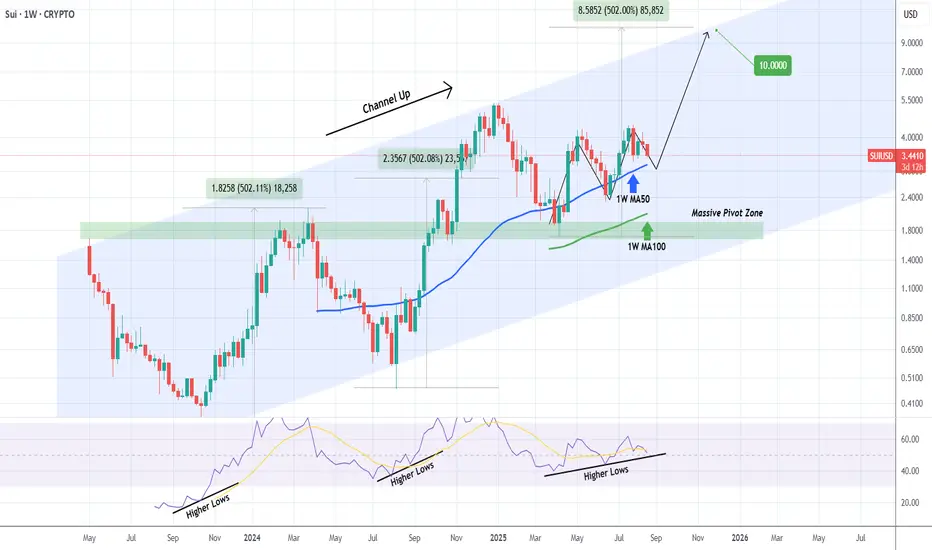
SUIUSD Strong Buy Signal approaching targeting $10.Sui (SUIUSD) has been pulling back lately and is close to its 1W MA50 (blue trend-line).
The long-term pattern is a 2-year Channel Up and since its last Higher High, a break below the 1W MA50 has been the most optimal buy signal technically.
With the 1W RSI already on Higher Lows similar to both previous Channel Up bottoms, we expect the price to start its final strong rally towards the pattern's Top (Higher Highs trend-line) again. Our Target is $10.00.
-------------------------------------------------------------------------------
** Please LIKE 👍, FOLLOW ✅, SHARE 🙌 and COMMENT ✍ if you enjoy this idea! Also share your ideas and charts in the comments section below! This is best way to keep it relevant, support us, keep the content here free and allow the idea to reach as many people as possible. **
-------------------------------------------------------------------------------
💸💸💸💸💸💸
👇 👇 👇 👇 👇 👇
SUI SCALP Long / Buy SetupIt's a scalp setup, don't hold any trade for so long, must use sl and never use more than 2% of your wallet size on SL. Market is risky can take a sharp movement any side, So be careful. Reason for this trade is, it has taken downside SL and didn't close the candle, So we can take the long trade n target early shorters sl. If tp hits first then ignore the trade.

#SUI/USDT#SUI
The price is moving within an ascending channel on the 1-hour frame, adhering well to it, and is on its way to breaking strongly upwards and retesting it.
We have support from the lower boundary of the ascending channel, at 3.76.
We have a downtrend on the RSI indicator that is about to break and retest, supporting the upside.
There is a major support area in green at 3.72, which represents a strong basis for the upside.
Don't forget a simple thing: ease and capital.
When you reach the first target, save some money and then change your stop-loss order to an entry order.
For inquiries, please leave a comment.
We have a trend to hold above the 100 Moving Average.
Entry price: 3.85
First target: 3.93
Second target: 4.08
Third target: 4.42
Don't forget a simple thing: ease and capital.
When you reach the first target, save some money and then change your stop-loss order to an entry order.
For inquiries, please leave a comment.
Thank you.

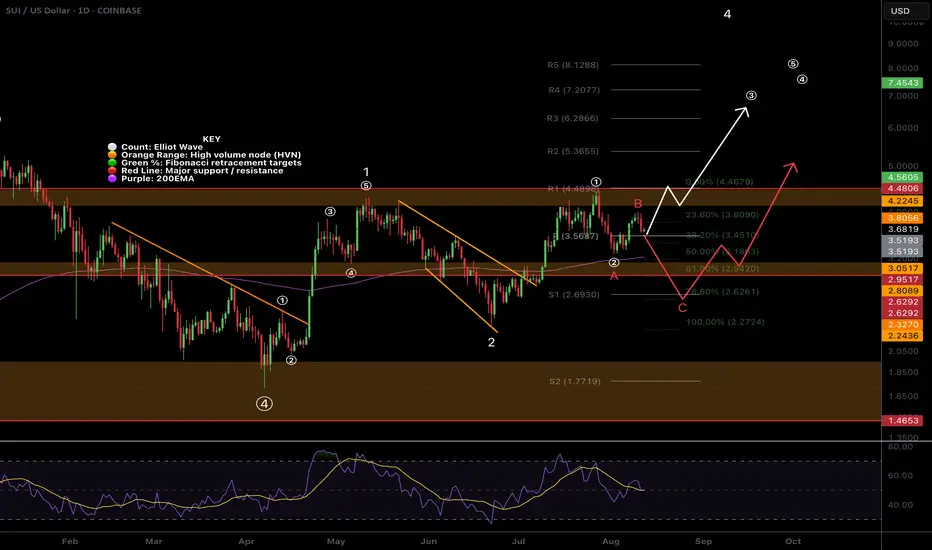
$SUI Short term bearish move coming?CRYPTOCAP:SUI is currently testing the daily pivot as support which must hold to keep the bullish count alive.
I have 2 Elliot Wave counts, short term bullish and bearish that I am patiently waiting to see unfold. Long term is still bullish.
The white count suggests that we have printed a micro wave (1) and are completing a wave (2) now at the daily pivot just above the daily 200EMA where price should move powerfully in a wave (3) of 3 upwards.
Alternatively, the red count, wave B of a larger corrective could also be complete at the recent swing high and losing the pivot and daily 20EMA would confirm this. Wave C has an initial target of the triple support 0.618 Fibonacci retracement, daily 200EMA and major support High Volume Node at $3 to complete wave 2 and a secondary target of the alt-coin golden pocket 0.786 Fibonacci retracement and S1 daily pivot at $2.7
The bearish analysis is my preferred count due to the amount of confluence, including the fact we are entering mid August and this move would also push daily RSI back into oversold.
This would set up new long signals so look out for those in the Substack Trading Signals
Safe trading
SUI/USDTTesting/tracking Elliot wave.
SUI/USDT weekly chart
Sui might be in this super cycle wave. Possible wave 3 top is around $20
Sub cycle wave top is at $8
Pullbacks are on the chart and I’ve tried to place them where I think it’ll happen. While Elliot waves cannot tell you when price targets will hit, I’ve lined them up to market cycles of potential corrections.

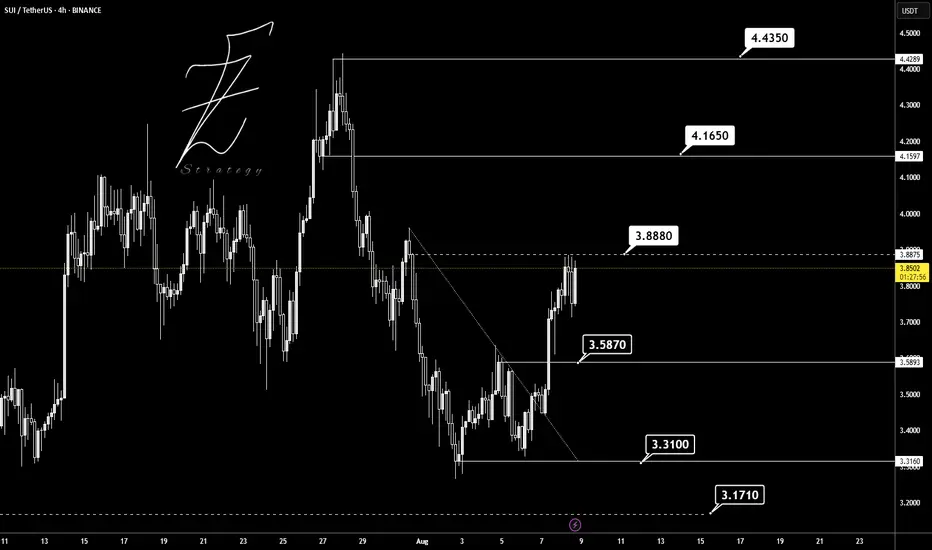
SUIUSDTI think will be bullish BINANCE:SUIUSDT if breaks above 3.88 $ and reach to 4.16 and 4.43 as the next target.
Supports: 3.58 - 3.31 - 3.17
Resistance: 3.88 - 4.16 - 4.43
Please control risk management ⚠️
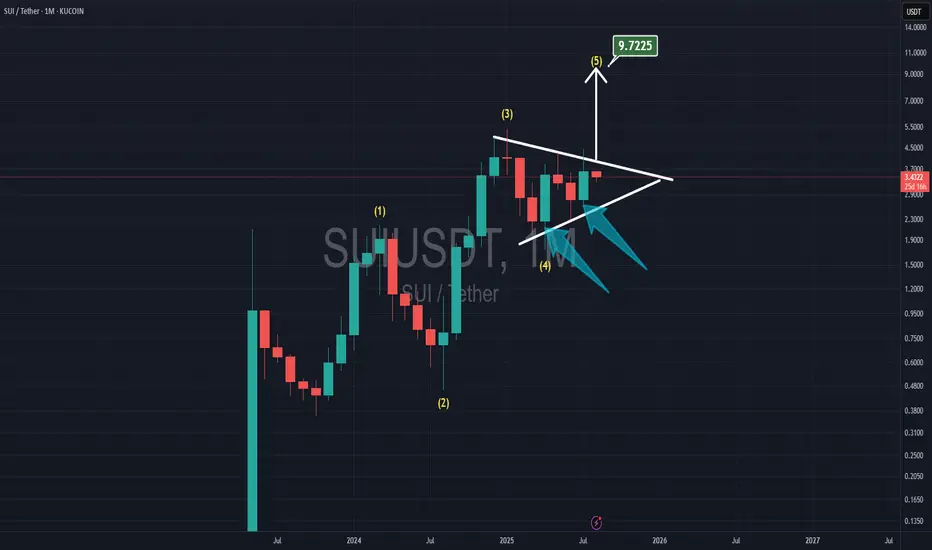
SUI TO $10.00With Elliot waves count, now SUI is in the 5th wave.
It has 2 bullish monthly candles for April & July, and SUI is playing inside the triangle which shows me with the breakthrough the resistance, the target is at $10
Can SUI end the year at over $10?Sounds wild sitting here in August.
But those are the type pf moves possible on a new cycle blockchain entering the last parabolic run of the 4 year cycle.
Now we are still unsure when this cycle will end?
Q4 of 2025 or does extend April/May of 2026.
Either way SUI has potential of compressed price action, waiting for #ETH to break above $4100 is probably going to be the trigger that starts the party.

#SUI/USDT 4H: Broke out of a falling wedge with bullish momentum#SUI/USDT 4H: Broke out of a falling wedge with bullish momentum, now holding an ascending trendline. Watch for a retest around $3.40–$3.20. Holding above this zone targets $4.00 and $4.80. A break below $3.00 invalidates the setup.

SUI | Sui Network - Swing Long Idea - Altcoin
📊 Market Sentiment
Market sentiment remains bullish, supported by expectations of a 0.25% rate cut at the upcoming FOMC meeting. The weakening USD and rising risk appetite across global markets are favoring crypto assets in particular.
📈 Technical Analysis
SUI recently gained bullish momentum, largely following Bitcoin's strength.
We’re now seeing a healthy retracement, which is expected after a strong move.
The break of the LTF bullish trendline suggests potential for a deeper pullback toward HTF confluence zones.
📌 Game Plan
I'm eyeing the HTF demand zone around $3.06, which aligns with the 0.5 Fibonacci retracement—a key discount zone.
Just below this, we also have a higher time frame bullish trendline, which could offer dynamic support.
These overlapping levels provide a strong confluence for a swing long idea.
🎯 Setup Trigger
I’ll wait for a 4H bullish break of structure and the formation of an LTF demand zone before entering.
📋 Trade Management
Stoploss: Below 4H demand swing low
Target: Up to $4.44
I’ll trail my stop to lock in profits aggressively along the way.
💬 Like, follow, and comment if this breakdown supports your trading!
More setups and market insights coming soon — stay connected!

#SUI/USDT Update – Bounce Setup from Demand Zone?#SUI
The price is moving within a descending channel on the 1-hour frame and is expected to break and continue upward.
We have a trend to stabilize above the 100 moving average once again.
We have a downtrend on the RSI indicator that supports the upward break.
We have a support area at the lower boundary of the channel at 3.27, acting as strong support from which the price can rebound.
We have a major support area in green that pushed the price higher at 3.20.
Entry price: 3.38
First target: 3.58
Second target: 3.65
Third target: 3.80
To manage risk, don't forget stop loss and capital management.
When you reach the first target, save some profits and then change the stop order to an entry order.
For inquiries, please comment.
Thank you.
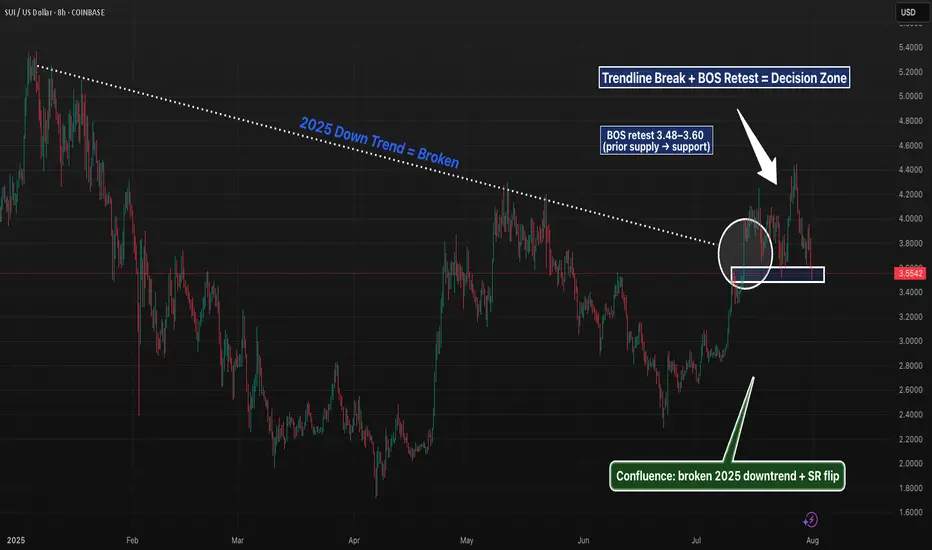
SUI 8H – Trendline Break, BOS Retest, and SR FlipSUI is at a pivotal level after cleanly breaking its 2025 downtrend and flipping prior supply into potential support. The current zone ($3.48–$3.60) marks a textbook BOS retest, aligning with the broken trendline and a clear structure shift.
Price has already printed a higher high, and if this zone holds, it could establish a higher low — a key confirmation for bullish continuation. Momentum traders may watch for reclaim of $3.70 for confluence, while invalidation sits below $3.32.
A break lower opens the door to deeper retracement targets around the 0.618 zone ($3.32–$3.38), but structure remains intact until then. Clean price action, strong confluence, and a clear invalidation level make this an actionable zone to watch.
📊 Structure: BOS → Retest
🧠 Bias: Bullish if $3.48–$3.60 holds
📉 Invalidation: 8H close below $3.32
🔔 Next key levels: $3.90, $4.10, $4.45
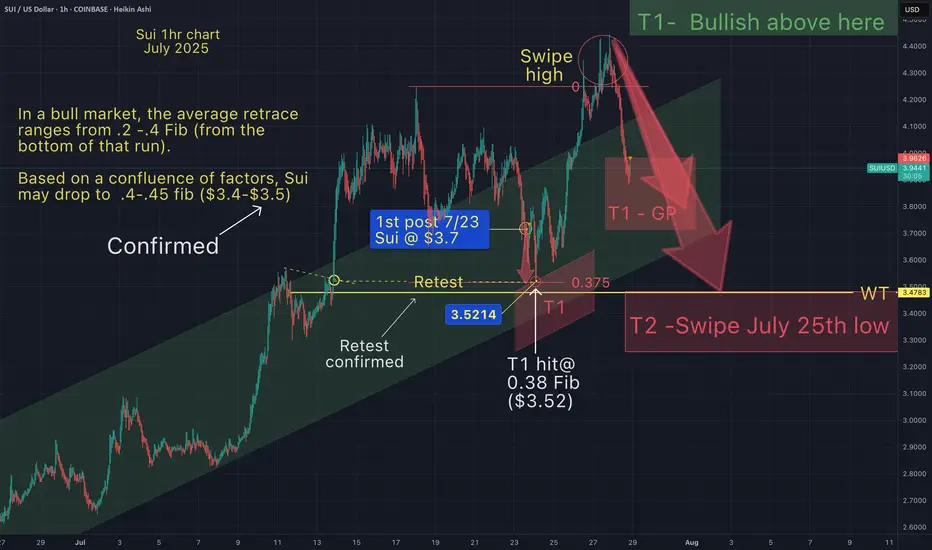
Sui - next target Sui is following Eth as most alts do.
Just an update on July 23rds chart targets (seen from a different lense).

Sui next target (T2)As anticipated Sui would drop somewhere between the .2-.4 Fib (of the entire run).
As shown on the chart, Sui has hit the 3.8 Fib.
This was also expected because of the dotted yellow line indicating a breakout retest.
Also my price prediction on 7/23/25 was between $3.4 - $3.5.
So far Sui has hit my target within less than 1% @ $3.52.
Sui may bounce from here since it is in the golden pocket (red T1).
But I would not be surprised if Sui continues down to hit T2 (swipe recent low),
and liquidate the longs before starting its face melting pump upwards.
SUI new trend started!SUI / USDT
Price broke out after long accumulation range with good volume
Looks like a new bullish trend has started
