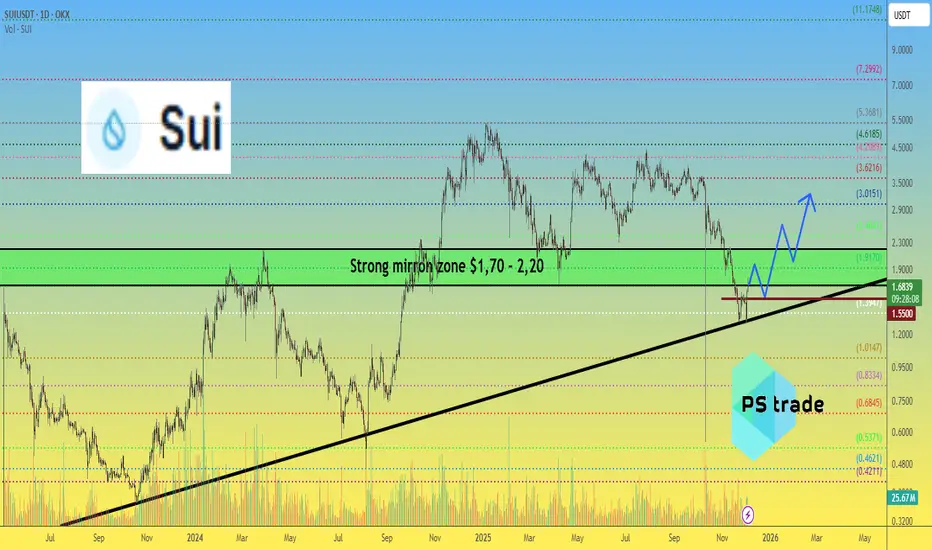
SUI price Update — Double Bottom & Next Targets📉 In November, the price of CRYPTOCAP:SUI was saved twice right at the edge — perfectly on the trendline support, forming a classic double bottom.
📈 Yesterday we finally saw the effect: a strong +30% pump, and the full technical target of this pattern points directly toward $2.
But what comes next is where it gets interesting:
🔹 Buyers must not allow OKX:SUIUSDT to drop below $1.55 — that’s the critical structural level.
🔹 Then CRYPTOCAP:SUI needs to break out and firmly hold above the mirror zone at $1.70–2.20.
🔹 And afterward… it must push through $3, opening the road to much bigger levels.
🎯 Just a few “simple” steps 😄 — and the pathway toward $7, or even $11, becomes fully realistic for #SUI.
🤔 What do YOU think: is CRYPTOCAP:SUI entering its next expansion phase?
______________
◆ Follow us ❤️ for daily crypto insights & updates!
🚀 Don’t miss out on important market moves
🧠 DYOR | This is not financial advice, just thinking out loud
SUIUSDC
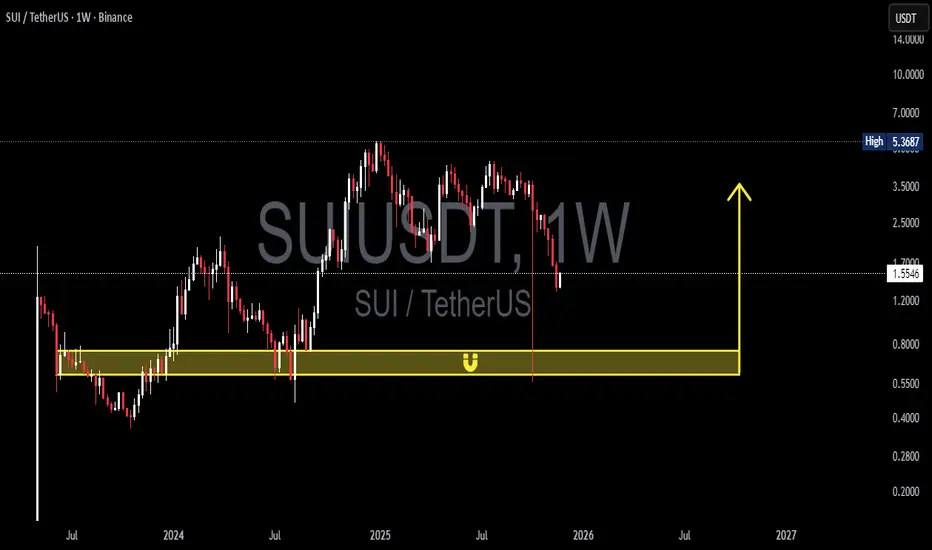
SUI/USDT — Massive Accumulation or Full Capitulation?SUI is standing right at the gateway where its entire macro cycle will be decided.”
The weekly chart reveals something uncommon: a sharp drop, deep liquidity sweep, and precise retest of the historical demand zone at 0.75–0.60 — the exact area that launched SUI’s major rally back in early 2024.
Moves like this usually indicate that smart money is revisiting an old accumulation zone, testing whether institutional demand is still alive or completely gone.
And right now…
SUI is back where its big story originally began.
---
🔥 Why the 0.75–0.60 Demand Zone Matters
Because this is the zone where:
The strongest historical sell-off was completely absorbed.
Large buyers first stepped in.
Institutional volume was concentrated.
And now: the zone where SUI’s macro trend will be determined again.
Price dropped into this zone with a large weekly candle, followed by a deep wick — a signature liquidity grab, meaning retail stop-loss orders have been taken out.
If demand reactivates here, SUI can enter a multi-month reversal phase.
If not… we enter capitulation territory.
---
📈 Bullish Scenario — “The Rebirth Case”
Bullish confirmation appears if:
Weekly forms a reversal candle / bullish engulfing inside the 0.75–0.60 block.
Volume spikes during the bounce.
Price reclaims 1.55, shifting structure from lower-high to neutral-bullish.
Upside targets:
1. 1.20–1.30
2. 2.20–2.50 (major supply zone)
3. 3.50+
4. Retest major high at 5.36 if momentum expands
If this unfolds, SUI could form a rare weekly V-shape accumulation return.
---
📉 Bearish Scenario — “The Breakdown Phase”
Bearish confirmation appears if:
Weekly closes below 0.60
Retest of 0.75–0.60 gets strongly rejected
This would flip the demand zone into new supply, signaling a macro distribution phase.
Downside targets:
0.40 (psychological support)
0.28 (final structural base)
0.20 in a worst-case capitulation wave
A breakdown here marks a confirmed lower-low on the weekly structure — a bearish macro reversal.
---
🎯 Key Patterns Observed
Liquidity Sweep + Rejection Pattern at major demand
Macro Lower-High Formation from the 5.36 peak
Potential Wyckoff Spring
Long wick = “Spring Test”
Market now waiting for confirmation
Liquidity Void in mid-range → large impulsive moves likely once direction is chosen
---
🪙 Core Insight — Short & Simple
SUI is currently in a macro decision zone.
The 0.75–0.60 block is the turning point that will decide whether this becomes:
a major long-term reversal, or
the beginning of a deep multi-month downtrend.
The weekly reaction from this zone will define SUI’s next big trend.
#SUI #SUIUSDT #CryptoTA #WeeklyChart #DemandZone #SmartMoneyConcepts #Wyckoff #LiquiditySweep #CryptoAnalysis #AltcoinOutlook #PriceAction
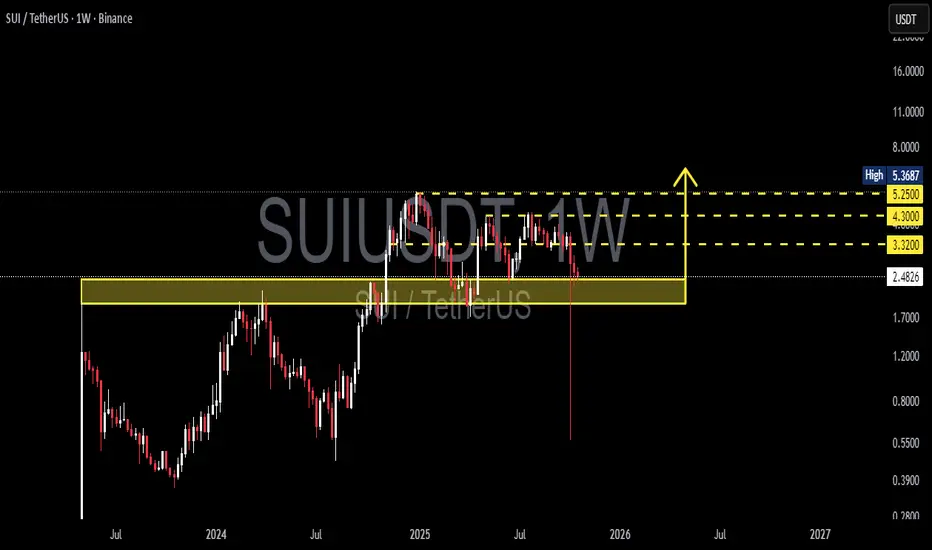
SUI/USDT — Last Defense Before the Next Major Move?SUI is now approaching a critical demand zone between $1.93 – $2.40 — a region that once acted as macro resistance during its early 2024 breakout, and now serves as the final major support on the weekly structure.
After multiple failed attempts to reclaim the mid-range resistance at $3.32 – $4.30, price action has rotated downward into this yellow box — forming what could become either a springboard for a major reversal or a breakdown trigger if support fails.
---
🔹 Technical Overview
The yellow block ($1.93–$2.40) represents a long-term structural pivot — previously resistance, now retested as support.
The wick rejection from lower levels shows early buying interest and liquidity sweep below the zone.
However, momentum remains neutral to bearish until price can reclaim $3.32 on a weekly close.
---
🟢 Bullish Scenario
If SUI successfully holds above $1.93 and forms a strong weekly close above $2.40, buyers could gain control and aim for:
$3.32 → key mid-level resistance
$4.30 → previous consolidation cap
$5.25 – $5.36 → macro breakout target
A reclaim of $3.32 would confirm a potential trend reversal, shifting market structure from distribution to accumulation.
---
🔴 Bearish Scenario
If SUI breaks and closes below $1.93, the structure shifts decisively bearish.
Downside targets open toward $1.20, then $0.80 – $0.55 (prior liquidity base).
Breakdown beneath this zone would signal loss of structural support and likely trigger capitulation-type movement.
---
⚖️ Key Takeaway
SUI is at a macro decision zone — where either a long-term base forms or a deeper correction begins.
A clean weekly close and volume confirmation will define the next 3–6 month direction.
This is not a random level — this is where smart money decides who wins the next phase.
---
📊 Major Levels
Support Zone (yellow box): $1.93 – $2.40
Resistance Levels: $3.32 → $4.30 → $5.25 – $5.36
Trend Confirmation: Weekly close above $3.32 = bullish reversal
---
#SUI #SUIUSDT #Crypto #TechnicalAnalysis #PriceAction #Altcoins #SwingTrading #SupportResistance #CryptoCharts #MarketStructure #SUIAnalysis
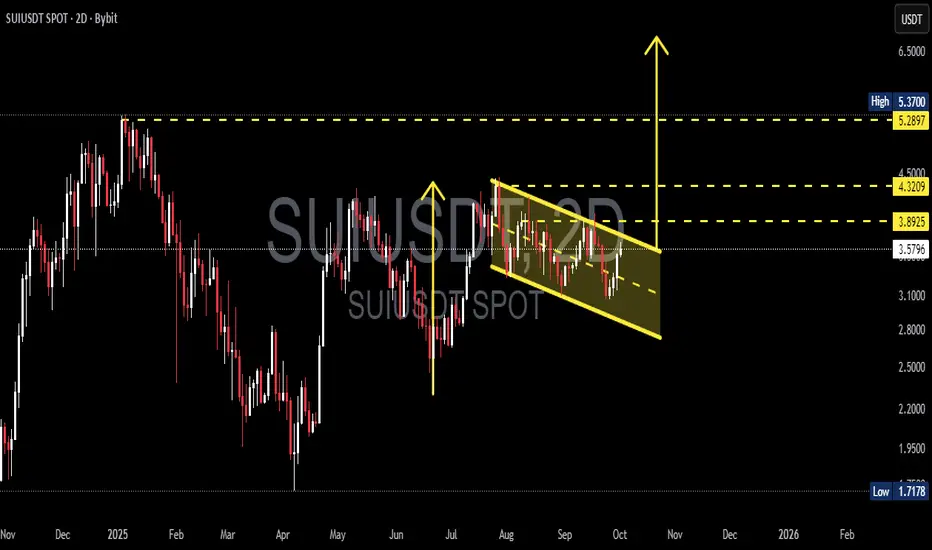
SUI/USDT — Bullish Flag, Consolidation Before the Next Rally?📌 Pattern Overview
SUI is currently forming a Bullish Flag pattern, which consists of:
Flagpole: the strong rally from June–July that pushed the price significantly higher.
Flag: a downward-sloping consolidation channel (descending channel) since August.
This pattern typically indicates a healthy pause after a strong uptrend, often followed by another bullish continuation.
---
🔍 Technical Analysis
Current Price: $3.58.
Upper flag line (resistance): around $3.89–$3.90.
Lower flag line (support): around $2.80.
Key horizontal levels: $3.89 → $4.32 → $5.29/$5.37 (previous high).
---
📈 Bullish Scenario (Valid Flag Breakout)
Confirmation: A breakout above the upper flag line with a strong 2D candle close and rising volume.
Flagpole projection target:
Previous flagpole measured from ~$2.0 → ~$5.3 = ~$3.3 move.
Breakout above ~$3.9 projects a target near $7.0 – $7.2.
Upside targets (step by step):
Target 1: $3.89 (first resistance).
Target 2: $4.32 (mid resistance).
Target 3: $5.29–$5.37 (previous top).
Extended target: $7.0 (flagpole projection).
Stop-loss: Below the breakout point or below the lower flag line (~$2.80).
---
📉 Bearish Scenario (Failed Flag)
Confirmation: Rejection at the upper flag line, or a breakdown below the channel.
Downside targets:
$2.80 (intra-flag support).
$2.20 → $1.72 (major support levels).
Extended target near $1.28 if a full breakdown occurs and the flag invalidates.
---
⚖️ Extra Confirmations
1. Volume: Breakout should be accompanied by a clear volume spike.
2. RSI: A move above 50–60 strengthens the bullish case.
3. MACD: Bullish crossover supports momentum continuation.
---
🎯 Conclusion
SUI is consolidating inside a Bullish Flag, a classic continuation pattern. A confirmed breakout could trigger a move towards $5.37, with an extended upside target near $7.0. Failure to break out, however, would bring price back to supports around $2.80 – $1.72.
Traders should wait for confirmation via candle close and volume before entering, and maintain strict risk management in case of pattern failure.
---
#SUI #SUIUSDT #Crypto #Altcoins #TechnicalAnalysis #BullishFlag #Breakout #PriceAction #CryptoTrading
SUI long IdeaSUI LONG idea
Symmetrical triangle was broken, Market structure broken to bullish.
Breakout-retest and descending wedge will be broken up soon.
SUIUSDT — Test Golden Pocket: Breakout or Breakdown Ahead?🔎 Overview:
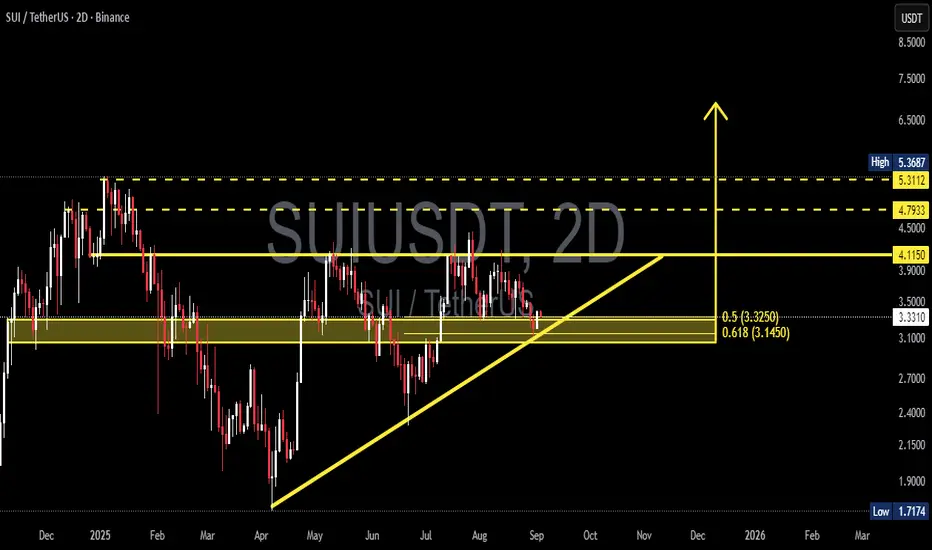
SUI/USDT is currently sitting at a critical decision point. Since April 2025, price action has been forming higher-lows supported by an ascending trendline (yellow). On the upside, we see a flat resistance around 4.115, creating an Ascending Triangle pattern — a classic bullish continuation structure that often precedes a breakout.
However, price is now testing the key demand zone at 3.33–3.15, which perfectly aligns with the Fibonacci golden pocket (0.5 & 0.618 retracement). This zone will likely determine the next major move: either a strong rebound to the upside or a deeper breakdown.
---
📈 Bullish Scenario (Breakout Potential):
Trigger: Price holds above 3.33–3.15 and breaks 4.115 with a strong 2D candle close.
Pattern Implication: A breakout from the ascending triangle usually results in a move equal to the pattern’s height (~0.9–1.1 points), projecting targets around 5.0–5.3.
Targets:
TP1 = 4.79 (intermediate liquidity)
TP2 = 5.31–5.37 (major resistance & previous high)
Extra Signal: A breakout with rising volume would strengthen the bullish outlook significantly.
---
📉 Bearish Scenario (Breakdown Risk):
Trigger: A decisive close below 3.10, which would break both the ascending trendline and the golden pocket.
Consequence: This breakdown could open the door to a deeper retracement.
Targets:
2.70 (minor support)
2.40 (major support)
2.15 (previous demand zone)
Extreme case: 1.72 (historical low)
Invalidation: A recovery above 3.35 followed by a breakout over 4.115 would nullify the bearish setup.
---
📌 Conclusion:
SUI is at a make-or-break level. The 3.33–3.15 zone is the battlefield between bulls and bears, marking the golden pocket of this structure. Holding this level keeps the door open for a bullish breakout towards 5.0–5.3, while losing it could trigger a significant drop toward the 2.70–2.15 range.
📊 Strategy: Wait for a confirmed 2D close before positioning. Manage risk tightly and watch how price reacts at this golden pocket zone — it will set the tone for the next major trend.
---
#SUI #SUIUSDT #CryptoAnalysis #AscendingTriangle #PriceAction #SupplyDemand #GoldenPocket #Fibonacci #CryptoBreakout #SupportResistance #SwingTrading
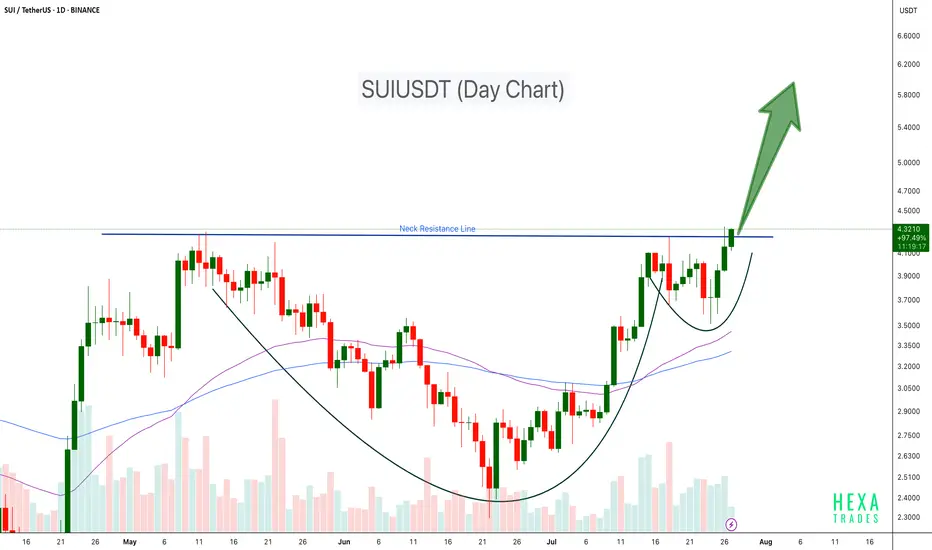
SUIUSDT Cup & Handle Breakout SUI has formed a classic Cup and Handle pattern on the daily chart and has now successfully broken above the neckline resistance around $4.30. This breakout could trigger a strong bullish continuation if volume sustains and retests hold.
Key Points:
Pattern: Cup and Handle
Breakout Level: ~$4.30 (neck resistance)
Potential Upside Target: $5.50 – $6.00+ based on pattern projection
Support Zone: $3.50
Confirmation: Sustained volume and close above neckline
Cheers
Hexa
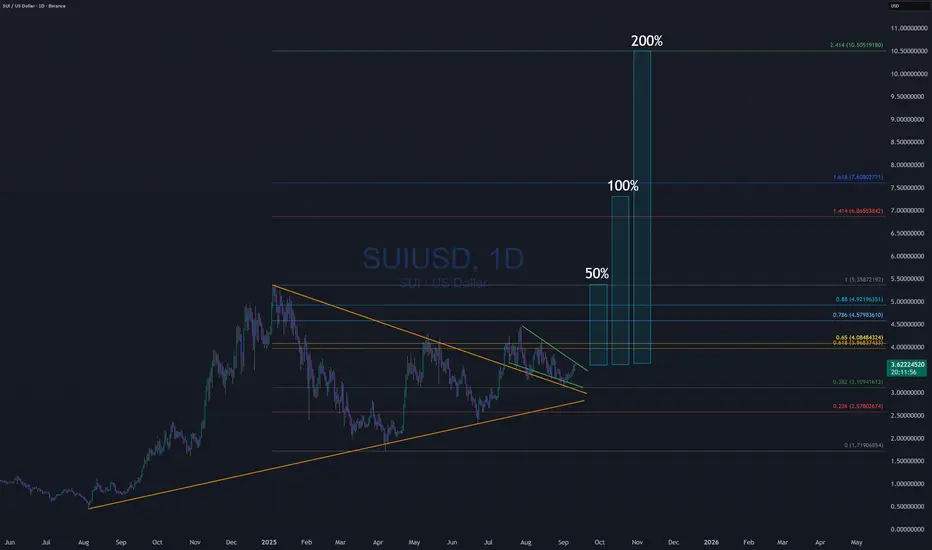
SUIUSDT Breaks Out of Triangle – Eyes on $10BINANCE:SUIUSDT daily chart has confirmed a breakout above a symmetric triangle resistance line within a larger ascending channel, signaling strong bullish momentum. Price has reclaimed the 100 and 200 EMAs, and the breakout is backed by rising volume. This setup opens the door for a potential rally toward the $10.00 level, with price currently holding above key structure support around $4.00. As long as this level holds, continuation toward the upper trendline remains likely. CRYPTOCAP:SUI

$SUI follow up for June 2025CRYPTOCAP:SUI has tapped my support zone around $2.85, which is currently holding well.
That said, the broader trend remains corrective, and it's likely only a matter of time before this support gives way.
If that happens, we could see a drop into my green buy zone — sitting just below a major order block. A break there might trigger heavy liquidations and a sharp move to the next support level.
I don't expect a deeper crash, as bulls are showing strong activity to defend this area.
If you set buy orders around this zone, a solid bounce could offer attractive profits.
As always, DYOR.
This is a follow up for this idea from May 2025

SUI: Watch this bull flag formation! Previously, the price formed a falling wedge pattern and broke out to the upside, resulting in a notable gain of 27%.
Currently, the price is just below a critical resistance level. A break above this level could push the price to at least $0.425.
It’s wise to monitor this setup closely if you want to capitalize on the next upward movement!
The idea is to buy when the price breaks above 0.411$ and take profits at the levels shown in the chart.
Targets:
1. 0.425$
2. 0.45$
3. 0.47$
-------------------------------------------
About our trades:
Our success rate is notably high, with 10 out of 11 posted trade setups achieving at least their first target upon a breakout price breach (The most on TW!). Our TradingView page serves as a testament to this claim, and we invite you to verify it!

SUI has traded back up the the equilibrium zone.As many of us already know, SUI has the ability to make some really big moves very quickly, and it's currently trading at the bottom of the equilibrium zone.
This will be very interesting to watch.
Good luck, and always use a stop-loss!

$SUI WARNING: pump then dumpNYSE:SUI is experiencing a significant pump due to BlackRock's announcement of a specific NYSE:SUI trust fund. However, on August 3rd (and on the 3rd of every month until January 2025), NYSE:SUI will undergo a large token unlock for their Series B and C investors.
The concern is that there was no immediate impact from this token unlock, suggesting that the VCs may be waiting for retail investors to FOMO into NYSE:SUI following the BlackRock announcement before they dump their coins.
Once the FOMO cools down, it's likely that the VCs will sell, which could cause the price to drop.
NYSE:SUI is currently in a downtrend, forming a falling wedge pattern due to the monthly token unlocks that began in July 2024. The upcoming inflation will be difficult for the market to absorb. The token unlocks will slow down in January 2025.
DYOR
