#SUI/USDT – Bullish Triangle Breakout Confirmed | Resistance#SUI
The price is moving within a descending channel on the hourly timeframe. It has reached the lower boundary and is heading towards a breakout, with a retest of the upper boundary expected.
The Relative Strength Index (RSI) is showing a downward trend, approaching the lower boundary, and an upward bounce is anticipated.
There is a key support zone in green at 1.80, and the price has bounced from this level several times. Another bounce is expected.
The RSI is showing a trend towards consolidation above the 100-period moving average, which we are approaching, supporting the upward move.
Entry Price: 1.81
First Target: 1.85
Second Target: 1.90
Third Target: 1.94
Stop Loss: Below the green support zone.
Remember this simple thing: Money management.
For any questions, please leave a comment.
Thank you.
Suiusdsignals

#SUI/USDT Could switch sides soon. Be ready#SUI
The price is moving in a descending channel on the 1-hour timeframe. It has reached the lower boundary and is heading towards a breakout, with a retest of the upper boundary expected.
We are seeing a bearish trend in the Relative Strength Index (RSI), which has reached near the lower boundary, and an upward bounce is expected.
There is a key support zone in green at 1.37, and the price has bounced from this level several times. Another bounce is expected.
We are seeing a trend towards stabilizing above the 100-period moving average, which we are approaching, supporting the upward trend.
Entry Price: 1.40
First Target: 1.431
Second Target: 1.465
Third Target: 1.50
Remember a simple principle: Money Management.
Place your stop-loss order below the green support zone.
For any questions, please leave a comment.
Thank you.

#SUI/USDT Could switch sides soon. Be ready#SUI
The price is moving in a descending channel on the 1-hour timeframe. It has reached the lower boundary and is heading towards breaking above it, with a retest of the upper boundary expected.
We have a downtrend on the RSI indicator, which has reached near the lower boundary, and an upward rebound is expected.
There is a key support zone in green at 1.40. The price has bounced from this zone multiple times and is expected to bounce again.
We have a trend towards consolidation above the 100-period moving average, as we are moving close to it, which supports the upward movement.
Entry price: 1.43
First target: 1.46
Second target: 1.50
Third target: 1.56
Don't forget a simple principle: money management.
Place your stop-loss below the support zone in green.
For any questions, please leave a comment.
Thank you.

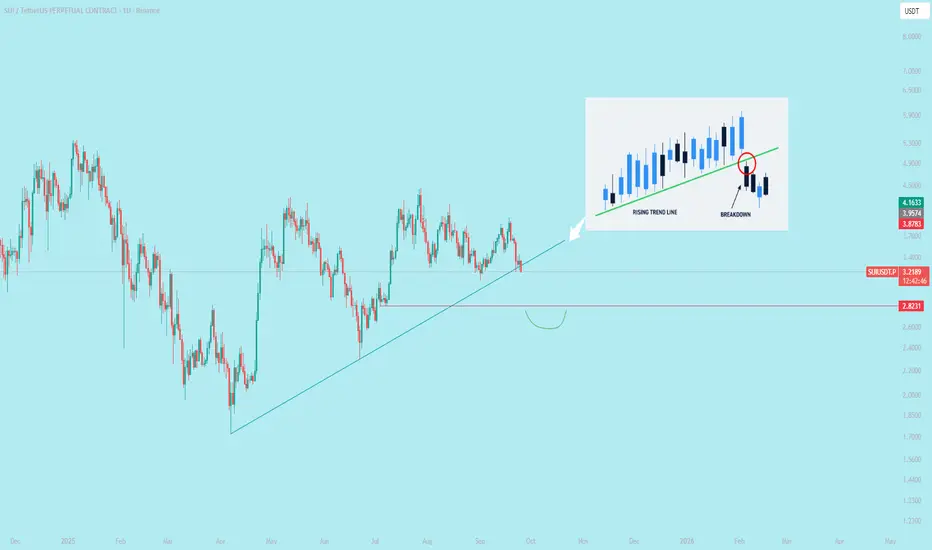
Rising Channel Breakdown → Waiting for Better Buy Prices on SUISUI has been moving inside a well-defined rising channel on the higher timeframe, forming higher highs and higher lows. However, price is now trading near the lower boundary of the channel , showing signs of weak momentum and potential breakdown.
Historically, a loss of the rising channel support often leads to a deeper corrective move, especially after an extended uptrend. Current structure suggests that downside continuation is more likely before any sustainable bullish scenario.
📌 Key points:
Long-term ascending channel
Price approaching / losing channel support
Increased risk of trend exhaustion and correction
🎯 Downside targets:
Target 1: $0.60
Target 2: $0.25
🛑 Conclusion:
At current levels, buying SUI is not attractive from a risk-reward perspective. A better strategy is to wait for deeper pullbacks and signs of stabilization near the mentioned targets before considering long positions.
This is a patience trade — better prices are likely ahead.

SUI/USDT : LIMITHello friends
As you can see, after the resistance level we set was broken, the price has grown well, and now with this bullish trend, there is a sign of sellers entering, and there is a possibility of price correction, and the price can grow again from these areas and move to our targets.
This analysis is technically reviewed and is not a buy or sell recommendation, so please follow risk and capital management.
*Trade safely with us*

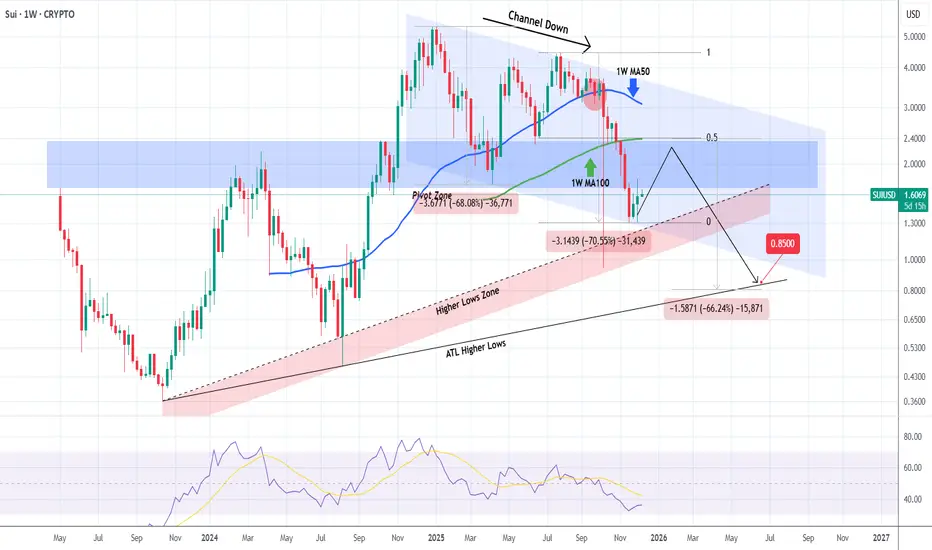
SUIUSD can target $0.85 after this dead-cat bounce is over.A month ago (November 05, see chart below) we gave a strong sell signal on Sui (SUIUSD), targeting 1.4320 right at the bottom of its 1-year Channel Down:
The price made direct contact with the pattern's bottom (thus hitting our Target) and rebounded, pricing a Lower Low. Right now the market is in the process of forming the Bullish Leg of the Channel Up (1W RSI almost got oversold also), which we don't expect to be completed like the previous one as this is a dead-cat bounce at the time, limited by the 1W MA50 (blue trend-line), which is technically the Resistance during Bear Cycles.
The 0.5 Fibonacci retracement level is also at a cluster level were the 1W MA50 could reject this bounce along with the 1W MA100 (green trend-line). We believe that the next Bearish Leg will likely break below the Channel Down and target the All Time Low Higher Lows trend-line around 0.8500, which will be a -66.00% decline from the top, similar to the previous two selling sequences.
---
** Please LIKE 👍, FOLLOW ✅, SHARE 🙌 and COMMENT ✍ if you enjoy this idea! Also share your ideas and charts in the comments section below! This is best way to keep it relevant, support us, keep the content here free and allow the idea to reach as many people as possible. **
---
💸💸💸💸💸💸
👇 👇 👇 👇 👇 👇
#SUI/USDT Could switch sides soon. Be ready#SUI
The price is moving in a descending channel on the 1-hour timeframe. It has reached the lower boundary and is heading towards breaking above it, with a retest of the upper boundary expected.
We have a downtrend on the RSI indicator, which has reached near the lower boundary, and an upward rebound is expected.
There is a key support zone in green at 1.33. The price has bounced from this zone multiple times and is expected to bounce again.
We have a trend towards consolidation above the 100-period moving average, as we are moving close to it, which supports the upward movement.
Entry price: 1.35
First target: 1.38
Second target: 1.42
Third target: 1.46
Don't forget a simple principle: money management.
Place your stop-loss below the support zone in green.
For any questions, please leave a comment.
Thank you.

SUI/USDT : SELL LIMIT
Hello friends
you can see that the price is moving in a range with a slight upward slope, and every time it hits the specified support, the power of buyers decreases, and now, in the last hit that we have identified, it seems that the price will not be able to record a higher ceiling and we will witness a price drop.
This analysis is purely technically reviewed and is not a buy or sell recommendation, so do not act emotionally and observe capital management.
*Trade safely with us*

SUI — This Chart Still Wants HigherAlright, guys.
SUI is holding its bullish structure perfectly. The chart looks like it’s loading energy for the next move, and the momentum is still on the bulls’ side.
Here are my levels:
🎯 Target 1: 1.66
🎯 Target 2: 1.78
🎯 Target 3: 1.92
❌Invalidation:
Close below 1.54 → idea cancelled, bears take control.
🤑Risk/Reward:
• To T1: ~3R
• To T2: ~6.5R
• To T3: ~10R+
The setup speaks for itself — small risk, big potential.
⚠️Not financial advice, trade at your own risk, manage your leverage.
As long as price stays above the cancel zone, I’m looking up. Let’s see how far SUI decides to run.

SUI/USDT:LIVE TRADEHello friends
First of all, I must say that risk and capital management should be observed and any decision-making is your responsibility.
Given the decline we had, we now see that buyers have entered and are one by one setting higher ceilings and floors, which will cause the price to rise to the specified targets if the specified resistance is broken.
*Trade safely with us*

$SUI Trendline breakdownA trendline breakdown occurs when the price of an asset falls below a trendline, signaling a potential reversal or shift in market momentum. Here’s how it works, explained concisely:
1. **Trendline Definition**: A trendline is a diagonal line drawn on a price chart connecting higher lows in an uptrend or lower highs in a downtrend, indicating support or resistance levels.
2. **Breakdown Process**:
- In an **uptrend**, a trendline connects higher lows, acting as support.
- A breakdown happens when the price closes below this trendline, suggesting buyers are losing control and sellers are gaining momentum.
- The break often indicates the end of the uptrend, potentially leading to a price decline or consolidation.
3. **Confirmation**:
- A single candle closing below the trendline may not confirm a breakdown.
- Traders often wait for additional signals, like a strong bearish candle, increased selling volume, or a retest of the trendline (where price fails to reclaim it).
4. **Key Factors**:
- **Volume**: Higher volume on the breakdown strengthens its validity.
- **Timeframe**: Breakdowns on longer timeframes (e.g., daily or weekly) are more significant than on shorter ones (e.g., hourly).
- **Retest**: Price may return to test the broken trendline as resistance before continuing downward.
5. **Implications**:
- A breakdown can signal a trend reversal (from bullish to bearish) or a temporary pullback.
- Traders may use it to enter short positions, set stop-losses above the trendline, or exit long positions.
6. **False Breakdowns**:
- Sometimes, price briefly dips below the trendline but quickly recovers, known as a "fake out."
- To avoid this, traders use additional indicators like moving averages, RSI, or support levels for confirmation.
**Note**: Always combine trendline analysis with other technical indicators and risk management, as breakdowns are not foolproof signals. Market conditions and news can also impact outcomes.
#SUI/USDT The Interesting part of the market#SUI
The price is moving in a descending channel on the 1-hour timeframe and is expected to break out and continue upwards.
We have a trend to stabilize above the 100-period moving average again.
We have a downtrend on the RSI indicator, which supports an upward move if it breaks above it.
We have a key support zone in green that pushed the price up to 1.93.
Entry price: 1.96
First target: 1.97
Second target: 2.02
Third target: 2.04
For risk management, don't forget your stop-loss and capital management.
The stop-loss is below the support zone in green.
Upon reaching the first target, take some profit and then change your stop-loss order to an entry order.
For any questions, please comment.
Thank you.

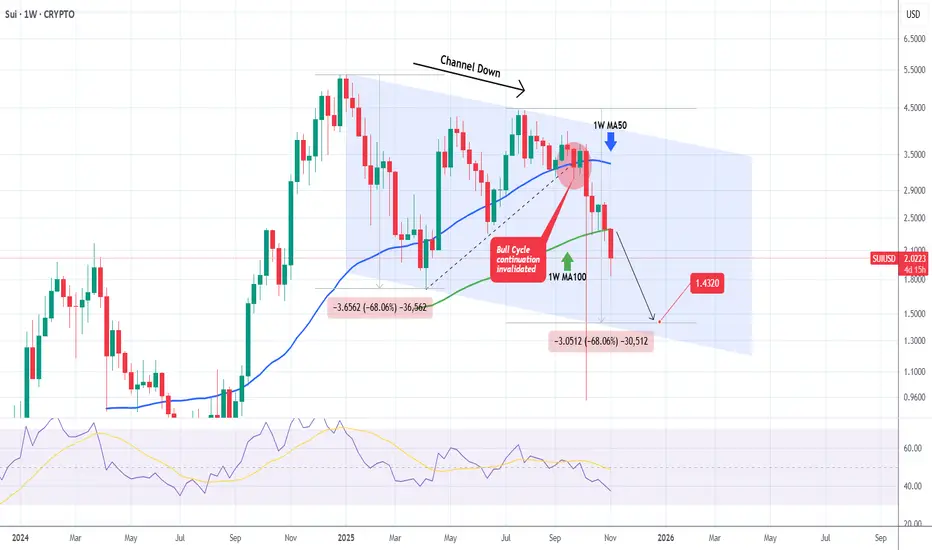
SUIUSD Channel Down to accelerate more selling towards 1.4320.Sui (SUIUSD) has established a Channel Down on the 1W time-frame, trading under Lower Highs since the December 30 2024 High. The Bull Cycle got invalidated on September 22 2025 when the price broke below the inner Higher Lows trend-line (dashed) and this week may confirm the new Bear Cycle as it will most likely close a 1W candle below the 1W MA100 (green trend-line).
We expect the current decline to repeat at least the -68.06% drop of the first Bearish Leg of the pattern and targe 1.4320.
-------------------------------------------------------------------------------
** Please LIKE 👍, FOLLOW ✅, SHARE 🙌 and COMMENT ✍ if you enjoy this idea! Also share your ideas and charts in the comments section below! This is best way to keep it relevant, support us, keep the content here free and allow the idea to reach as many people as possible. **
-------------------------------------------------------------------------------
💸💸💸💸💸💸
👇 👇 👇 👇 👇 👇
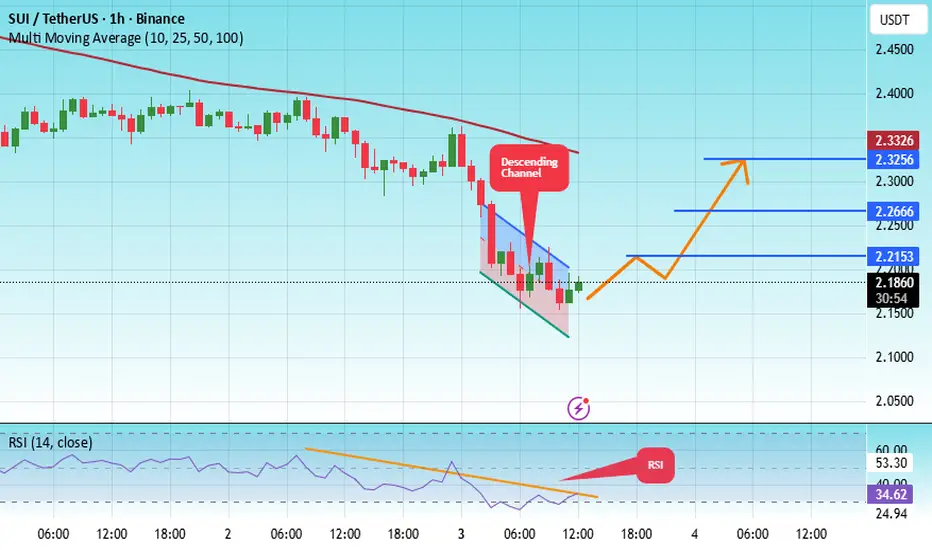
#SUI/USDT The Interesting part of the market#SUI
The price is moving within an ascending channel on the 1-hour timeframe and is adhering to it well. It is poised to break out strongly and retest the channel.
We have a downtrend line on the RSI indicator that is about to break and retest, which supports the upward move.
There is a key support zone in green at the price of 2.14, representing a strong support point.
We have a trend of consolidation above the 100-period moving average.
Entry price: 2.18
First target: 2.215
Second target: 2.26
Third target: 2.32
Don't forget a simple money management rule:
Place your stop-loss order below the support zone in green.
Once the first target is reached, save some money and then change your stop-loss order to an entry order.
For any questions, please leave a comment.
Thank you.
#SUI/USDT - Head and Shoulders Long#SUI
The price is moving within a descending channel on the 1-hour frame, adhering well to it, and is heading for a strong breakout and retest.
We have a bearish trend on the RSI indicator that is about to be broken and retested, which supports the upward breakout.
There is a major support area in green at 2.38, representing a strong support point.
We are heading for consolidation above the 100 moving average.
Entry price: 2.40
First target: 2.48
Second target: 2.54
Third target: 2.63
Don't forget a simple matter: capital management.
When you reach the first target, save some money and then change your stop-loss order to an entry order.
For inquiries, please leave a comment.
Thank you.

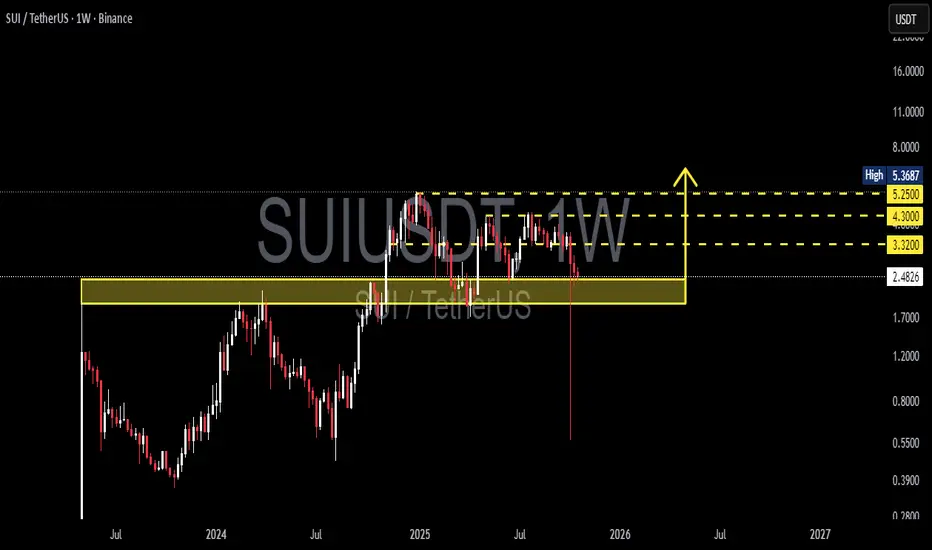
SUI/USDT — Last Defense Before the Next Major Move?SUI is now approaching a critical demand zone between $1.93 – $2.40 — a region that once acted as macro resistance during its early 2024 breakout, and now serves as the final major support on the weekly structure.
After multiple failed attempts to reclaim the mid-range resistance at $3.32 – $4.30, price action has rotated downward into this yellow box — forming what could become either a springboard for a major reversal or a breakdown trigger if support fails.
---
🔹 Technical Overview
The yellow block ($1.93–$2.40) represents a long-term structural pivot — previously resistance, now retested as support.
The wick rejection from lower levels shows early buying interest and liquidity sweep below the zone.
However, momentum remains neutral to bearish until price can reclaim $3.32 on a weekly close.
---
🟢 Bullish Scenario
If SUI successfully holds above $1.93 and forms a strong weekly close above $2.40, buyers could gain control and aim for:
$3.32 → key mid-level resistance
$4.30 → previous consolidation cap
$5.25 – $5.36 → macro breakout target
A reclaim of $3.32 would confirm a potential trend reversal, shifting market structure from distribution to accumulation.
---
🔴 Bearish Scenario
If SUI breaks and closes below $1.93, the structure shifts decisively bearish.
Downside targets open toward $1.20, then $0.80 – $0.55 (prior liquidity base).
Breakdown beneath this zone would signal loss of structural support and likely trigger capitulation-type movement.
---
⚖️ Key Takeaway
SUI is at a macro decision zone — where either a long-term base forms or a deeper correction begins.
A clean weekly close and volume confirmation will define the next 3–6 month direction.
This is not a random level — this is where smart money decides who wins the next phase.
---
📊 Major Levels
Support Zone (yellow box): $1.93 – $2.40
Resistance Levels: $3.32 → $4.30 → $5.25 – $5.36
Trend Confirmation: Weekly close above $3.32 = bullish reversal
---
#SUI #SUIUSDT #Crypto #TechnicalAnalysis #PriceAction #Altcoins #SwingTrading #SupportResistance #CryptoCharts #MarketStructure #SUIAnalysis
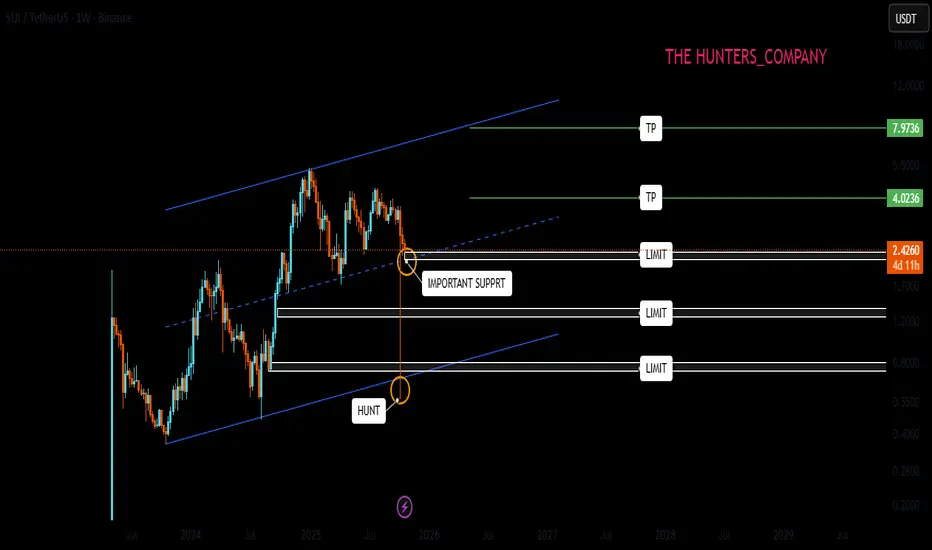
SUI ; The future of SUIHello friends
You see a long-term weekly channel that after setting a new ceiling in the weekly, the price corrected until the bottom of the channel even came below the channel, which many thought was destroyed, but the price returned and is now in an important range.
This weekly candle that guided you to the bottom of the channel is very important. There are many orders in the shadow of this candle and it is possible that the price will correct up to 50% of the shadow of the candle.
For this reason, the best way to buy is to manage risk and capital, and buy in steps in the specified areas and move with it to the set goals.
*Trade safely with us*
#SUI/USDT Bullish scenario#SUI
The price is moving within a descending channel on the 1-hour frame, adhering well to it, and is heading for a strong breakout and retest.
We have a bearish trend on the RSI indicator that is about to be broken and retested, which supports the upward breakout.
There is a major support area in green at 2.61, representing a strong support point.
We are heading for consolidation above the 100 moving average.
Entry price: 2.81
First target: 2.96
Second target: 3.11
Third target: 3.30
Don't forget a simple matter: capital management.
When you reach the first target, save some money and then change your stop-loss order to an entry order.
For inquiries, please leave a comment.
Thank you.

SUI/USDT; BUYERS INHello friends
Given that the price has reached the specified support and the price is supported by buyers and the specified resistance has been broken, we can buy in steps with risk and capital management and move towards the specified goals.
*Trade safely with us*

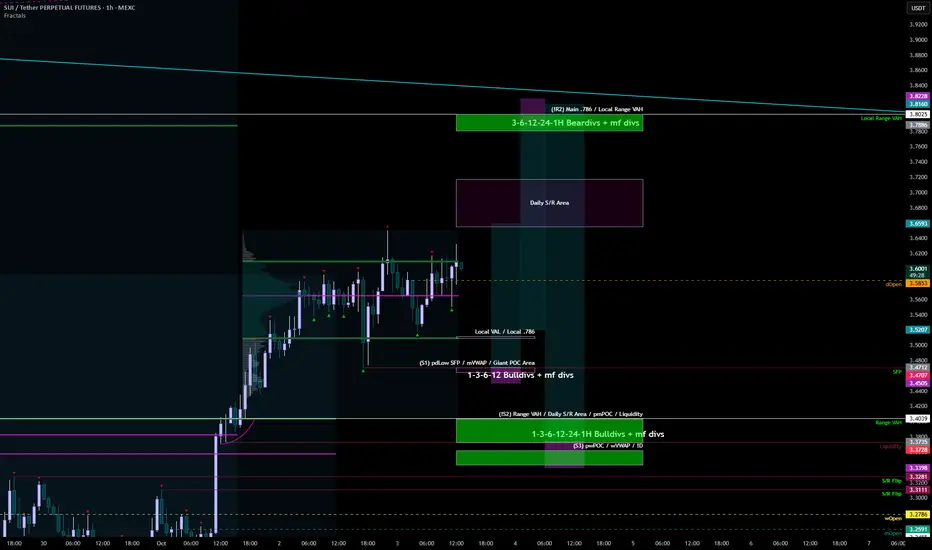
SUI 03.10R1 reacted yesterday at 10 PM, without any bearish divergences, even on LTF. We're moving in a strictly bullish direction, with the closest strong resistance already at 3.8. Locally, in theory, we could drop to S2, which we wouldn't want to lose for further growth.
Support zones:
3.465-3.47
3.403-3.372
3.343-3.362
Resistance zones:
3.78-3.8
4.05-4.1
#SUI/USDT mid-term I believe this one will pump#SUI
The price is moving within a descending channel on the 1-hour frame, adhering well to it, and is heading for a strong breakout and retest.
We have a bearish trend on the RSI indicator that is about to be broken and retested, which supports the upward breakout.
There is a major support area in green at 3.27, representing a strong support point.
We are heading for consolidation above the 100 moving average.
Entry price: 3.30
First target: 3.38
Second target: 3.46
Third target: 3.56
Don't forget a simple matter: capital management.
When you reach the first target, save some money and then change your stop-loss order to an entry order.
For inquiries, please leave a comment.
Thank you.

SUI/USDTBINANCE:SUIUSDT has dropped right to the intersection of its ascending support and horizontal support zone.
This is a key demand area where buyers could step in and take control.
As long as SUI stays above $3.11, there’s no major concern yet.
I’ll update if needed.

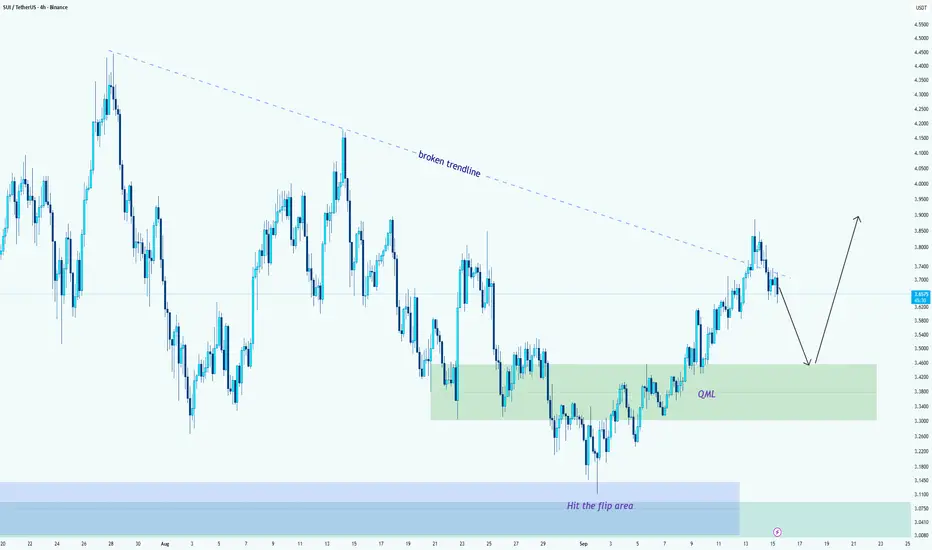
SUI/USDT --> Two-Step Setup: Retest QML, Then RallyHello guys!
Short version first: I expect a pullback to the QML (3.30–3.45), then a bounce that resumes the upside toward 3.80–3.90 (and potentially higher if momentum continues).
Why this makes sense (the plan):
Step 1 --> Pullback to QML:
Price broke the long descending trendline and impulsed higher, but the move is showing a normal two-leg structure: first leg up, now a corrective leg down. The green QML box (3.30–3.45) is the nearby demand zone and the most logical place for buyers to re-enter.
Step 2 --> Bounce & continuation:
If the QML holds and we get a bullish rejection (pinbar, engulfing, clear wick rejection, or a nice bullish close), the most likely path is a continuation back toward the recent supply area — 3.80– 3.90 as the first meaningful resistance. If momentum keeps, extensions toward the next structural highs become possible.
Final note
This is a two-step game: first, the retest, then the real trade. Don’t chase the breakout now; patience at the QML will give a cleaner, higher-reward setup.