SUIUSDT: Targeting Previous Higher High Point $5Dear Traders,
🔺We are currently analysing SUIUSDT. Over a three-day timeframe, the price has completed a solid accumulation phase. Confirmation in smaller time frames indicates a likely reversal, and a strong bullish volume would accelerate the price action for further confirmation.
🔺Our swing target is $5, a previous higher high, but for the price to work in our favour, strong fundamentals are required. Entry can be made at the current trading price with a stop loss placed below the previous lower low.
Team SetupsFX_
Suiusdt

SUI M30 FVG Rejection and Continuation Setup📝 Description
On the M30 timeframe, CRYPTOCAP:SUI is pressing into a clear H1 supply / Order Block while still trading under a descending structure. The current pause under the zone looks like a controlled reaction rather than acceptance, keeping the probability of a downside continuation toward lower inefficiencies active.
________________________________________
📈 Signal / Analysis
Primary Bias: Bearish while below the 1.82 area
Preferred Setup:
• Entry: 1.8 (30m FVG rejection)
• Stop Loss: Above 1.815
• TP1: 1.784
• TP2: 1.764
• TP3: 1.745
________________________________________
🎯 ICT & SMC Notes
• Reaction inside an unmitigated H1 Order Block / supply
• Downside targets align with M30 inefficiency (FVG) and liquidity draws
• No bullish CHOCH/BOS confirmed to justify a reversal narrative
________________________________________
🧩 Summary
CRYPTOCAP:SUI is reacting at a higher-timeframe supply zone, and as long as price stays capped below the H1 OB, the move is treated as a pullback. Rejection from this area keeps TP1–TP3 in play, with 1.745 as the deeper draw.
________________________________________
🌍 Fundamental Notes / Sentiment
Stronger USD supports tighter financial conditions, reducing risk appetite. In this environment, risk assets like crypto remain vulnerable, keeping SUI biased to the downside.
________________________________________
⚠️ Risk Disclosure
Trading involves substantial risk and may result in capital loss. This analysis is for educational purposes only and does not constitute financial advice. Always apply proper risk management, predefined stop-loss levels, and disciplined position sizing aligned with your trading plan.

#SUI/USDT RSI Exhaustion and Bearish Pullback Setup#SUI
The price is moving in an ascending channel on the 1-hour timeframe. It has reached the upper limit and is heading towards breaking it. A retest of the upper limit is expected.
We have an upward trend on the RSI indicator, which has reached near the upper limit. A downward reversal is expected.
There is a key support zone in green at the 2.00 price level. The price has bounced from this level multiple times and is expected to bounce from it again.
We have a trend of consolidation above the 100-period moving average, as we are moving close to it. This supports a downward move towards touching this level.
Entry price: 1.96
First target: 1.95
Second target: 1.90
Third target: 1.84
Stop loss: Above the resistance zone in green.
Don't forget a simple thing: money management.
For inquiries, please leave a comment.
Thank you.

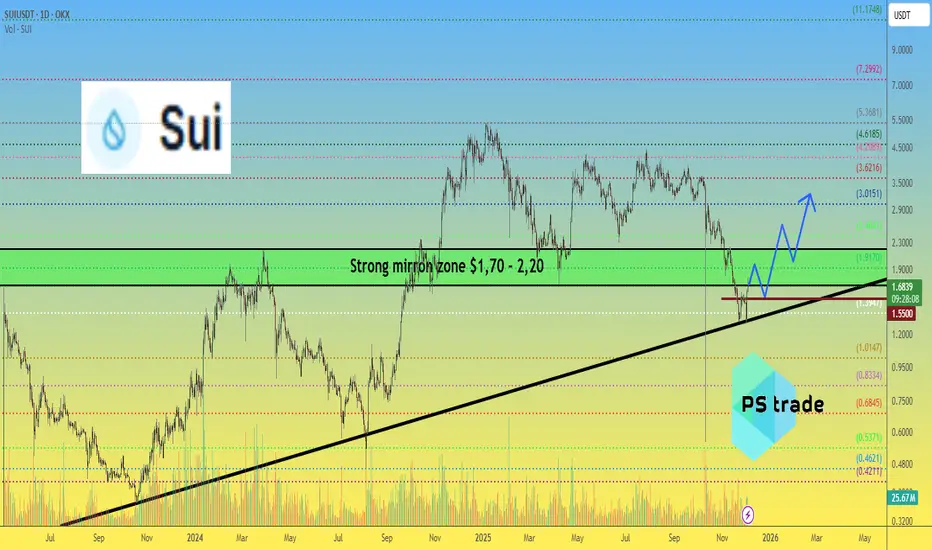
SUI price Update — Double Bottom & Next Targets📉 In November, the price of CRYPTOCAP:SUI was saved twice right at the edge — perfectly on the trendline support, forming a classic double bottom.
📈 Yesterday we finally saw the effect: a strong +30% pump, and the full technical target of this pattern points directly toward $2.
But what comes next is where it gets interesting:
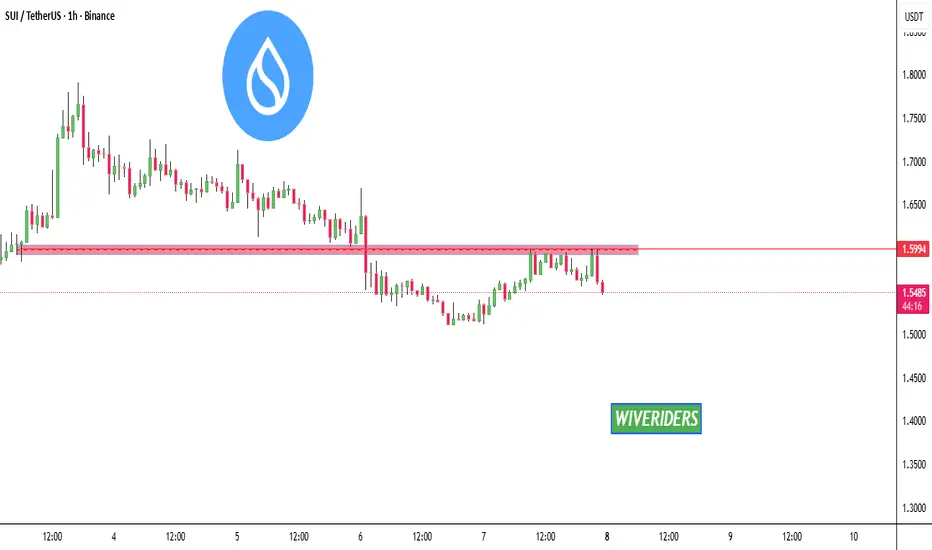
🔹 Buyers must not allow OKX:SUIUSDT to drop below $1.55 — that’s the critical structural level.
🔹 Then CRYPTOCAP:SUI needs to break out and firmly hold above the mirror zone at $1.70–2.20.
🔹 And afterward… it must push through $3, opening the road to much bigger levels.
🎯 Just a few “simple” steps 😄 — and the pathway toward $7, or even $11, becomes fully realistic for #SUI.
🤔 What do YOU think: is CRYPTOCAP:SUI entering its next expansion phase?
______________
◆ Follow us ❤️ for daily crypto insights & updates!
🚀 Don’t miss out on important market moves
🧠 DYOR | This is not financial advice, just thinking out loud
SUI Pullback Setup – Eyeing the Next Leg UpSUI has rallied impressively from the ~$1.40 area into strong resistance at $2.00. This move confirms bullish strength, but we’re now seeing signs of exhaustion near this resistance zone. A short-term pullback is expected, which could offer a better entry point for the next leg higher.
📍 Entry Zone: Watching for a dip toward $1.65, which aligns with potential support from previous structure and could act as a launchpad for buyers to re-enter.
🎯 Targets:
• TP1: $2.20 – $2.50
• TP2: $3.00 – $3.30
❌ Stop-Loss: Just below $1.50, to protect against a deeper correction or invalidation of the bullish setup.

SUI Daily OTE Rejection - Pin Bar Signal Toward SSL and FVGs📝 Description
SUI on Daily timeframe is trading inside a bearish HTF structure and has now retraced into the 0.618–0.786 OTE zone, where a clear FVG is present. Price reaction in this area suggests weakening upside momentum rather than acceptance above value.
________________________________________
📈 Analysis (Scenario-Based | Non-Signal)
If the latest daily candle closes as a pin bar within the 0.618–0.786 zone and inside the FVG, downside probability increases. This behavior would signal rejection from premium, favoring a bearish rotation toward lower liquidity.
Downside Expectation:
• Draw toward lower FVGs (1.780 and 1.535)
• Targeting Sell-Side Liquidity (SSL) below recent lows
• Move classified as liquidity-driven continuation, not a trend change
________________________________________
🎯 ICT & SMC Notes
• Confluence of OTE (0.618–0.786) with reversal FVG
• Pin bar close = premium rejection
• Bias shifts toward SSL draw
________________________________________
🧩 Summary
A pin bar close on D within the 0.618–0.786 OTE and reversal FVG strengthens the case for a bearish continuation. Under this condition, price is likely to rotate lower toward FVG inefficiencies and SSL, aligning with the dominant HTF bearish framework.
________________________________________
🌍 Fundamental Notes / Sentiment
SUI remains risk-sensitive. Any return of risk-off or USD strength can speed up the SSL draw after rejection from the 0.618–0.786 OTE. In a risk-on environment, downside may stay corrective, D close confirmation remains key.
________________________________________
⚠️ Risk Disclosure
Trading involves substantial risk and may result in capital loss. This analysis is for educational purposes only and does not constitute financial advice. Always apply proper risk management, predefined stop-loss levels, and disciplined position sizing aligned with your trading plan.

#SUI/USDT – Bullish Triangle Breakout Confirmed | Resistance #SUI
The price is moving in a descending channel on the 1-hour timeframe and is expected to break out and continue upwards.
We have a trend to stabilize above the 100-period moving average again.
We have a downtrend on the RSI indicator, which supports an upward move if it breaks above it.
We have a key support zone in green that pushed the price higher at 1.75.
Entry price: 1.77
First target: 1.80
Second target: 1.84
Third target: 1.88
For risk management, don't forget your stop-loss and capital management.
The stop-loss is below the support zone in green.
Upon reaching the first target, take some profit and then change your stop-loss order to an entry order.
For any questions, please comment.
Thank you.

SUI is on the verge of another rally (4H)From the point where we marked the green arrow on the chart, a bullish phase has started on SUI. This area acted as a key reaction zone where buyers stepped in decisively, shifting market sentiment from corrective to bullish.
Based on the current price structure, it appears that we are developing an ABC corrective pattern. In this structure, Wave B has formed as a triangle, which is a common consolidation pattern before continuation. The triangle suggests decreasing volatility and balance between buyers and sellers before the next impulsive move.
At the moment, price action indicates that we are still inside Wave B, with one final sub-wave remaining wave “e” of the triangle. Once this last leg of the triangle is completed, the corrective phase should be fully exhausted.
After the completion of this final wave, the market is expected to resume its bullish move in the form of Wave C, which typically unfolds as a strong impulsive rally. This next move should bring expansion in both momentum and volume compared to the corrective structure we are currently seeing.
To manage risk and execution efficiently, two entry zones have been clearly marked on the chart, and positions should be built using a DCA (Dollar-Cost Averaging) approach rather than a single entry. This allows better positioning in case of short-term volatility during the end of Wave B.
The projected targets for Wave C are also outlined on the chart, based on classical Elliott Wave projections and prior market structure. These levels represent logical areas where partial or full profit-taking can be considered.
⚠️ Invalidation:
This analysis will be invalidated if a candle closes below the marked invalidation level. A confirmed close below that level would indicate that the current wave structure is no longer valid and that the market may be transitioning into a different scenario.
As always, this setup is based on technical structure and probability, not certainty. Proper risk management is essential.
If you have a coin or altcoin you want analyzed, first hit the like button and then comment its name so I can review it for you.
This is not a trade setup, as it has no precise stop-loss, stop, or target. I do not publish my trade setups here.

SUIUSDT – Trade ideaSUI is trading inside a broader downtrend but is currently reacting from a key demand area with multiple FVGs below.
Price already tapped the upper imbalance and may sweep lower liquidity before continuation.
Positioning
Already in the trade.
Looking to add more on deeper pullbacks into the lower FVG, aiming for a higher time-frame mean reversion move.
Bias
As long as price holds above invalidation, this remains a pullback-to-imbalance long setup.
Patience is key — let price fill the imbalance.
MrC

SUI M30 RSI Exhaustion and Bearish Pullback Setup📝 Description
SUI on M30 just ran hard into HTF supply, but RSI has exited the overextension zone and is rolling over, which usually signals momentum exhaustion. That tells me buyers are losing strength, so a bearish pullback is likely to rebalance toward the nearby imbalances below.
________________________________________
📈 Signal / Analysis
Primary Bias: Bearish pullback while below 1.535
Short Setup (Reactive):
• Entry (Sell): 1.520–1.530 (HTF supply reaction)
• Stop Loss: Above 1.535
• TP1: 1.5025
• TP2: 1.4822 (30M FVG)
• TP3: 1.4578 (deeper FVG / liquidity)
________________________________________
🎯 ICT & SMC Notes
• Price tapped HTF OB / supply
• RSI rolling over after leaving overextension zone
• FVG 30M below as downside magnet
________________________________________
🧩 Summary
After a big run, RSI is basically saying “enough.” While price stays capped under supply, odds favor a controlled drop toward 1.50 then 1.48. If weakness persists, 1.45 becomes the next clean draw.
________________________________________
🌍 Fundamental Notes / Sentiment
Alts are still reactive and prone to quick rotations. Without a fresh catalyst, these premium rejections often resolve with a pullback into liquidity and imbalance.
________________________________________
⚠️ Risk Disclosure
Trading involves substantial risk and may result in capital loss. This analysis is for educational purposes only and does not constitute financial advice. Always apply proper risk management, predefined stop-loss levels, and disciplined position sizing aligned with your trading plan.

#SUI/USDT Could switch sides soon. Be ready#SUI
The price is moving in a descending channel on the 1-hour timeframe. It has reached the lower boundary and is heading towards a breakout, with a retest of the upper boundary expected.
We are seeing a bearish trend in the Relative Strength Index (RSI), which has reached near the lower boundary, and an upward bounce is expected.
There is a key support zone in green at 1.37, and the price has bounced from this level several times. Another bounce is expected.
We are seeing a trend towards stabilizing above the 100-period moving average, which we are approaching, supporting the upward trend.
Entry Price: 1.40
First Target: 1.431
Second Target: 1.465
Third Target: 1.50
Remember a simple principle: Money Management.
Place your stop-loss order below the green support zone.
For any questions, please leave a comment.
Thank you.

#SUI/USDT Could switch sides soon. Be ready#SUI
The price is moving in a descending channel on the 1-hour timeframe. It has reached the lower boundary and is heading towards breaking above it, with a retest of the upper boundary expected.
We have a downtrend on the RSI indicator, which has reached near the lower boundary, and an upward rebound is expected.
There is a key support zone in green at 1.40. The price has bounced from this zone multiple times and is expected to bounce again.
We have a trend towards consolidation above the 100-period moving average, as we are moving close to it, which supports the upward movement.
Entry price: 1.43
First target: 1.46
Second target: 1.50
Third target: 1.56
Don't forget a simple principle: money management.
Place your stop-loss below the support zone in green.
For any questions, please leave a comment.
Thank you.

SUI/USDT - Breakouts! Is This the Start of a Trend Reversal?On the 12-hour timeframe, SUI/USDT has successfully broken above the descending resistance trendline that had capped price action since October. This breakout indicates weakening selling pressure and opens the door for a trend transition from bearish toward early bullish conditions.
Price is currently trading around 1.48 USDT, hovering near the former trendline area, suggesting a post-breakout consolidation / retest phase.
---
Pattern Explanation
The dominant technical structure now is:
Descending Trendline Breakout (Potential Trend Reversal)
The long-term descending trendline has been decisively broken
Bearish lower-high structure is losing control
Sideways movement above the trendline suggests a successful retest attempt
Technically, this pattern often marks the early stage of a trend reversal, as long as price holds above the breakout zone.
---
Key Levels
Support (Post-Breakout):
1.45 – 1.48 USDT → Critical breakout retest zone
1.35 USDT → Invalidation level
Resistance / Upside Targets:
1.65 – 1.72 USDT → Nearest resistance
1.96 USDT → Strong supply zone
2.05 – 2.37 USDT → Major resistance area
2.70 USDT → Extended bullish target if reversal fully develops
---
Bullish Scenario (Primary Scenario)
The bullish case becomes the primary scenario if:
1. Price holds above the 1.45 – 1.48 USDT support zone
2. The former trendline acts as new support
3. Bullish continuation candles appear
Bullish Targets:
TP1: 1.65 USDT
TP2: 1.72 USDT
TP3: 1.96 USDT
TP4: 2.05 – 2.37 USDT
---
Bearish Scenario (Invalidation Scenario)
The bearish scenario only applies if:
1. Price falls back below the broken trendline
2. A strong close occurs below 1.35 USDT
Bearish Targets:
1.23 USDT
Lower supports if selling pressure accelerates
As long as price remains above the breakout area, bearish continuation is not favored.
---
Conclusion
The breakout above the descending trendline on SUI/USDT represents a potential early trend reversal signal. The key focus now is whether price can defend the breakout zone as support.
➡️ Holding above support = bullish continuation
➡️ Break back below = false breakout
This is a critical decision zone for the next directional move.
---
#SUIUSDT #SUIBreakout #TrendReversal #CryptoAnalysis #TechnicalAnalysis #Altcoin #SupportResistance #CryptoTrading

#SUI/USDT Could switch sides soon. Be ready#SUI
The price is moving in a descending channel on the 1-hour timeframe. It has reached the lower boundary and is heading towards breaking above it, with a retest of the upper boundary expected.
We have a downtrend on the RSI indicator, which has reached near the lower boundary, and an upward rebound is expected.
There is a key support zone in green at 1.38. The price has bounced from this zone multiple times and is expected to bounce again.
We have a trend towards consolidation above the 100-period moving average, as we are moving close to it, which supports the upward movement.
Entry price: 1.40
First target: 1.42
Second target: 1.44
Third target: 1.48
Don't forget a simple principle: money management.
Place your stop-loss below the support zone in green.
For any questions, please leave a comment.
Thank you.

Rising Channel Breakdown → Waiting for Better Buy Prices on SUISUI has been moving inside a well-defined rising channel on the higher timeframe, forming higher highs and higher lows. However, price is now trading near the lower boundary of the channel , showing signs of weak momentum and potential breakdown.
Historically, a loss of the rising channel support often leads to a deeper corrective move, especially after an extended uptrend. Current structure suggests that downside continuation is more likely before any sustainable bullish scenario.
📌 Key points:
Long-term ascending channel
Price approaching / losing channel support
Increased risk of trend exhaustion and correction
🎯 Downside targets:
Target 1: $0.60
Target 2: $0.25
🛑 Conclusion:
At current levels, buying SUI is not attractive from a risk-reward perspective. A better strategy is to wait for deeper pullbacks and signs of stabilization near the mentioned targets before considering long positions.
This is a patience trade — better prices are likely ahead.

SUIUSD; Heikin Ashi Trade Idea📈 Hey Traders!
Here’s a fresh outlook from my trading desk. If you’ve been following me for a while, you already know my approach:
🧩 I trade Supply & Demand zones using Heikin Ashi chart on the 4H timeframe.
🧠 I keep it mechanical and clean — no messy charts, no guessing games.
❌ No trendlines, no fixed sessions, no patterns, no indicator overload.
❌ No overanalyzing market structure or imbalances.
❌ No scalping, and no need to be glued to the screen.
✅ I trade exclusively with limit orders, so it’s more of a set-and-forget style.
✅ This means more freedom, less screen time, and a focus on quality setups.
✅ Just a simplified, structured plan and a calm mindset.
💬 Let’s Talk:
💡Do you trade supply & demand too ?
💡What’s your go-to timeframe ?
💡Ever tried Heikin Ashi ?
📩 Got questions about my strategy or setup? Drop them below — ask me anything, I’m here to share.
Let’s grow together and keep it simple. 👊

SUI - Catching a Falling KnifeAlright traders, we’re clearly seeing a selloff today…
BUT — and this is very scientific —
I just don’t feel it. 😄
Somewhere deep inside my trader soul,
I still smell a little Santa rally coming for the whole crypto market.
Either that…
or Trump tweets something weird,
and we’re all instantly screwed.
50/50. 🎅💥😂
Now about SUI:
Yes, this is technically a falling knife situation.
Yes, that sounds scary.
But honestly?
The probabilities here are not that bad.
Why I’m taking it:
• liquidity was already taken below
• we had a nice upward move a few days back
• continuation is still possible
• and this whole drop kinda smells like pre-macro manipulation
So yeah —
this is a swing trade,
BUT with a tight stop loss,
because I like excitement, not account destruction. 😄
Could this fail? Absolutely.
Could it work beautifully? Also yes.
That’s crypto.
Let’s see how this plays out.
Good luck traders — and may the knife stop falling right where we catch it 🔪📈😄

SUI SUIUSD SUIUSDT 3D-1W TFWe observe a global ascending channel with clearly defined buy and sell zones where the sell zones on the chart are marked sequentially as 1, 2, 3, and 4.
In addition, there is a secondary descending channel, which indicates that the current price is located within an area of global (long-term) accumulation.
At these levels it is already reasonable to start building a position, while keeping in mind that the price may still be pushed lower.
If further downside occurs it will represent an even better opportunity for accumulation. If the price does not go lower - the current entries remain justified.
In the event of a continuation within the descending channel and a confirmed breakout and consolidation above the red zone, a price move toward the maximum target in the purple zone.
All possible scenarios are illustrated on the chart.

Start of a full-blown uptrend: 2.0-2.1446
Hello, traders!
Follow us to get the latest information quickly.
Have a great day!
-------------------------------------
(SUIUSDT 1M chart)
To continue the uptrend, the price must rise above the M-Signal indicator on the 1M chart and hold.
Accordingly, the key question is whether the price can rise above the 2.0-2.1446 range and maintain its upward momentum.
If the upward movement fails, we should observe whether the M-Signal indicator on the 1M chart moves sideways until it declines near the Fibonacci level of 0.236 (1.3434).
-
(1W chart)
The key question is whether the price can find support and rise near the newly forming DOM (-60) ~ HA-Low range (1.4969-1.8396).
Based on the basic trading strategy, the target range is around the 4.2272-4.7328 range.
However, caution is advised when trading, as the price is currently forming below the M-Signal indicator on the 1M chart.
Therefore, I think it's best to start trading after confirming whether the price rises to around 2.0-2.1446 and maintains its strength.
-
(1D Chart)
When analyzing charts, it's best to observe the movements of the 1D chart as a basic trading strategy.
This is because most indicators are derived from the 1D chart.
In this sense, the key is whether the price can find support and rise around the 1.3451-1.5174 range, which is the DOM(-60) ~ HA-Low range on the 1D chart.
As mentioned earlier, to sustain the uptrend from a long-term perspective, the price must remain above the M-Signal indicator on the 1M chart. Therefore, the current price level is not suitable for trading.
A decline in the DOM(-60) ~ HA-Low range could lead to a step-down trend.
This means that the price is renewing its low, but it can also be considered a time for a split buy.
Therefore, you should consider how to execute a split buy before starting a trade.
If the price rises from the DOM(-60) to HA-Low range, the HA-High to DOM(60) range will form.
Therefore, if you bought near the DOM(-60) to HA-Low range, you should sell near the HA-High to DOM(60) range.
However, if the price rises from the HA-High to DOM(60) range, it's likely to form a step-up trend, so it's recommended to sell in steps.
As mentioned earlier, a step-up trend, like a step-down trend, means that the price is renewing its high.
Therefore, since a sharp decline is possible at any time, it's advisable to sell in steps at the appropriate time to secure profits.
-
In summary, if you encounter the DOM(-60) or HA-Low indicators, you should focus on finding the right time to buy and consider how to execute the split purchase.
Furthermore, if you encounter the DOM(60) or HA-High indicators, you should focus on finding the right time to sell and consider how to execute the split purchase.
This is the basic trading strategy.
If not, and you buy when the HA-High ~ DOM(60) range supports and rises, or sell when the DOM(-60) ~ HA-Low range resists and falls, it's best to maintain your stop loss.
-
Thank you for reading to the end.
I wish you successful trading.
--------------------------------------------------

SUI/USDT - Market StructurePrice is attempting a reversal via a double bottom.
The key resistance at the moment is the prior low zone at $1.70–1.90.
RSI is also capped near the 50 level, preventing a move into bullish territory.
On the weekly chart , the only potential reversal signal so far is extreme RSI oversold conditions — no other confirmations yet.
Current structure allows for a long setup with clearly defined risk:
— stop-loss below $1.50.
Since price is trading inside a channel, the majority of the position should be taken off just below the channel midline.

SUI/USDT : LIMITHello friends
As you can see, after the resistance level we set was broken, the price has grown well, and now with this bullish trend, there is a sign of sellers entering, and there is a possibility of price correction, and the price can grow again from these areas and move to our targets.
This analysis is technically reviewed and is not a buy or sell recommendation, so please follow risk and capital management.
*Trade safely with us*

SUI/USD - Weekly Chart AnalysisThe price action on the weekly timeframe shows SUI moving within a well-defined bullish flag pattern, characterized by a strong impulsive move upward followed by a controlled, downward-sloping consolidation channel.
🔹 Pattern Structure
The overall structure forms a bullish flag, which is typically a continuation pattern appearing after a strong upward rally.
The price is currently trading near the lower boundary of the flag, an area that has historically acted as dynamic support throughout the consolidation phase.
The repeated bounces from this region highlight ongoing demand and suggest the pattern remains valid.
🔹 Market Behavior
The pullback within the flag appears orderly, with price respecting the upper and lower trendlines of the channel.
Volume behavior also supports the flag structure:
Momentum expanded during the impulsive rally, then contracted during consolidation—typical of a healthy continuation setup.
🔹 Potential Scenario
If the lower boundary continues to hold:
The chart suggests a potential upward breakout from the flag.
This breakout would align with the larger trend and indicate a continuation of the previous bullish leg.
A breakout from the flag’s upper trendline would confirm the move and open the way for a new expansion phase.
🔹 Summary
SUI is consolidating within a bullish flag, maintaining its structure and showing signs of strength at support. As long as the lower channel boundary remains intact, the pattern favors a continuation of the broader uptrend.

SUI failed to break out above the red resistance zone🚨📊 SUI Update
SUI failed to break out above the red resistance zone 🔴
and got rejected, confirming strong seller presence.
As long as price stays below this level,
upside remains limited.