#SUI/USDT The Interesting part of the market#SUI
The price is moving in a descending channel on the 1-hour timeframe and is expected to break out and continue upwards.
We have a trend to stabilize above the 100-period moving average again.
We have a downtrend on the RSI indicator, which supports an upward move if it breaks above it.
We have a key support zone in green that pushed the price up to 1.93.
Entry price: 1.96
First target: 1.97
Second target: 2.02
Third target: 2.04
For risk management, don't forget your stop-loss and capital management.
The stop-loss is below the support zone in green.
Upon reaching the first target, take some profit and then change your stop-loss order to an entry order.
For any questions, please comment.
Thank you.
Suiusdtlong

SUIUSDTPrice reacted from the 1.8200 dollar support and entered a short-term correction but remains within the main descending channel. The bearish momentum is still dominant, and unless a candle closes above 2.2900 dollar, the price may retest lower zones near 1.5400 dollar. Fibonacci levels define the key horizontal supports and resistances in this setup.
BINANCE:SUIUSDT

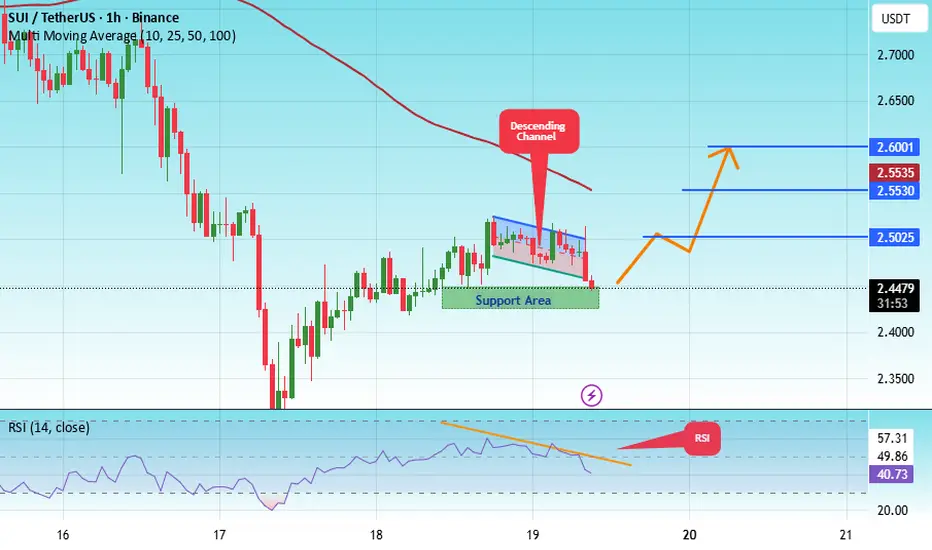
#SUI/USDT The Interesting part of the market#SUI
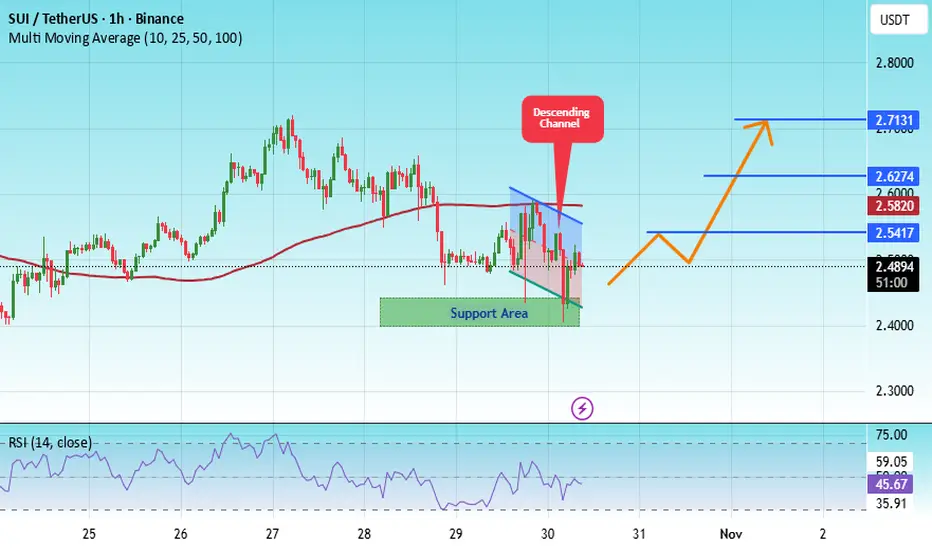
The price is moving within an ascending channel on the 1-hour timeframe and is adhering to it well. It is poised to break out strongly and retest the channel.
We have a downtrend line on the RSI indicator that is about to break and retest, which supports the upward move.
There is a key support zone in green at the price of 2.42, representing a strong support point.
We have a trend to stabilize above the 100-period moving average.
Entry price: 2.49
First target: 2.61
Second target: 2.62
Third target: 2.71
Don't forget a simple point: money management.
Upon reaching the first target, save some money and then change your stop-loss order to an entry order.
For any questions, please leave a comment.
Thank you.
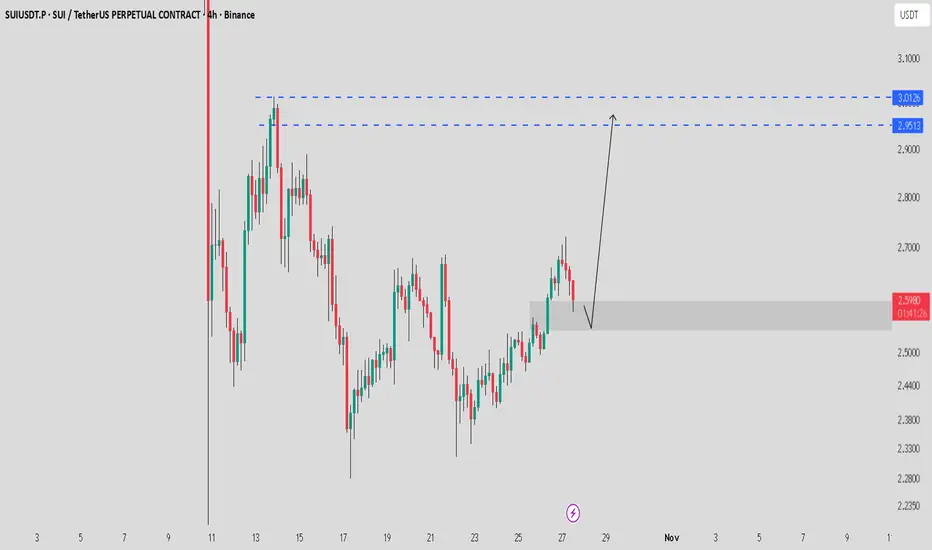
SUI / USDT Testing FVG zone_Watching for reversal towards $3SUI is showing strong momentum and currently testing the FVG zone on the 4H timeframe.
If price bounces from this support, we could see a move towards $2.95 – $3.01.
Note: Wait for a proper confirmation of reversal — a breakdown below this zone will invalidate the setup.
#SUI/USDT - Head and Shoulders Long#SUI
The price is moving within a descending channel on the 1-hour frame, adhering well to it, and is heading for a strong breakout and retest.
We have a bearish trend on the RSI indicator that is about to be broken and retested, which supports the upward breakout.
There is a major support area in green at 2.38, representing a strong support point.
We are heading for consolidation above the 100 moving average.
Entry price: 2.40
First target: 2.48
Second target: 2.54
Third target: 2.63
Don't forget a simple matter: capital management.
When you reach the first target, save some money and then change your stop-loss order to an entry order.
For inquiries, please leave a comment.
Thank you.

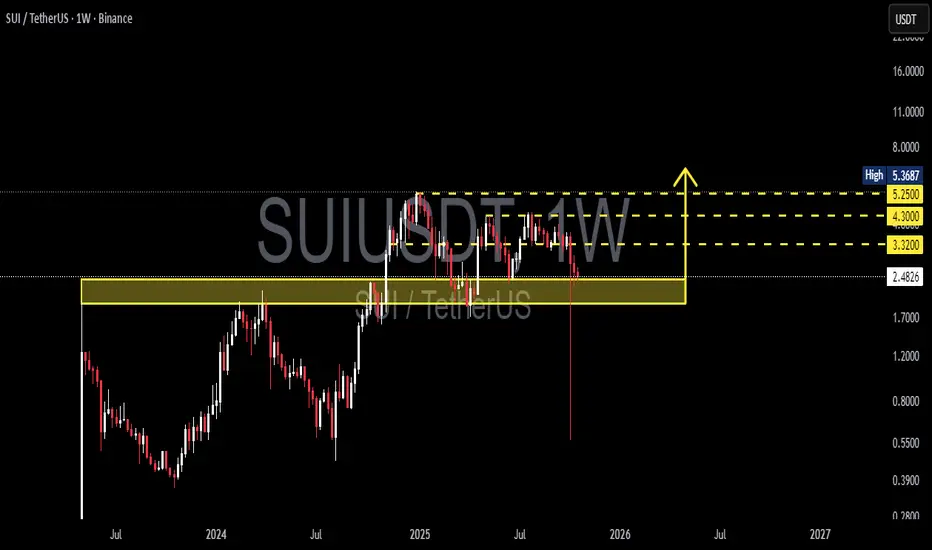
SUI/USDT — Last Defense Before the Next Major Move?SUI is now approaching a critical demand zone between $1.93 – $2.40 — a region that once acted as macro resistance during its early 2024 breakout, and now serves as the final major support on the weekly structure.
After multiple failed attempts to reclaim the mid-range resistance at $3.32 – $4.30, price action has rotated downward into this yellow box — forming what could become either a springboard for a major reversal or a breakdown trigger if support fails.
---
🔹 Technical Overview
The yellow block ($1.93–$2.40) represents a long-term structural pivot — previously resistance, now retested as support.
The wick rejection from lower levels shows early buying interest and liquidity sweep below the zone.
However, momentum remains neutral to bearish until price can reclaim $3.32 on a weekly close.
---
🟢 Bullish Scenario
If SUI successfully holds above $1.93 and forms a strong weekly close above $2.40, buyers could gain control and aim for:
$3.32 → key mid-level resistance
$4.30 → previous consolidation cap
$5.25 – $5.36 → macro breakout target
A reclaim of $3.32 would confirm a potential trend reversal, shifting market structure from distribution to accumulation.
---
🔴 Bearish Scenario
If SUI breaks and closes below $1.93, the structure shifts decisively bearish.
Downside targets open toward $1.20, then $0.80 – $0.55 (prior liquidity base).
Breakdown beneath this zone would signal loss of structural support and likely trigger capitulation-type movement.
---
⚖️ Key Takeaway
SUI is at a macro decision zone — where either a long-term base forms or a deeper correction begins.
A clean weekly close and volume confirmation will define the next 3–6 month direction.
This is not a random level — this is where smart money decides who wins the next phase.
---
📊 Major Levels
Support Zone (yellow box): $1.93 – $2.40
Resistance Levels: $3.32 → $4.30 → $5.25 – $5.36
Trend Confirmation: Weekly close above $3.32 = bullish reversal
---
#SUI #SUIUSDT #Crypto #TechnicalAnalysis #PriceAction #Altcoins #SwingTrading #SupportResistance #CryptoCharts #MarketStructure #SUIAnalysis
#SUI/USDT Bullish scenario#SUI
The price is moving within a descending channel on the 1-hour frame, adhering well to it, and is heading for a strong breakout and retest.
We have a bearish trend on the RSI indicator that is about to be broken and retested, which supports the upward breakout.
There is a major support area in green at 2.43, representing a strong support point.
We are heading for consolidation above the 100 moving average.
Entry price: 2.45
First target: 2.50
Second target: 2.55
Third target: 2.60
Don't forget a simple matter: capital management.
When you reach the first target, save some money and then change your stop-loss order to an entry order.
For inquiries, please leave a comment.
Thank you.
#SUI/USDT Bullish scenario#SUI
The price is moving within a descending channel on the 1-hour frame, adhering well to it, and is heading for a strong breakout and retest.
We have a bearish trend on the RSI indicator that is about to be broken and retested, which supports the upward breakout.
There is a major support area in green at 2.61, representing a strong support point.
We are heading for consolidation above the 100 moving average.
Entry price: 2.81
First target: 2.96
Second target: 3.11
Third target: 3.30
Don't forget a simple matter: capital management.
When you reach the first target, save some money and then change your stop-loss order to an entry order.
For inquiries, please leave a comment.
Thank you.

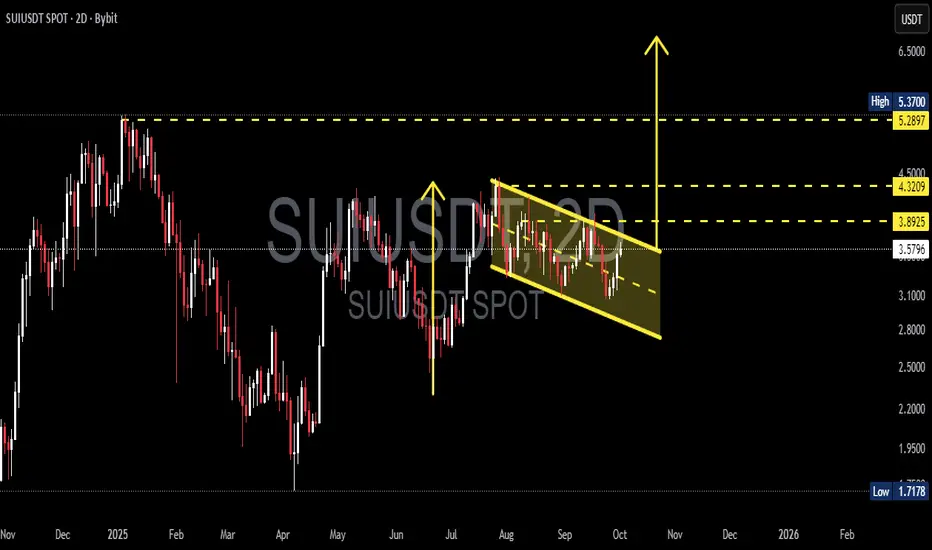
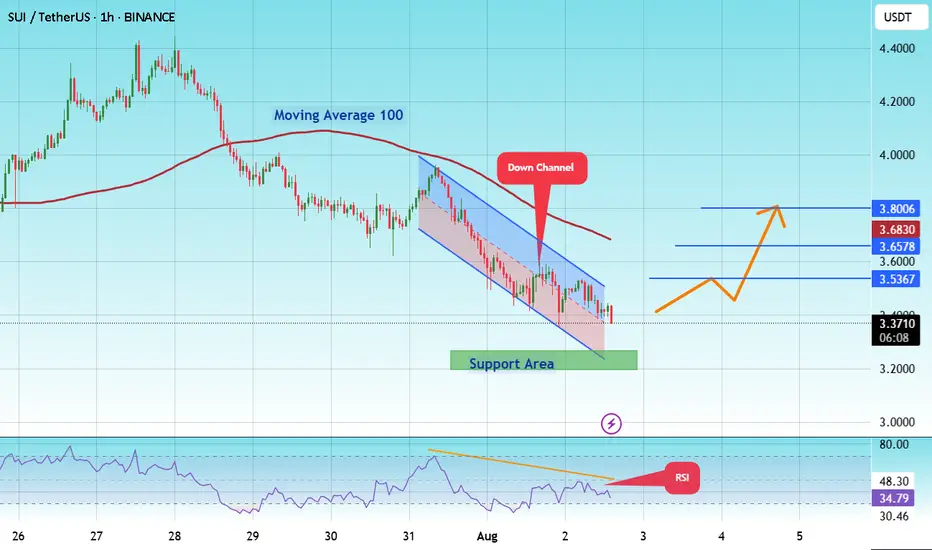
SUI/USDT — Bullish Flag, Consolidation Before the Next Rally?📌 Pattern Overview
SUI is currently forming a Bullish Flag pattern, which consists of:
Flagpole: the strong rally from June–July that pushed the price significantly higher.
Flag: a downward-sloping consolidation channel (descending channel) since August.
This pattern typically indicates a healthy pause after a strong uptrend, often followed by another bullish continuation.
---
🔍 Technical Analysis
Current Price: $3.58.
Upper flag line (resistance): around $3.89–$3.90.
Lower flag line (support): around $2.80.
Key horizontal levels: $3.89 → $4.32 → $5.29/$5.37 (previous high).
---
📈 Bullish Scenario (Valid Flag Breakout)
Confirmation: A breakout above the upper flag line with a strong 2D candle close and rising volume.
Flagpole projection target:
Previous flagpole measured from ~$2.0 → ~$5.3 = ~$3.3 move.
Breakout above ~$3.9 projects a target near $7.0 – $7.2.
Upside targets (step by step):
Target 1: $3.89 (first resistance).
Target 2: $4.32 (mid resistance).
Target 3: $5.29–$5.37 (previous top).
Extended target: $7.0 (flagpole projection).
Stop-loss: Below the breakout point or below the lower flag line (~$2.80).
---
📉 Bearish Scenario (Failed Flag)
Confirmation: Rejection at the upper flag line, or a breakdown below the channel.
Downside targets:
$2.80 (intra-flag support).
$2.20 → $1.72 (major support levels).
Extended target near $1.28 if a full breakdown occurs and the flag invalidates.
---
⚖️ Extra Confirmations
1. Volume: Breakout should be accompanied by a clear volume spike.
2. RSI: A move above 50–60 strengthens the bullish case.
3. MACD: Bullish crossover supports momentum continuation.
---
🎯 Conclusion
SUI is consolidating inside a Bullish Flag, a classic continuation pattern. A confirmed breakout could trigger a move towards $5.37, with an extended upside target near $7.0. Failure to break out, however, would bring price back to supports around $2.80 – $1.72.
Traders should wait for confirmation via candle close and volume before entering, and maintain strict risk management in case of pattern failure.
---
#SUI #SUIUSDT #Crypto #Altcoins #TechnicalAnalysis #BullishFlag #Breakout #PriceAction #CryptoTrading
#SUI/USDT mid-term I believe this one will pump#SUI
The price is moving in a descending channel on the 1-hour frame and is expected to break and continue upward.
We have a trend to stabilize above the 100 moving average once again.
We have a downtrend on the RSI indicator that supports the upward move with a breakout.
We have a major support area in green that pushed the price higher at 3.62.
Entry price: 3.70.
First target: 3.75.
Second target: 3.82.
Third target: 3.90.
To manage risk, don't forget stop loss and capital management.
When you reach the first target, save some profits and then change the stop order to an entry order.
For inquiries, please comment.
Thank you.

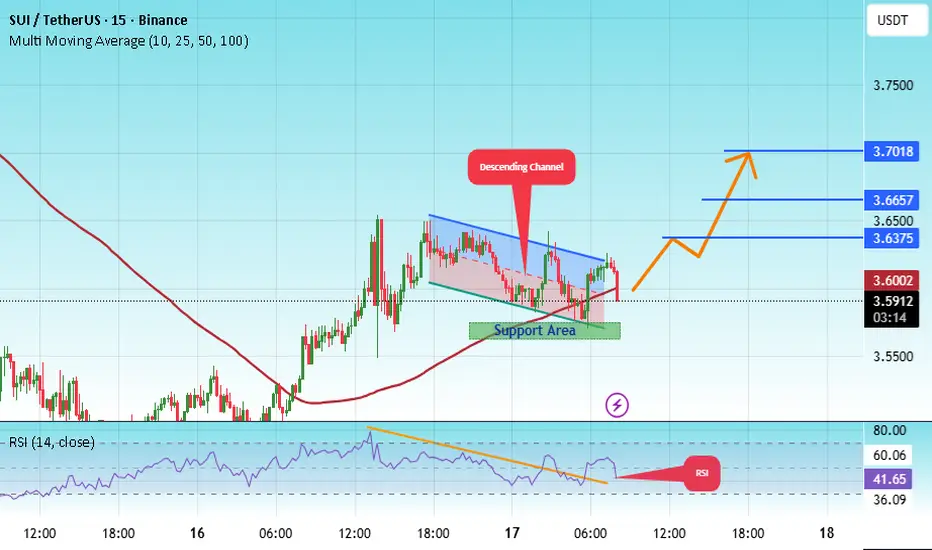
#SUI/USDT bullish structure formed at the chart#SUI
The price is moving within a descending channel on the 1-hour frame, adhering well to it, and is heading for a strong breakout and retest.
We have a bearish trend on the RSI indicator that is about to be broken and retested, which supports the upward breakout.
There is a major support area in green at 3.56, representing a strong support point.
We are heading for consolidation above the 100 moving average.
Entry price: 3.60
First target: 3.64
Second target: 3.66
Third target: 3.70
Don't forget a simple matter: capital management.
When you reach the first target, save some money and then change your stop-loss order to an entry order.
For inquiries, please leave a comment.
Thank you.
#SUI/USDT → Resistance breakout and entry into the buying zone#SUI
The price is moving within a descending channel on the 1-hour frame, adhering well to it, and is heading for a strong breakout and retest.
We have a bearish trend on the RSI indicator that is about to be broken and retested, which supports the upward breakout.
There is a major support area in green at 3.14, which represents a strong support point.
For inquiries, please leave a comment.
We are in a consolidation trend above the 100 Moving Average.
Entry price: 3.29
First target: 3.38
Second target: 3.51
Third target: 3.67
Don't forget a simple matter: capital management.
When you reach the first target, save some money and then change your stop-loss order to an entry order.
For inquiries, please leave a comment.
Thank you.

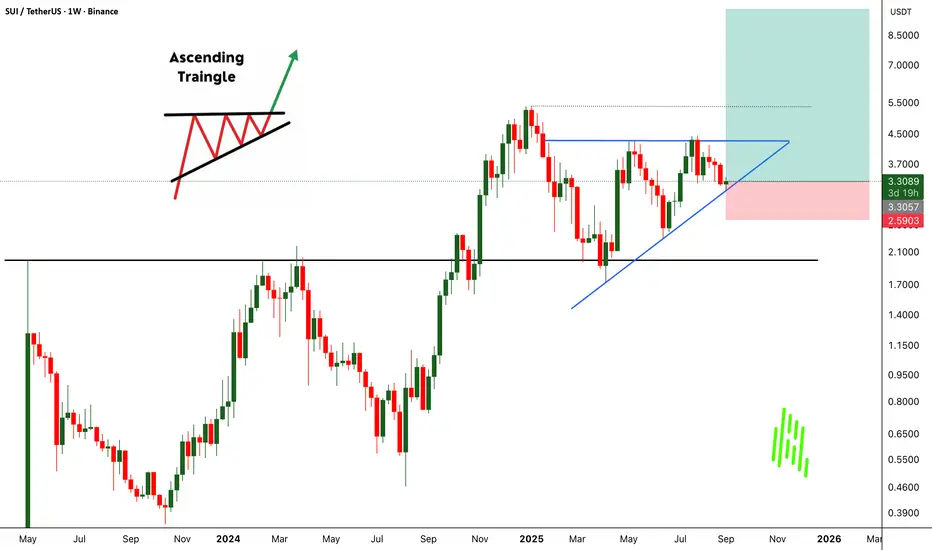
SUIUSDT Weekly Outlook!! Target $10CRYPTOCAP:SUI has once again bounced strongly from its key support zone, making it the third touch at this level. Each time price defends this area, it reinforces the strength of buyers stepping in, showing that demand remains intact.
On the weekly chart, BINANCE:SUIUSDT is now shaping a clean Ascending Triangle pattern. This is typically a bullish continuation setup, and the structure is becoming clearer with every retest. The longer price consolidates under the resistance, the stronger the breakout move is likely to be once bulls finally push through.
All eyes remain on the $4.4 breakout level. A successful close above this resistance could open the door for a powerful move to the upside. My target remains unchanged at $10, supported by the bullish technical formation and repeated validation of support.
BINANCE:SUIUSDT Currently trading at $3.3
Buy level : Above $3.3
Stop loss : Below $2.62
Target 1: $4
Target 2: $5
Target 3: $7
Target 4: $10
Max leverage 2x
Always keep stop loss
Follow Our Tradingview Account for More Technical Analysis Updates, | Like, Share and Comment Your thoughts
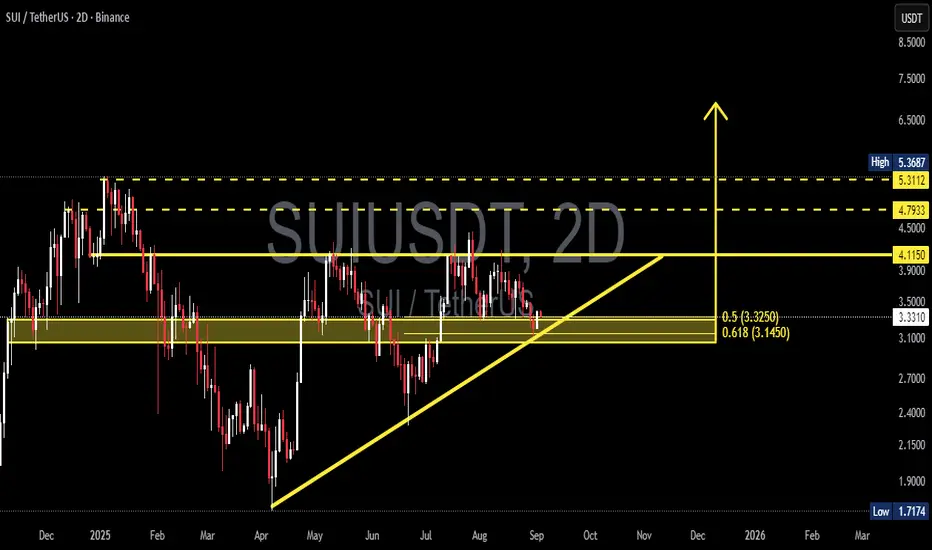
SUIUSDT — Test Golden Pocket: Breakout or Breakdown Ahead?🔎 Overview:
SUI/USDT is currently sitting at a critical decision point. Since April 2025, price action has been forming higher-lows supported by an ascending trendline (yellow). On the upside, we see a flat resistance around 4.115, creating an Ascending Triangle pattern — a classic bullish continuation structure that often precedes a breakout.
However, price is now testing the key demand zone at 3.33–3.15, which perfectly aligns with the Fibonacci golden pocket (0.5 & 0.618 retracement). This zone will likely determine the next major move: either a strong rebound to the upside or a deeper breakdown.
---
📈 Bullish Scenario (Breakout Potential):
Trigger: Price holds above 3.33–3.15 and breaks 4.115 with a strong 2D candle close.
Pattern Implication: A breakout from the ascending triangle usually results in a move equal to the pattern’s height (~0.9–1.1 points), projecting targets around 5.0–5.3.
Targets:
TP1 = 4.79 (intermediate liquidity)
TP2 = 5.31–5.37 (major resistance & previous high)
Extra Signal: A breakout with rising volume would strengthen the bullish outlook significantly.
---
📉 Bearish Scenario (Breakdown Risk):
Trigger: A decisive close below 3.10, which would break both the ascending trendline and the golden pocket.
Consequence: This breakdown could open the door to a deeper retracement.
Targets:
2.70 (minor support)
2.40 (major support)
2.15 (previous demand zone)
Extreme case: 1.72 (historical low)
Invalidation: A recovery above 3.35 followed by a breakout over 4.115 would nullify the bearish setup.
---
📌 Conclusion:
SUI is at a make-or-break level. The 3.33–3.15 zone is the battlefield between bulls and bears, marking the golden pocket of this structure. Holding this level keeps the door open for a bullish breakout towards 5.0–5.3, while losing it could trigger a significant drop toward the 2.70–2.15 range.
📊 Strategy: Wait for a confirmed 2D close before positioning. Manage risk tightly and watch how price reacts at this golden pocket zone — it will set the tone for the next major trend.
---
#SUI #SUIUSDT #CryptoAnalysis #AscendingTriangle #PriceAction #SupplyDemand #GoldenPocket #Fibonacci #CryptoBreakout #SupportResistance #SwingTrading
#SUI/USDT → Resistance breakout and entry into the buying zone#SUI
The price is moving within an ascending channel on the 1-hour frame, adhering well to it, and is on its way to breaking strongly upwards and retesting it.
We have support from the lower boundary of the ascending channel, at 3.40.
We have a downtrend on the RSI indicator that is about to break and retest, supporting the upside.
There is a major support area in green at 3.50, which represents a strong basis for the upside.
Don't forget a simple thing: ease and capital.
When you reach the first target, save some money and then change your stop-loss order to an entry order.
For inquiries, please leave a comment.
We have a trend to hold above the 100 Moving Average.
Entry price: 3.51
First target: 3.60
Second target: 3.72
Third target: 3.90
Don't forget a simple thing: ease and capital.
When you reach the first target, save some money and then change your stop-loss order to an entry order.
For inquiries, please leave a comment.
Thank you.

SUIUSDT: Price Action AnalysisGiven that we had an accelerated move upwards, so it needs a break and correction. It seems that liquidity has not yet been filled at low prices, so it is expected that the trend will start to decline after reaching the 3.75 point and correct to the 3.4 point and continue its growth again.

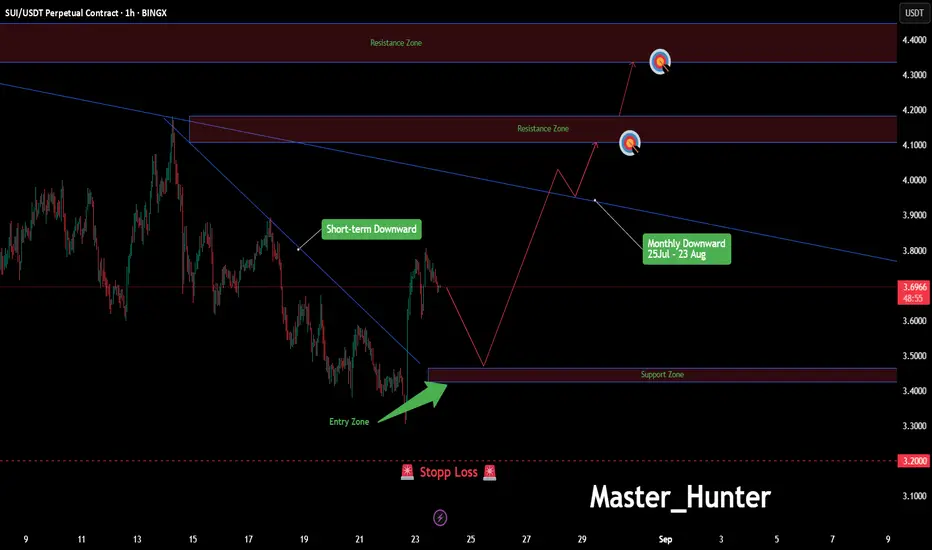
SUI/USDT: Bullish Blast to 4.44?BINGX:SUIUSDT.P is heating up on the 1-hour chart , with an entry zone between 3.465-3.425 near a key support and bullish divergence. 🎯 First target at 4.105-4.180 hits initial resistance, while the second target at 4.330-4.440 could spark a major breakout! 📈 Set a stop loss on a daily close below 3.2 to keep risk tight. 🌟 A break above 3.5 with strong volume could ignite this move, driven by market hype and altcoin momentum. Watch for confirmation candles! 💡 Ready to ride this wave? Drop your take below!
📝 Trade Plan:
✅ Entry Zone: 3.465 – 3.425 (support area + divergence)
❌ Stop Loss: Daily close below 3.20 to keep risk tight
🎯 Target 1: 4.105 – 4.180 (first resistance)
🎯 Target 2: 4.330 – 4.440 (major breakout zone)
#SUIUSDT #CryptoTrading #TechnicalAnalysis #TradingView #Altcoins #DayTrading #MarketSignals #Altseason
SUI SCALP Long / Buy SetupIt's a scalp setup, don't hold any trade for so long, must use sl and never use more than 2% of your wallet size on SL. Market is risky can take a sharp movement any side, So be careful. Reason for this trade is, it has taken downside SL and didn't close the candle, So we can take the long trade n target early shorters sl. If tp hits first then ignore the trade.

#SUI/USDT#SUI
The price is moving within an ascending channel on the 1-hour frame, adhering well to it, and is on its way to breaking strongly upwards and retesting it.
We have support from the lower boundary of the ascending channel, at 3.76.
We have a downtrend on the RSI indicator that is about to break and retest, supporting the upside.
There is a major support area in green at 3.72, which represents a strong basis for the upside.
Don't forget a simple thing: ease and capital.
When you reach the first target, save some money and then change your stop-loss order to an entry order.
For inquiries, please leave a comment.
We have a trend to hold above the 100 Moving Average.
Entry price: 3.85
First target: 3.93
Second target: 4.08
Third target: 4.42
Don't forget a simple thing: ease and capital.
When you reach the first target, save some money and then change your stop-loss order to an entry order.
For inquiries, please leave a comment.
Thank you.

SUI Swing Buy / Long SetupSui is on Strong and decision Order block on 1 day Timeframe, If we break this then SUI will take correction till recent weekly low. If we hold this then new ath. Book some or 80% on mentioned area, rest hold till 6$.

#SUI/USDT Update – Bounce Setup from Demand Zone?#SUI
The price is moving within a descending channel on the 1-hour frame and is expected to break and continue upward.
We have a trend to stabilize above the 100 moving average once again.
We have a downtrend on the RSI indicator that supports the upward break.
We have a support area at the lower boundary of the channel at 3.27, acting as strong support from which the price can rebound.
We have a major support area in green that pushed the price higher at 3.20.
Entry price: 3.38
First target: 3.58
Second target: 3.65
Third target: 3.80
To manage risk, don't forget stop loss and capital management.
When you reach the first target, save some profits and then change the stop order to an entry order.
For inquiries, please comment.
Thank you.
SUIUSDT Cup & Handle Breakout SUI has formed a classic Cup and Handle pattern on the daily chart and has now successfully broken above the neckline resistance around $4.30. This breakout could trigger a strong bullish continuation if volume sustains and retests hold.
Key Points:
Pattern: Cup and Handle
Breakout Level: ~$4.30 (neck resistance)
Potential Upside Target: $5.50 – $6.00+ based on pattern projection
Support Zone: $3.50
Confirmation: Sustained volume and close above neckline
Cheers
Hexa
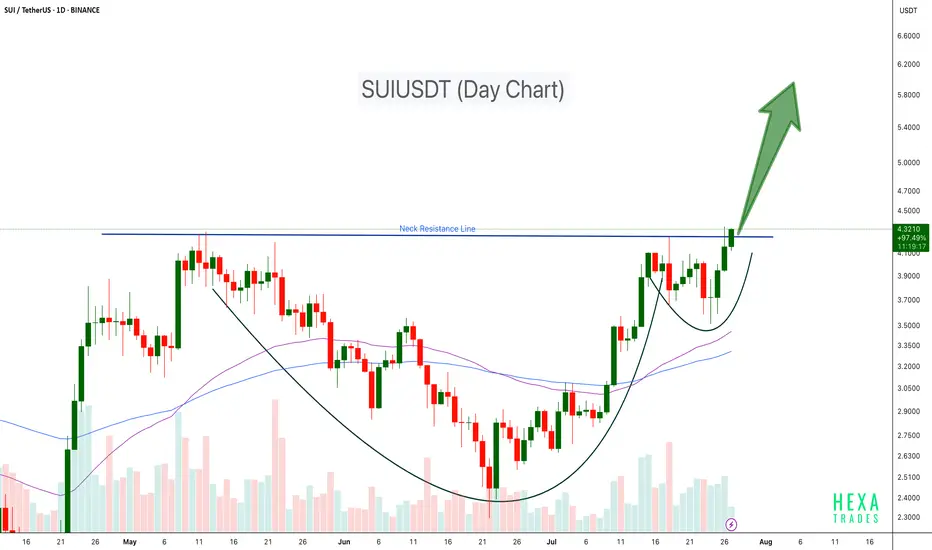
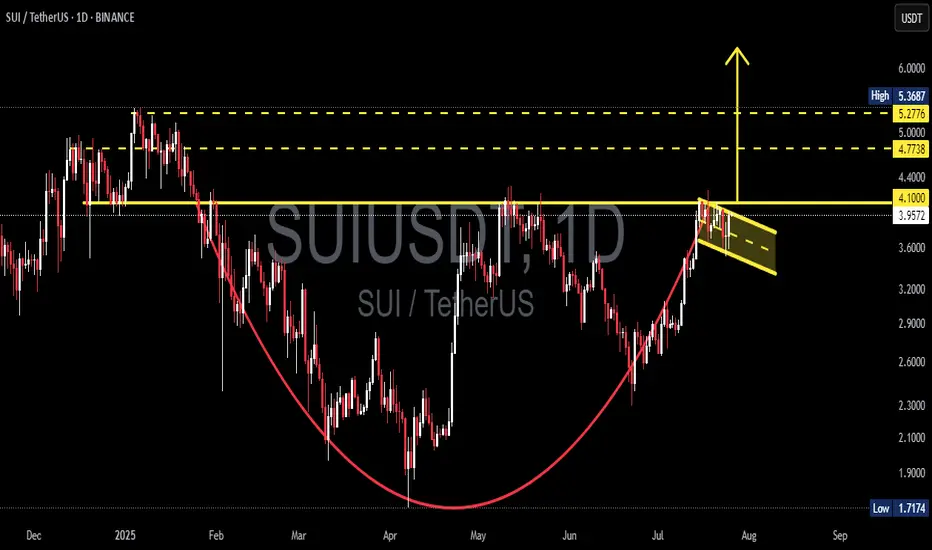
SUI/USDT Massive Cup and Handle Pattern Unfolding Is a Breakout?🧠 Technical Overview:
The daily chart of SUI/USDT showcases a textbook formation of the Cup and Handle pattern — a powerful bullish continuation signal that often precedes explosive upside moves.
The “Cup” took shape between January and July 2025, reflecting a deep rounding bottom. This indicates a long-term accumulation phase where bears gradually lose control.
The “Handle” is currently forming as a downward-sloping consolidation channel, often known as a bullish flag, which is typically the final pause before a breakout.
🔍 Key Technical Levels:
Current Price: $3.9661
Support Zone: $3.96
Major Resistance Levels to Watch:
$4.10 (handle resistance & breakout trigger)
$4.40 (local structural high)
$4.77 (previous high & fib extension zone)
$5.00 (psychological level)
$5.36 (measured move target from cup breakout)
---
🟢 Bullish Scenario: Breakout Incoming
If price breaks and closes above the handle resistance around $4.10, backed by increasing volume:
This confirms the Cup and Handle breakout.
Expect a rapid move toward $4.77 – $5.36 in the short to mid term.
The height of the cup projected upward gives a target of approximately +35% gain from breakout point.
🔔 Watch for:
Bullish engulfing candles
Volume spike during breakout
Break of upper trendline from the handle
---
🔴 Bearish Scenario: Breakdown Risk
If the price fails to hold the $3.96 support and breaks down from the handle channel:
Price may retest lower support zones near $3.60 or even $3.20
However, as long as the cup’s base at ~$2.50 holds, the macro bullish structure remains valid.
⚠️ Invalidation: A daily close below $3.60 would invalidate the short-term bullish setup.
---
📊 Pattern Psychology:
The Cup and Handle pattern reflects investor accumulation, shakeout, and renewed confidence. This is often seen in strong uptrending markets — and the current structure suggests that bulls are quietly preparing for a potential breakout.
---
📅 Timing Outlook:
Handle formations typically last between 1–3 weeks. If this timeline holds, a breakout could occur before mid-August 2025.
---
✅ Conclusion:
The technical setup for SUI/USDT is extremely compelling. With a strong Cup and Handle pattern nearing completion, and key resistance just overhead, traders should prepare for potential breakout conditions. A confirmed move above $4.10 could trigger a bullish wave toward $5.00+.
📌 Set alerts. Manage risk. And don’t ignore the volume.
#SUI #SUIUSDT #CryptoBreakout #CupAndHandle #BullishSetup #CryptoChartPatterns #AltcoinAnalysis #TechnicalAnalysis #BreakoutTrade