SUN Analysis (1D)The structure on higher timeframes is still bullish, but the internal structure is bearish. It is expected that the internal structure will remain bearish until the entry points we have identified.
After sweeping the liquidity pool marked on the chart and reaching our entry points, the price is expected to react and move upwards.
A long position can be taken on spot. We have identified two entry points, and the targets are also marked on the chart.
A daily candle closing below the invalidation level will invalidate this analysis.
For risk management, please don't forget stop loss and capital management
When we reach the first target, save some profit and then change the stop to entry
Comment if you have any questions
Thank You
SUN

SUNUSDT Forming Falling WedgeSUNUSDT is forming a clear falling wedge pattern, a classic bullish reversal signal that often indicates an upcoming breakout. The price has been consolidating within a narrowing range, suggesting that selling pressure is weakening while buyers are beginning to regain control. With consistent volume confirming accumulation at lower levels, the setup hints at a potential bullish breakout soon. The projected move could lead to an impressive gain of around 50% to 60% once the price breaks above the wedge resistance.
This falling wedge pattern is typically seen at the end of downtrends or corrective phases, and it represents a potential shift in market sentiment from bearish to bullish. Traders closely watching SUNUSDT are noting the strengthening momentum as it nears a breakout zone. The good trading volume adds confidence to this pattern, showing that market participants are positioning early in anticipation of a reversal.
Investors’ growing interest in SUNUSDT reflects rising confidence in the project’s long-term fundamentals and current technical strength. If the breakout confirms with sustained volume, this could mark the start of a fresh bullish leg. Traders might find this a valuable setup for medium-term gains, especially as the wedge pattern completes and buying momentum accelerates.
✅ Show your support by hitting the like button and
✅ Leaving a comment below! (What is your opinion about this Coin?)
Your feedback and engagement keep me inspired to share more insightful market analysis with you!

SUN Market Update📊 NYSE:SUN Market Update
📉 If SUN retraces to the 🟢 green zone level, it could provide a better 🎯 entry or re-entry opportunity with confirmation — where buyers previously accumulated.
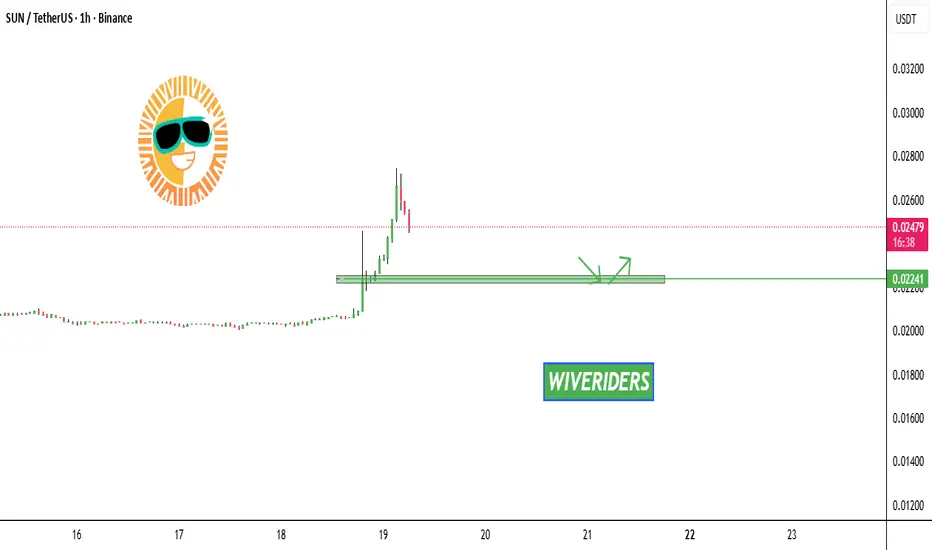
SUN/USDT ENTERING INTO IMPORTANT INCREASE BOXthere’s a good chance we could see SUN/USDT increase in the coming timeframes, as an important TA cross signals a potential new trend breakout. However, this will depend on the data
Reason of follow is the high chance of break.

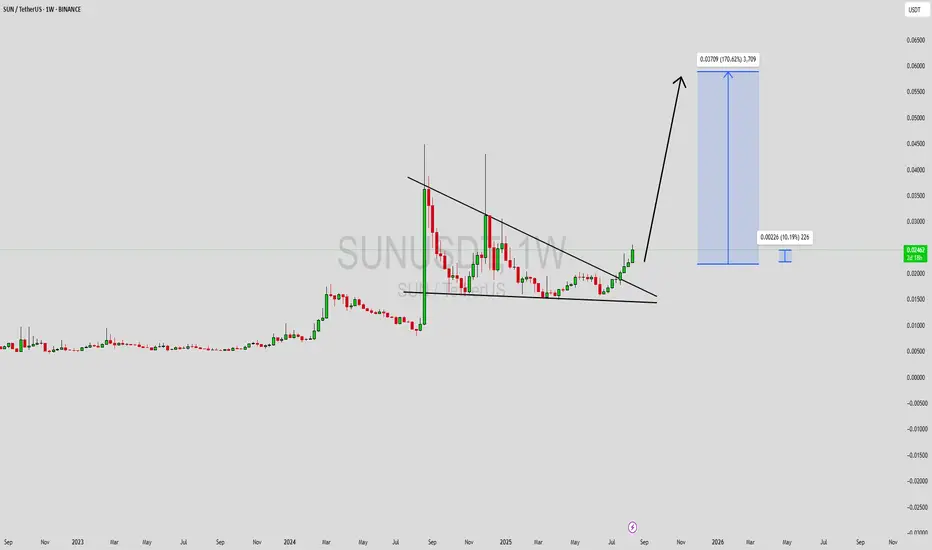
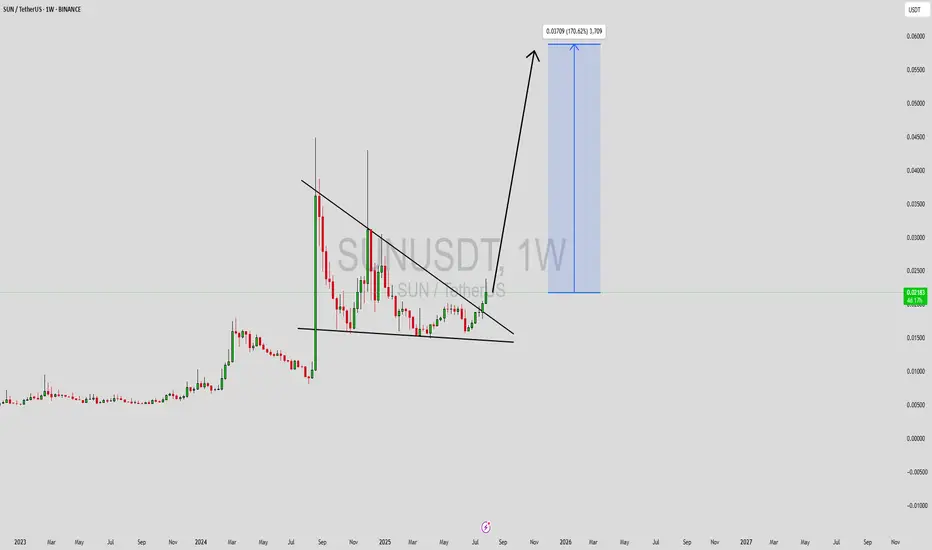
SUNUSDT Forming Descending TriangleSUNUSDT is showing a strong bullish breakout from a long-term descending triangle, a formation that often precedes explosive price action. The weekly chart reveals a sustained breakout above the multi-month trendline resistance, indicating a shift in market structure and signaling that bulls are gaining control. With volume gradually building up and a clear structure confirming accumulation, SUNUSDT appears ready for a significant move. Based on the current chart setup, there’s potential for an impressive 140% to 150% upside.
Historically, SUN has shown sharp vertical rallies following periods of consolidation. The current breakout mimics past behavior and could lead to a powerful trend continuation toward the 0.06000 USDT region. Traders and investors alike are paying close attention to this level, as the next wave of bullish sentiment could send SUNUSDT into price discovery, especially with the crypto market showing renewed optimism.
Market sentiment around SUN is also improving due to increasing attention from retail and institutional players. Social buzz, coupled with increased transaction volumes, reflects growing confidence in this project's roadmap and future prospects. If current momentum continues, SUNUSDT might outperform other altcoins in the short-to-medium term.
✅ Show your support by hitting the like button and
✅ Leaving a comment below! (What is You opinion about this Coin)
Your feedback and engagement keep me inspired to share more insightful market analysis with you!
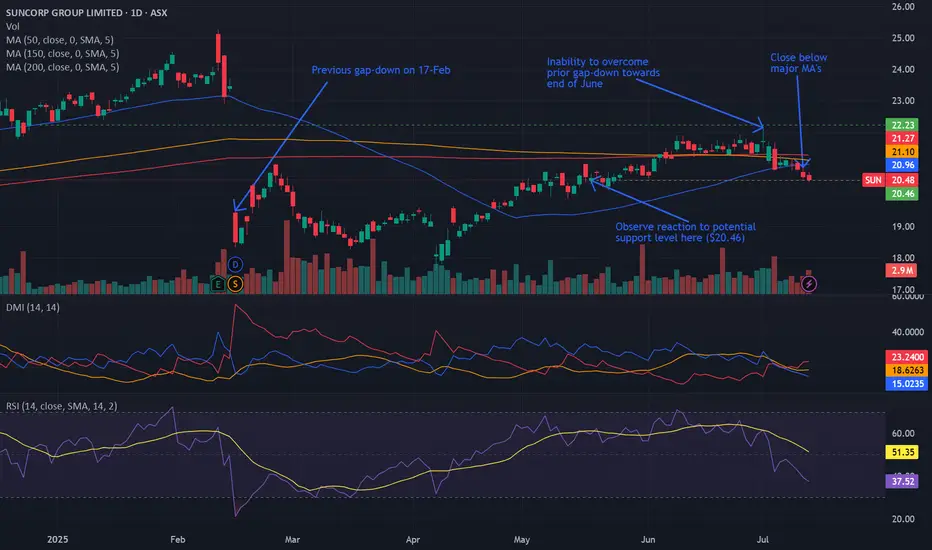
Bearish potential detected for SUNEntry conditions:
(i) lower share price for ASX:SUN along with swing of DMI indicator towards bearishness and RSI downwards, and
(ii) observing market reaction around the share price of $20.46 (open of 19th May).
Stop loss for the trade would be:
(i) above the potential prior resistance of $21.36 from the open of 5th June, or
(i) above the high of the recent swing high once the trade is activated (currently $22.14 from the high of 1st July), depending on risk tolerance.
Sun Token Prepares Major Rise · No ResistanceSun Token (SUN) has been rising. It has been rising short-term, long-term and at all times. It has been green now seven weeks and I am publishing because I see a major advance starting. Something like August 2024 or February-March 2024. Something like this.
SUNUSDT hit bottom November 2022 and it has been growing since. The main low happened November 2022, then August 2024 and finally April 2025. All higher lows of course and a very strong chart.
SUNUSDT is a strong buy and already moving up, but what is about to happen is when bullish momentum grows. Something like a surprise move because it is so strong.
That's what I see based on the many weeks of bullish consolidation. When prices are rising slowly, not one sell. Everything is always buying. This pattern always reveals a clear bullish bias and leads to a strong bullish breakout.
The action is happening above all moving average with strong oscillators also, that is, all the classic signals are present on this chart and already confirmed bullish. Let's see how it goes in the coming months but my money is that you will be seeing much higher prices, everything is about to grow really strong.
Namaste.

SUNUSDT Forming Potential BreakoutSUNUSDT is currently forming a promising potential breakout pattern that traders and investors should closely watch. The price action has shown a period of consolidation near key support zones, building a strong base for a potential explosive move. With volume gradually increasing and bulls taking control, the pair appears primed to break past resistance levels, signaling the beginning of a new uptrend phase.
The technical structure supports a bullish bias, with the potential to achieve a gain of 140% to 150%+ if the breakout materializes fully. Historical price behavior and recent candle formations suggest that SUNUSDT is gearing up for a rally, especially as it approaches a crucial trendline. If confirmed, this breakout could lead to a parabolic move, driven by renewed market interest and buying pressure.
SUN, being part of the TRON ecosystem, benefits from a solid foundation and increasing usage in DeFi applications. The token has seen growing investor interest, further fueling positive sentiment and long-term potential. The fundamentals are aligning well with the current technical outlook, providing additional confidence to bullish traders eyeing high-reward setups.
Given the momentum and improving market dynamics, SUNUSDT has become a high-potential watchlist candidate for both swing traders and long-term investors. A confirmed breakout above the current range could open the door to significant upside gains.
✅ Show your support by hitting the like button and
✅ Leaving a comment below! (What is You opinion about this Coin)
Your feedback and engagement keep me inspired to share more insightful market analysis with you!
Bearish Head and Shoulders Pattern Confirmed 🚨 NYSE:SUN
Bearish Head and Shoulders Pattern Confirmed 🚨
NYSE:SUN
has formed a bearish head and shoulders pattern and has been rejected from the neckline. The target for this bearish move is the green line level.
📈 Technical Overview:
Pattern: Bearish Head and Shoulders
Neckline: Rejection confirmation
🎯 Target: Green line level.

SUN Rebuy Setup (12H)It is one of the assets owned by the creator of TRON.
It appears to be completing a large triangle and may move upward from the green zone to complete wave E.
The target could be the red box.
A daily candle closing below the invalidation level will invalidate this analysis.
For risk management, please don't forget stop loss and capital management
Comment if you have any questions
Thank You

SUNUSDT 5DSUN ~ 5D Analysis
#SUN Trading is very high risk. Buy from here if you have a Conviction on this coin with a short -term target of at least 15%+.

TRX Perfect Bat Harmonic, Complex Correction, Double BottomTRX has created several simultaneous buy signals here. First we have the perfect bat harmonic, then we have wisemen on multiple timeframes, in a grey zone on the 4hr, perfect double bottom breaking all lows expect the final low, short-term momentum divergences, and a solid diametric count with at least 5 of 7 waves being time similar.
All of these signs are pointing to a bottom forming right now, meaning the lows should not be violated and TRX will go to all time highs from here. If we do make new lows it is probably a good idea to stop and reverse, and look for a new potential bottom. For now, all signs are pointing up, especially the longer-term count which has us beginning a supercycle this quarter.

Sun Token ($SUN): Strategic Entry into DeFi Ecosystem TokenI spend time researching and finding the best entries and setups, so make sure to boost and follow for more.
Sun Token ( NYSE:SUN ): Strategic Entry into DeFi Ecosystem Token
Sun Token (SUN) is a crypto in the CRYPTO market. The price is 0.02420828 USD currently with a change of -0.00058 (-0.02359%) from the previous close. The intraday high is 0.02517523 USD and the intraday low is 0.02232376 USD.
Trade Setup:
- Entry Price: $0.02197
- Stop-Loss: $0.00692
- Take-Profit Targets:
- TP1: $0.05232
- TP2: $0.08906
Fundamental Analysis:
Sun Token ( NYSE:SUN ) is integral to the TRON blockchain's decentralized finance (DeFi) ecosystem, facilitating governance and incentivization within the platform. Its role in promoting DeFi activities on TRON has garnered attention from investors seeking exposure to this growing sector.
Technical Analysis:
- Current Price: $0.02420828
- Moving Averages:
- 50-Day SMA: $0.02350000
- 200-Day SMA: $0.02200000
- Relative Strength Index (RSI): Currently at 55, indicating neutral momentum.
- Support and Resistance Levels:
- Support: $0.02250000
- Resistance: $0.02550000
Market Sentiment:
The DeFi sector continues to expand, with NYSE:SUN playing a pivotal role in TRON's ecosystem. Its integration into various DeFi protocols enhances its utility and appeal among investors.
Risk Management:
Implementing a stop-loss at $0.00692 helps mitigate potential losses, while the take-profit targets at $0.05232 and $0.08906 offer favorable risk-reward ratios. Given the token's volatility, strict adherence to these levels is crucial.
When the Market’s Call, We Stand Tall. Bull or Bear, Just Ride the Wave!
Disclaimer: This analysis is for informational purposes only and does not constitute financial advice. Traders should conduct their own due diligence before making investment decisions.

$SUN sun just signaled a break out of falling channelSET:SUN has been on a down trend for Months!
Current Price: 0.020
Price action has continued in it's falling Channel and recently just broke slightly out of it!
Expecting Price Action to continue upwards.
#SUN Targets: 0.024, 0.032, 0.041
This Idea Invalidates under 0.0189

TRON is the leading large altcoin this cycle!!TRX was especially strong this bear market. It was able to steady itself from falling too far. Similar more to Bitcoin then other alts like Solana. TRX fell around 74% in the bear market like BTC. SOL fell more like 94%.
TRX now 150% above old highs and SOL below old highs.
This is not to take anything away from SOL but comparing TRX to the other strongest alt this cycle. I suspect SOL might end up following TRX in a TRX like breakout from its old 2021 highs.
TRX has been able to capture a key part of the crypto market in being a chain for stablecoin transfers and is trying to expand into more typical defi areas.

TRX Surging: Sun’s $6.2M Banana Purchase Sparks Market BuzzJustin Sun Buys "Comedian" for $6.2M
In a move that blends art, memes, and crypto culture, Justin Sun, the founder of TRON, has acquired Maurizio Cattelan’s iconic artwork, *Comedian*, at a Sotheby’s auction for $6.2 million. The infamous banana duct-taped to a wall has sparked debates in both the art and cryptocurrency communities. Sun described the artwork as a “cultural phenomenon” and plans to honor its quirky legacy by eating the banana 🍌 in the coming days.
This purchase, according to Sun, symbolizes a bridge between traditional art and the digital revolution, showcasing TRON’s innovative spirit and cultural relevance.
TRX: Riding the Momentum
The news of this high-profile purchase appears to have given CRYPTOCAP:TRX a boost in the market. The token is up 2.76%, trading within a bullish channel. The technical indicators point to a strong upward momentum:
- RSI: At 69, TRX is edging toward the overbought zone, signaling strong buying pressure.
- Chart Pattern: A bullish engulfing pattern suggests continued upward movement.
- Moving Averages: TRX is comfortably trading above key MAs, adding to the bullish sentiment.
A Stable Anchor in Volatile Waters*
Justin Sun’s strategic moves have helped CRYPTOCAP:TRX maintain stability amid market fluctuations. By aligning the token with headline-grabbing cultural events, Sun ensures TRON remains relevant and appealing to investors.
As CRYPTOCAP:TRX continues to trade within a stabilized threshold, it seems poised to attract more attention from both crypto enthusiasts and art lovers. The innovative combination of art and blockchain could lead to more institutional interest in the token.
Final Thoughts
Whether it’s a $6.2M banana or blockchain innovation, Justin Sun knows how to keep the spotlight on TRON. With CRYPTOCAP:TRX maintaining a strong technical position and benefiting from renewed attention, the token could see further gains in the coming weeks.
Will the banana become the spark for TRON’s next big rally? Stay tuned.

Is $SUNDOG the Next Big Thing? Price, Volume & Market PotentialIntroduction
In the rapidly evolving cryptocurrency space, each blockchain seems to have its own iconic tokens that capture the attention of both investors and enthusiasts alike. For the Tron blockchain, this token is Sundog ($SUNDOG) – a project that has gained traction as the “biggest dog meme” on Tron, bringing “sunshine, fun, and love” to the network. With an impressive rise in trading volume, price increases, and potential for further gains, $SUNDOG presents an intriguing opportunity for investors, especially given its technical and fundamental performance. Here’s an in-depth look at what makes $SUNDOG stand out in the crypto space.
Market Activity and Volume
Sundog ($SUNDOG) has shown robust market activity, with a recent 24-hour trading volume of $143,973,605, marking a 25.4% increase. This rise suggests growing interest in the token, especially on popular exchanges like Bybit, where the SUNDOG/USDT pair holds a trading volume of $65,349,913. Other major platforms like Gate.io and Bitget also support $SUNDOG trading, expanding its accessibility for a wider audience. This upward trend in trading volume reflects increasing liquidity and market interest, which can be a positive indicator for price stability and future growth.
Market Capitalization and Ranking
With a current market cap of $181,451,843, $SUNDOG ranks #353 on CoinGecko, signaling solid adoption. The token's supply consists of 1 billion tradable tokens, giving it a considerable presence on the market. The fully diluted valuation (FDV) also stands at $181,451,843, assuming the entire supply of 1 billion tokens is circulating. This market cap positions $SUNDOG well within the mid-tier market segment, giving it both stability and room for growth as it gains further traction.
Historical Price Performance
Analyzing $SUNDOG’s price history provides further insights into its potential. The token hit an all-time high of $0.3775 on September 27, 2024, and is currently trading 52.6% lower than this peak, presenting a potential opportunity for investors to buy in at a discounted price. Its all-time low, recorded on August 16, 2024, was $0.03989, making its current price 348.53% higher. This performance showcases resilience and potential long-term growth, especially as it continues to attract a dedicated community on Tron.
Comparative Performance
When comparing $SUNDOG’s recent price movements against other cryptocurrencies, it’s clear that the token has momentum. In the last seven days alone, $SUNDOG has increased by 71.1%, outperforming the global cryptocurrency market average of 29.4%. However, it falls slightly short compared to the broader meme coin segment, which has surged 106.9% in the same timeframe. Nevertheless, this steady upward trend aligns with the overall meme coin resurgence and indicates strong community support and market interest.
Technical Analysis
$SUNDOG is currently trading within a rising trend channel, a pattern often associated with continued upward momentum. It’s up 1.59% at the time of writing, and its position relative to moving averages highlights its technical strength. The token is trading above its 50- and 100-day moving averages, indicating bullish sentiment in the mid-term. However, it remains slightly below the 200-day moving average, suggesting that a breakout above this level could signal the next phase of bullish movement.
Relative Strength Index (RSI)
The RSI for $SUNDOG is 60, which, while not overbought, indicates strong momentum. An RSI above 50 suggests that buyers currently dominate the market, while an RSI near 70 would indicate overbought conditions. At this level, $SUNDOG shows potential for further gains without being in an overextended zone.
Governance and Utility on Sunpump Launchpad
Beyond its meme status, $SUNDOG serves as the governance token for Sunpump.fun, a launchpad platform on the Tron network. This use case enhances $SUNDOG’s utility, as holders participate in decision-making and vote on project proposals, making the token an integral part of the ecosystem. This governance feature also aligns with broader DeFi principles, giving users more influence and fostering a robust community that can drive $SUNDOG’s future growth.
Conclusion
With a strong foundation, active trading, and bullish technical indicators, $SUNDOG appears poised for potential growth. Its status as a governance token on the Sunpump.fun launchpad strengthens its appeal, adding utility beyond typical meme coin speculation. As it continues to gain traction on Tron and maintain its popularity across top exchanges, $SUNDOG presents an attractive opportunity for investors.
In summary, $SUNDOG is a unique asset in the meme coin world, combining community appeal with technical promise. With its rising trend, supportive fundamentals, and dedicated community on Tron, $SUNDOG is well-positioned to shine as a standout meme token.

SUN/USDT Breakout Alert: Ready for 200-300% Gain!!Hey everyone!
If you're enjoying this analysis, please give it a thumbs up and follow!
SUN is showing strong potential! It has broken out of a bull flag structure on the daily time frame and is holding above the flag, signaling a bullish move. Buy now and accumulate more on dips for maximum gains!
Entry range: CMP and accumulate up to $0.0185
Target: 200-300% potential upside
Stop Loss (SL): $0.0158
What do you think of SUN's current price action? Are you spotting a bullish setup? Share your thoughts and analysis in the comments below!

#SUN/USDT#SUN
The price is moving in a descending channel on the 1-day frame and is holding it very well and is about to break out to the upside
We have a bounce from the lower limit of the channel at 0.01600
We have a bearish trend of the RSI that is about to break out which supports the upside
We have a trend to stabilize above the 100 moving average
Entry price 0.01750
First target 0.02680
Second target 0.03337
Third target 0.04370

SUNUSDT (SUN) Updated till 03-10-24SUNUSDT (SUN) Daily timeframe range. its a high risk and reward alt. it pumped hard now retracing back hard. if it breaks 0.01677 clean which may fall back to 0.01202 that can invalid the whole last pump. if it can hold 0.01677 it may get chance to cover up.

SUNDOG Ready to move..MEXC:SUNDOGUSDT
This idea has a long-term profit target.
All targets are indicated on the graph.
- Risk 1-3% on deposit
- R/R min 1/2
P.S (This is not an investment recommendation, this is my personal opinion.)

SUN/USDT: READY FOR A 100% MOVE!!Hey everyone!
If you're enjoying this analysis, a thumbs up and follow would be greatly appreciated!
SUN/USDT looks good here. It breaks out from the symmetrical triangle in a 4-hour time frame and is currently, being it. Buy some here and add more in the dip.
Entry range:- $0.025-$0.027
Target:- 80-100%
SL:- $0.024
What are your thoughts on SUN's current price action? Do you see a bullish pattern? Share your analysis in the comments below!

(SUN) Breaking Bull Flag to Downside -SHORT-BITRUE:SUNUSDT
SUN 24HR Chart
This one has a long way down. easy trade setup with main fib levels.
