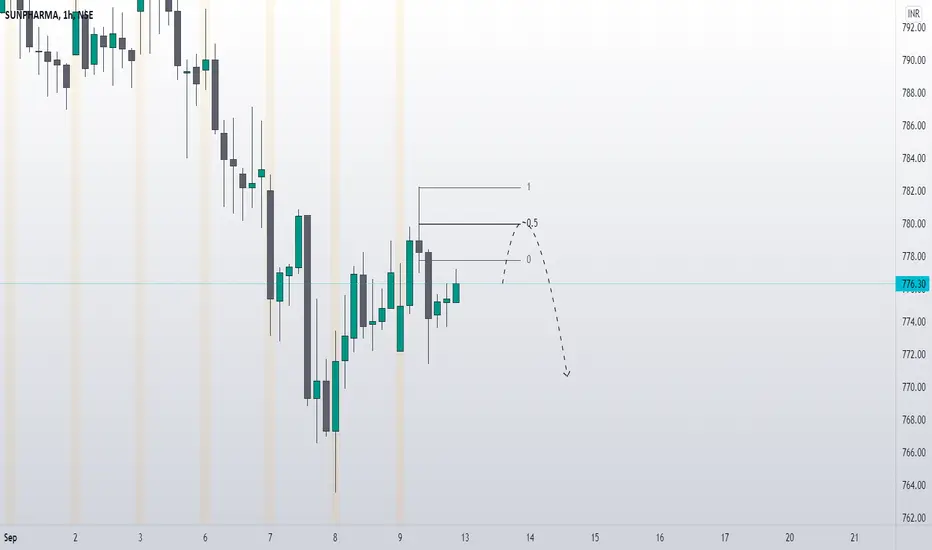
H&S followed by C&H in SUNPHARMANSE:SUNPHARMA has made inverse head and shoulders in 1H which didn't breakout yet and the right shoulder is now forming cup and handle formation. Chances are that once handle formation is complete, price may breakout on the upside. Could be a good short term swing trade. Keep an eye!
SUNPHARMA

Sunpharma Buy SUNPAHARMA Buy if market holds and sustain at that breakout level.
BUY Above: 815
SL: 770
TGT 849

Buy Sunpharma Target 🎯 850Buy Sunpharma Target 🎯 850 because it's recently given major breakout.We can see 10% upside .

Sunpharma Swing trade setup of pol and flag pattern.Sunpharma is forming pole and flag pattern and we get this pattern at trendline support , when we are entering at trendline support it can give us good risk to reward ratio,
we can enter as swing trade with today's bullish candle conformation.
SL of 745. for RR of 1:4 ,
analysis is for educational purpose only.. NSE:SUNPHARMA

SUNPHARMADisclaimer: All Videos/Information on this channel are for Education purpose only .They are not buy/Sell Recommendations . Please consult your financial Advisor before taking any trade or investment decisions.
#Sunpharma #NSE
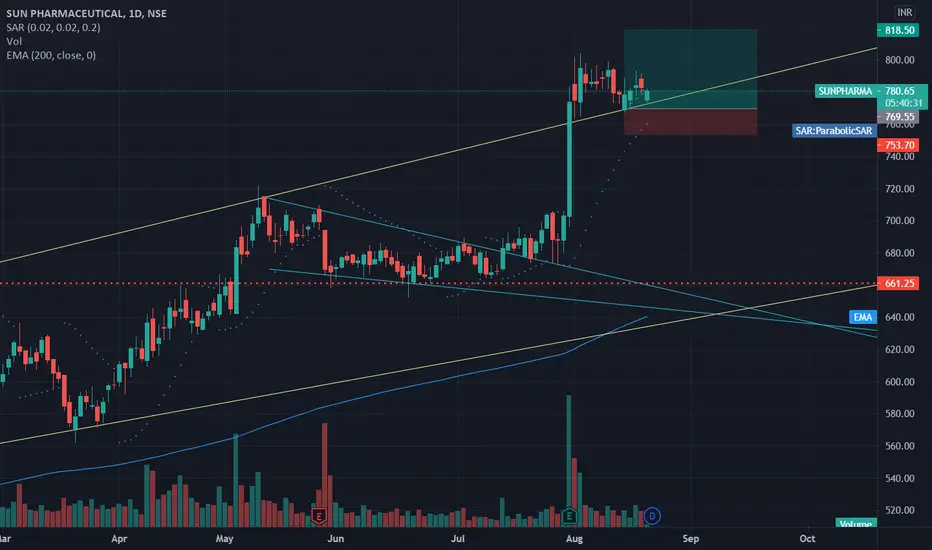
Sun Pharma Short Term ReversalThe stock has failed to breakout the upper trend line and might undergo a correction. Trade is supported by Resistance and Upper Trendline.
Risk Reward Ratio - 1:1
SL is placed above all time high & the upper trendline. The target is placed near lower bollinger band.
Daily PSAR has also signaled a reversal.

Sun Pharma Short Term BreakoutThe stock has broken out and retested the upper trendline and found support. Trade is supported by brokerage calls and Supports Nearby.
Risk Reward Ratio - 3:1
SL is placed below the support zone and the previously upper Trendline. The target is placed based on fundamentals.
SUNPHARMA LONG INTRADAY 18 AUG,2021Dear trader,
If u look at the chart of SUNPHARMA (analysis based intraday only) the SUNPHARMA Buy at 782 and Target at 794
Best Buy at 780.
Our Best Buy is based on high quality research and when the instrument reaches this level , it’s a jackpot trade.
Best Buy level might be executed or might not be executed.
The chart clearly indicates Bullish Trend you can also see the candle stick patters for more indepth analysis.
In Intraday most important thing is to enter and exit points.
Our signals are based on analytics, algorithms, mathematical derivatives.
Always be a responsible trader, kindly trade only when you have maximum opportunity in the market with minimum risk and with keynotes like data, analysis and proper strategies.
Kindly message us for strategies and analysis.

Sunpharma Flag formation NSE:SUNPHARMA
this can be a littil longer consolidation
buy only above 805 clsoing
SL 660
T 820, 845, 870, 900+

SUNPHARMA LONG INTRADAY 2 AUG,2021Dear trader,
If u look at the chart of SUNPHARMA (analysis based intraday only) the SUNPHARMA Buy at 770 and Target at 785
Best Buy at 768.
Our Best Buy is based on high quality research and when the instrument reaches this level , it’s a jackpot trade.
Best Buy level might be executed or might not be executed.
The chart clearly indicates Bullish Trend you can also see the candle stick patters for more indepth analysis.
In Intraday most important thing is to enter and exit points.
Our signals are based on analytics, algorithms, mathematical derivatives.
Always be a responsible trader, kindly trade only when you have maximum opportunity in the market with minimum risk and with keynotes like data, analysis and proper strategies.
Kindly message us for strategies and analysis.


Extremely Bullish pattern in Sunpharma Formed the inverted head and shoulder pattern (which is rare), and it will definitely boom tomorrow.

Sun pharma taken support for next long moveSun pharma taken support for next long move, 200 ema support done RSI is strong taken support on 40 daily TF, dragon fly doji at 200EMA and previous swinglow candle (daily time frame)

SPARC- Sun Pharma AdvBuy SPARC cmp 248 buy if it comes down till 210 levels sl 175 target 413 #syed.ibrahim27

Falling Broadening Wedge Pattern In SUNPHARMAStock Name: SUNPHARMA
Pattern Name: Falling Broadening Wedge Pattern
Current Price: 679.60
Projected Pattern Target: 690+

INTRADAY & POSITIOAL STOCK FUTURE CALL BUY SUNPHARMA FUT @ 673 INTRADAY & POSITIOAL STOCK FUTURE CALL
BUY SUNPHARMA FUT @ 673 - 678
STOP LOSS - 660CLBS
TARGET - 700 715 730 ++

SUNPHARMA FUTURE LOOKOUTSunpharma today for the 10th consecutive session has failed to sustain above 700. With a completion of the 5th wave at .618 of the fibo and multiple failed attempts Sunpharma is ready for a short.
My view short for risky traders @cmp with a Sl of 720 and targets of either the support zone marked (trend and horizontal line) or you're appetite.
Safe traders can short below 685 with SL 705-720 and same target zones.

SUNPHARMA LONG INTRADAY 10 MAY, 2021Dear trader,
If u look at the chart of SUNPHARMA (analysis based intraday only) the SUNPHARMA Buy at 696 and Target at 706
Best Buy at 692.
Our Best Buy is based on high quality research and when the instrument reaches this level , it’s a jackpot trade.
Best Buy level might be executed or might not be executed.
The chart clearly indicates Bullish Trend you can also see the candle stick patters for more indepth analysis.
In Intraday most important thing is to enter and exit points.
Our signals are based on analytics, algorithms, mathematical derivatives.
Always be a responsible trader, kindly trade only when you have maximum opportunity in the market with minimum risk and with keynotes like data, analysis and proper strategies.
Kindly message us for strategies and analysis.

SUNPHARMA Multi year breakout#sunpharma
Covid cases increasing and breakout in pharma is a good option to enter.

LONG OPPORTUNITYsunpharma weekly timeframe looks highly bullish
with 25 points sl and 75-95 points target we have good rr

SUNPHARMA - Bullish H&S - Weekly - Swing TradeThe above analysis is done purely based on Price action and Popular chart analysis.
The analysis is done on weekly time frame and hence it may take price a couple of weeks to few months to reach the target.
Analysis and trade setup has been shared in the image itself.
Don't run after the price, and always trade based on your study.
Maintain proper risk management.
Also check out my other ideas to know how even a beginner can earn money from stock market with help of simple price action.
Feel free to comment or message me regarding this analysis or to know more about chart study and learning price action.
