SUNPHARMA Mid-term swing.SUNPHARMA has broken it's important resistance and ready make a new all time high.
Next report date
—
Report period
—
EPS estimate
—
Revenue estimate
—
39.90INR
95.76 BINR
478.63 BINR
1.02 B
About SUN PHARMACEUTICAL
Sector
CEO
Dilip Shantilal Shanghvi
Headquarters
Mumbai
Website
Employees (FY)
25.89 K
Founded
1983
ISIN
INE044A01036
FIGI
BBG000BV5H87
Sun Pharmaceutical Industries Ltd. engages in manufacturing, developing, and marketing of pharmaceuticals products. It offers tablets, capsules, injectable, inhalers, ointments, creams, and liquids. The company was founded by Dilip Shantilal Shanghvi in 1983 and is headquartered in Mumbai, India.


SUN PHARMA S/R Support and Resistance Levels: In technical analysis, support and resistance levels are significant price levels where buying or selling interest tends to be strong. They are identified based on previous price levels where the price has shown a tendency to reverse or find support.
Support levels ar

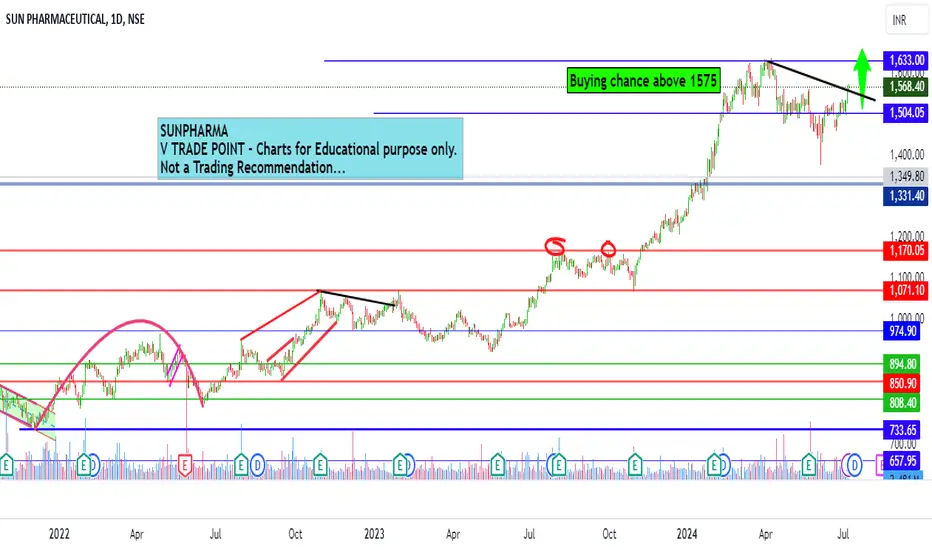
Sunpharma Limited Intraday level for 8th July #SUNPHARMA Sunpharma Limited Intraday level for 8th July #SUNPHARMA
Buying opportunity above 1575
Support area 1550. Below ignoring buying opportunity
Charts for Educational purposes only.
Please follow strict stop loss and risk reward if you follow the level.
Thanks,
V Trade Point
Sun Pharmaceutical IN Inverse Head and Shoulder PatternSun Pharmaceutical NSE:SUNPHARMA Price breaks out of the Inverse Head and Shoulder Pattern. The First Target would be 1610 and you can extend till 1705(Based on how much risk you are ready to take using GTT)

SUN PHARMA S/R for 8/7/24Support and Resistance Levels: In technical analysis, support and resistance levels are significant price levels where buying or selling interest tends to be strong. They are identified based on previous price levels where the price has shown a tendency to reverse or find support.
Support levels ar

Sun Pharma Intraday level for 5th July #SUNPHARMA Sun Pharma Intraday level for 5th July #SUNPHARMA
Buying opportunity above 1565
Stop Loss area 1550
Charts for Educational purposes only.
Please follow strict stop loss and risk reward if you follow the level.
Thanks,
V Trade Point

SunPharma-Strong Buy-Swing- End of downward range? NSE:SUNPHARMA
03.07.2024
Buy above 1539
Target:1627
Stop Loss:1494
Risk-Reward: 1:2
01. Inside candle breakout in daily & Weekly
02. After big uptrend, price is getting consolidated
in downward range by creating LL & LH
03. Price has rejected & found fake breakout at 200 EMA level and 5

Sun pharmaceuticals Trading Strategy If it can sustain above this downtrend parallel channel ( above 1525 )
Target: 1639+
If goes below 1480 on daily chart
Target : 1361

SUNPHARMA Breakout Sunpharma has finally broken out of the resistance band that it was trading in with great volume and price is above the VWAP. Buy with a stop loss of 1493

See all ideas
An aggregate view of professional's ratings.
Trade directly on the supercharts through our supported, fully-verified and user-reviewed brokers.


Curated watchlists where SUNPHARMA is featured.

Frequently Asked Questions
The current price of SUNPHARMA is 1,714.25 INR — it has increased by 2.91% in the past 24 hours. Watch SUN PHARMACEUTICAL stock price performance more closely on the chart.
Depending on the exchange, the stock ticker may vary. For instance, on NSE exchange SUN PHARMACEUTICAL stocks are traded under the ticker SUNPHARMA.
SUNPHARMA stock has risen by 8.18% compared to the previous week, the month change is a 14.13% rise, over the last year SUN PHARMACEUTICAL has showed a 51.97% increase.
We've gathered analysts' opinions on SUN PHARMACEUTICAL future price: according to them, SUNPHARMA price has a max estimate of 1,830.00 INR and a min estimate of 1,350.00 INR. Watch SUNPHARMA chart and read a more detailed SUN PHARMACEUTICAL stock forecast: see what analysts think of SUN PHARMACEUTICAL and suggest that you do with its stocks.
SUNPHARMA reached its all-time high on Apr 5, 2024 with the price of 1,638.85 INR, and its all-time low was 2.25 INR and was reached on Jan 1, 1999. View more price dynamics on SUNPHARMA chart.
See other stocks reaching their highest and lowest prices.
See other stocks reaching their highest and lowest prices.
SUNPHARMA stock is 3.53% volatile and has beta coefficient of 0.50. Track SUN PHARMACEUTICAL stock price on the chart and check out the list of the most volatile stocks — is SUN PHARMACEUTICAL there?
Today SUN PHARMACEUTICAL has the market capitalization of 4.00 T, it has increased by 0.55% over the last week.
Yes, you can track SUN PHARMACEUTICAL financials in yearly and quarterly reports right on TradingView.
SUN PHARMACEUTICAL is going to release the next earnings report on Aug 1, 2024. Keep track of upcoming events with our Earnings Calendar.
SUNPHARMA earnings for the last quarter are 11.50 INR per share, whereas the estimation was 9.96 INR resulting in a 15.44% surprise. The estimated earnings for the next quarter are 10.51 INR per share. See more details about SUN PHARMACEUTICAL earnings.
SUN PHARMACEUTICAL revenue for the last quarter amounts to 119.83 B INR, despite the estimated figure of 122.26 B INR. In the next quarter, revenue is expected to reach 128.77 B INR.
SUNPHARMA net income for the last quarter is 26.55 B INR, while the quarter before that showed 25.24 B INR of net income which accounts for 5.18% change. Track more SUN PHARMACEUTICAL financial stats to get the full picture.
SUN PHARMACEUTICAL dividend yield was 0.83% in 2023, and payout ratio reached 33.82%. The year before the numbers were 1.17% and 32.56% correspondingly. See high-dividend stocks and find more opportunities for your portfolio.
As of Jul 27, 2024, the company has 25.89 K employees. See our rating of the largest employees — is SUN PHARMACEUTICAL on this list?
EBITDA measures a company's operating performance, its growth signifies an improvement in the efficiency of a company. SUN PHARMACEUTICAL EBITDA is 129.87 B INR, and current EBITDA margin is 26.12%. See more stats in SUN PHARMACEUTICAL financial statements.
Like other stocks, SUNPHARMA shares are traded on stock exchanges, e.g. Nasdaq, Nyse, Euronext, and the easiest way to buy them is through an online stock broker. To do this, you need to open an account and follow a broker's procedures, then start trading. You can trade SUN PHARMACEUTICAL stock right from TradingView charts — choose your broker and connect to your account.
Investing in stocks requires a comprehensive research: you should carefully study all the available data, e.g. company's financials, related news, and its technical analysis. So SUN PHARMACEUTICAL technincal analysis shows the strong buy rating today, and its 1 week rating is strong buy. Since market conditions are prone to changes, it's worth looking a bit further into the future — according to the 1 month rating SUN PHARMACEUTICAL stock shows the strong buy signal. See more of SUN PHARMACEUTICAL technicals for a more comprehensive analysis.
If you're still not sure, try looking for inspiration in our curated watchlists.
If you're still not sure, try looking for inspiration in our curated watchlists.