EURUSD - SellEntered this earlier on the 1min TF
Target will be the first Order Block which is 21:RR.
The reason I am targeting here is the 4H order flow is still bullish. So if we can hit the target I close 50% of the position and let the rest ride and manage accordingly to price.
Lets see how it plays out
Supply_and_demand

GBPUSD 4H MAJOR REVERSAL SETUP – WATCH FOR THE BREAK!Hey There;
The Head & Shoulders (H&S) pattern in GBPUSD is becoming more defined, approaching a critical neckline level. If a breakout occurs, it could trigger a strong downward move, pushing the price toward new support levels.
Right now, sellers are gaining strength while buyers attempt to defend key support zones. A confirmed close below the neckline could accelerate the sell-off.
📌 If the breakout happens, I’ll share target levels with you—stay tuned for updates
I meticulously prepare these analyses for you, and I sincerely appreciate your support through likes. Every like from you is my biggest motivation to continue sharing my analyses.
I’m truly grateful for each of you—love to all my followers💙💙💙

DXY 4H Breakout? Bulls Eye Momentum Shift!Hey There;
The U.S. Dollar Index (DXY) appears to have reached a critical turning point from a technical analysis perspective. According to Elliott Wave Theory, following a five-wave downtrend, the AB corrective wave has been completed, and a bullish movement towards the C wave is emerging. This scenario could signal a transition from a bearish market to a bullish one.
Technical Outlook:
- A move towards 104.460 on the DXY may indicate that the market is entering a strong recovery phase.
- The completion of the AB corrective wave suggests that buyers are stepping in, driving upward momentum in price action.
- The C wave typically retraces a portion of the prior decline, creating potential for a higher price level.
Macroeconomic Factors:
- U.S. monetary policy and inflation data remain key determinants of the dollar index’s trajectory.
- Increased global risk appetite may bolster the dollar’s appeal as a safe-haven asset.
- U.S. Treasury yields could provide additional support for DXY’s upward movement.
If DXY successfully reaches 104.460, this could confirm a shift into a bullish trend. However, the strength and sustainability of the C wave will depend on supportive volume and momentum indicators. The interplay between technical and fundamental factors could drive a solid recovery in the dollar index.
Should this scenario unfold, it may mark the beginning of a renewed period of dollar strength against global currencies. However, market dynamics and macroeconomic developments must be monitored closely to validate this outlook.
Guys, every single like from you is my biggest source of motivation when it comes to sharing my analysis.
A huge thank you to everyone who supports me with their likes!

EURUSD Possible AnalysisEURUSD has been overall bullish with retracemets here and there. It has recently made a deep retracement that could be mistaken for a shift in market structure, while in reality it's just liquidity accumulation. Price recently shifted structure back to bullish on 4h timeframe where it preceded to break more structure before retracing to sweep liquidity below a low and tap a fvg in the process. It preceded to shift structure on the 1h time frame, breaking with a huge bullish candle symbolizing increase in bullish momentum. It is currently retracing towards an orderblock that was responsible for the break and could possibly retest it and fill the imbalance above it before it continues its bullish move up to take out the latest weak high.

XAUUSD | 30M | SELL NOW Hello, everyone,
My gold target level is 3,250,0
My friends, every single like from you is my biggest motivation to share my analysis.
Thank you very much to everyone who supports me with likes.

CL Analysis – May 28, 2025Currently, I believe Crude Oil (CL) is trading within a well-defined range. My strategy is clear:
🔴 Sell only at the red supply zone above, but only after confirmed seller reactions backed by order flow.
🟢 Buy only at the green demand zone below, once buyer strength is confirmed through price action and order flow.
No trades in between — I’m staying patient and letting the market come to my levels.

EURUSD (STOP LOSSES SUPPLY + CONFIRMATION ON LTF)1) On top we have MSS + 705 Fib level.
2) Now price grab ST from demand and we can wait for confirmation on LFT.
3) NON mitigate Demand zone is OB 1H, i think price come back because 0.5 is still valid.
Entry: confirmation on LTF in POI
Target: First problem zone is OB 4H
Have a profitable day and don't forget to subscribe for more updates!
If you like this idea drop a like, leave a comment.

EURCHF SHORT (OB 4H + BB + OTE + Volume)Hello traders!
We have supply = OB 4H + OTE + BB
Target: ST Of Demand
Now we can expect reversal on LTF from 705 fib level + Mitigation Sell to Buy Action.
Have a profitable day and don't forget to subscribe for more updates!
If you like this idea drop a like, leave a comment.

NAS100 (BOS 1H + SUPPLY + OTE)Hello traders!
Now reaction from 705 fib level, Supply = OB 4H. But we can expect mitigation supply and confirmation on LTF. We have BOS on 1H.
Target: till 0.5 global fib level.
P.S: We have also on top OB 2H + OTE
Have a profitable day and don't forget to subscribe for more updates!
If you like this idea drop a like, leave a comment.

AUDUSDIn daily time frame its in down trend and in last swing it created strong demand zone so it will go to test it once just captureinig that move
in 1 hr its making Lower high and taking resistance at fib 0.6 level

6B Swing Short Swing short, COT - Valuation - Supply and Demand.
Been waiting a long time to short the pound..


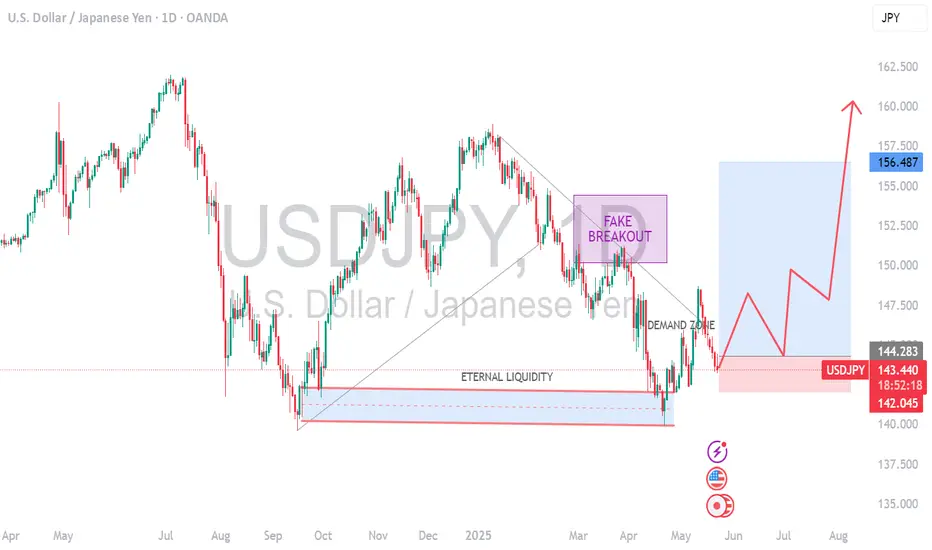
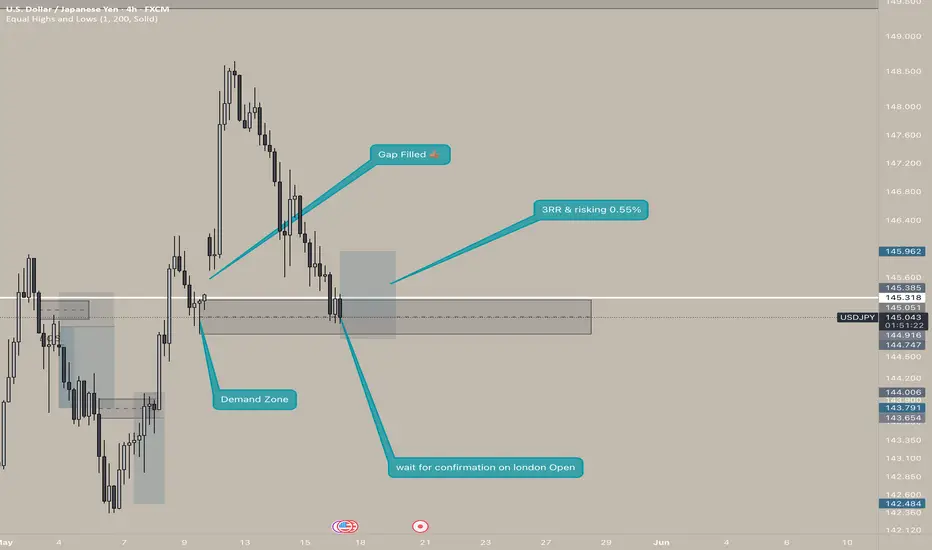
USDJPY- IS it a beginning of major bulish trend nowthe USD/JPY pair is currently in a major bullish trend, driven by several key factors:
1. Interest Rate Differentials: The U.S. Federal Reserve maintains higher interest rates compared to the Bank of Japan, attracting capital flows into the U.S. dollar and away from the yen.
2. Dovish Bank of Japan: Despite global tightening, the BOJ remains cautious about raising rates or ending yield curve control, weakening the yen further.
3. Robust U.S. Economic Data: Strong economic indicators from the U.S. (such as inflation, jobs, and GDP growth) continue to support expectations of prolonged higher rates, boosting the dollar.
BTCUSD / BITCOIN | 4H | WAIT BREAKOUT Good morning, my friends
Bitcoin support level is $96,900.00, while the resistance level stands at $104,600.00.
Right now, I'm just waiting for an upward breakout. Once that happens, I'll provide a clear target.
Don't forget to hit the like button so you don't miss any updates on this analysis.
My dear friends, your likes are the biggest motivation for me to keep sharing my analyses. I truly appreciate everyone who supports my work with their likes—thank you so much!
With respect and love.

AUDJPY at Key Resistance Level: Will it Drop To 92.850?OANDA:AUDJPY is approaching a key resistance level that has previously acted as a strong barrier, triggering bearish momentum in the past. Given its historical significance, how price reacts here could set the tone for the next move.
If bearish signals emerge, such as rejection wicks, bearish candlestick patterns, or signs of weakening bullish pressure, I anticipate a move toward the 92.850 level. However, a clear breakout above this resistance could challenge the bearish outlook and open the door for further upside. It's a pivotal area where price action will likely provide clearer clues on the next direction.
Just my take on support and resistance zones, not financial advice. Always confirm your setups and trade with a proper risk management.
Best of luck!

EGX30 Trend Line AnalysisEGX30 stock is currently falling but rebounded at the support line 31,365.902. In case of taking an upward trend it is expected to breach the resistance line at 31,543.291, then reach the resistance line at 31,681.261. In case of falling it's expected to break the 1st support line 31,316.627 then the 2nd support line 31,227.932, then the 3rd support line 31,198.367

GBP/JPY Buy OpportunityA potential buy signal is forming on GBP/JPY due to a break above a key supply zone. This breakout indicates strong bullish momentum, suggesting further upside potential.

EURJPY Analysis: Range Bounces & BreakoutHello traders!
EURJPY is in a daily range and is offering three trading scenarios.
The first scenario suggests the pair may react bearishly from the currently approached zone, setting up a bounce opportunity that could drive price lower toward the 162.130 area.
The second scenario anticipates a bounce toward the 158.400 area, if price reaches the support zone of the range.
The third scenario anticipates a breakout above the resistance zone, followed by a retest, which could present a strong opportunity for continuation toward the 169.300 area.
Discretionary Trading: Where Experience Becomes the Edge
Discretionary trading is all about making decisions based on what you see, what you feel, and what you've learned through experience. Unlike systematic strategies that rely on fixed rules or algorithms, discretionary traders use their judgment to read the market in real time. It's a skill that can't be rushed, because it's built on screen time, pattern recognition, and the ability to stay calm under pressure.
There's no shortcut here. You need to see enough market conditions, wins, and losses to build that intuition—the kind that tells you when to pull the trigger or sit on your hands. Charts might look the same, but context changes everything, and that's something only experience can teach you.
At the end of the day, discretionary trading is an art, refined over time, sharpened through mistakes, and driven by instinct. It's not for everyone, but for those who've put in the work, it can be a powerful way to trade.

EURNZD Analysis: Bounce & BreakoutHello traders!
EURNZD is in a 1h range and is offering two trading scenarios.
The first scenario suggests the pair may react bearishly from the resistance zone, setting up a bounce opportunity that could drive price lower toward the 1.90000 area.
The second scenario anticipates a breakout above the resistance zone, followed by a retest, which could present a strong opportunity for continuation toward the 1.92000 area.
Discretionary Trading: Where Experience Becomes the Edge
Discretionary trading is all about making decisions based on what you see, what you feel, and what you've learned through experience. Unlike systematic strategies that rely on fixed rules or algorithms, discretionary traders use their judgment to read the market in real time. It's a skill that can't be rushed, because it's built on screen time, pattern recognition, and the ability to stay calm under pressure.
There's no shortcut here. You need to see enough market conditions, wins, and losses to build that intuition—the kind that tells you when to pull the trigger or sit on your hands. Charts might look the same, but context changes everything, and that's something only experience can teach you.
At the end of the day, discretionary trading is an art, refined over time, sharpened through mistakes, and driven by instinct. It's not for everyone, but for those who've put in the work, it can be a powerful way to trade.

SALIK (DFM) BOS confirmed the bulls are back in charge### 🌀 **Elliott Wave Structure**
* The stock completed a textbook 5-wave impulse (1 → 5).
* Followed by a complex **ABCDE correction**, ending with a liquidity sweep on Wave (E).
* Current price action is a **bullish breakout** — likely the start of a **new impulsive cycle**.
### 📐 **Fibonacci Extension Target**
* **7.35 = 100% Fib extension** of previous impulse (Wave 1–5), projected from Wave (E).
## 🎯 **Trading Setup**
| **Entry** | Market @ 5.90 |
| **Stop Loss** | Below 4.75 (beneath main OB) |
| **Take Profit** | 7.35 (100% Fib extension ) |
| **R/R Ratio** | \~1:3.6 |
---
> “SALIK finally ripped through resistance like butter. BOS confirmed the bulls are back in charge. That 7.35 target? It’s not just a guess — it’s fib math.”
> *“Fibonacci is the map. Price is the vehicle. Volume is the fuel.”*
---
### ⚠️ **Disclaimer**
> This is not financial advice. For educational purposes only. Always manage risk and use stop losses. Past performance doesn’t guarantee future results.


EURGBP Analysis: Two Daily POIsHello traders!
EURGBP is offering two trading scenarios on the daily timeframe.
The first scenario suggests the pair may react bullishly from the next zone, setting up a bounce opportunity that could drive price higher toward the 0.84400 area.
The second scenario anticipates a bounce toward the 0.83800 area, where a mean reversion setup may come into play (if buyers step in and price action confirms bullish intent near that support).
Discretionary Trading: Where Experience Becomes the Edge
Discretionary trading is all about making decisions based on what you see, what you feel, and what you've learned through experience. Unlike systematic strategies that rely on fixed rules or algorithms, discretionary traders use their judgment to read the market in real time. It's a skill that can't be rushed, because it's built on screen time, pattern recognition, and the ability to stay calm under pressure.
There's no shortcut here. You need to see enough market conditions, wins, and losses to build that intuition—the kind that tells you when to pull the trigger or sit on your hands. Charts might look the same, but context changes everything, and that's something only experience can teach you.
At the end of the day, discretionary trading is an art, refined over time, sharpened through mistakes, and driven by instinct. It's not for everyone, but for those who've put in the work, it can be a powerful way to trade.
