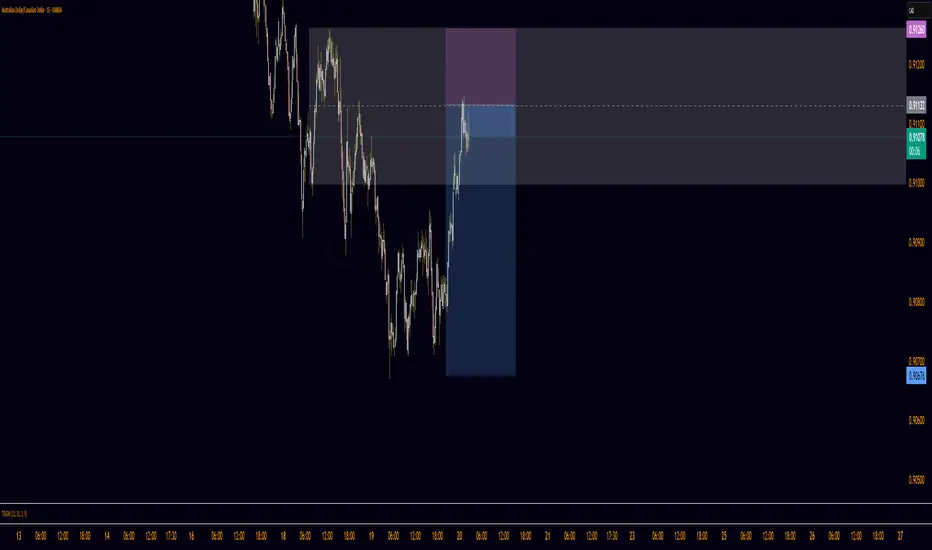
4H Supply & Demand | Going Long, BabyHere we have a diamond reversal pattern on the 4H.
Now that it broke out, I'm looking for a liquidity zone to retrace to and then go long for just 60 ticks on the 5m chart. Follow for more value.
- Mr. Trader-CL
Supply_and_demand

Market Hunter: NASDAQ-NAS100 Sell OpportunityMy friends, Good morning!☀️
For US100-NAS100, I will open a SELL position between 24,988 and 25,243, targeting 23,843.📊
My friends, I share these analyses thanks to every single like I receive from you.
Your likes increase my motivation and make me want to support you in this way.🙏
I sincerely thank all my friends who support me with their likes.❤️

XAUUSD WXAUUSD is in an uptrend and may retest the marked area. After that, the trend is likely to continue. Key levels are important to monitor to see how the market reacts from this point.

EURUSD — Sell Setup After Sweep at 1.15882Quick Summary
EURUSD is forming a bearish opportunity around 1.15882.
The plan: wait for a sweep of the candle at that level, confirm the rejection, and then sell.
A bearish setup is supported by the internal CHoCH on the 15m, and the strong push upward has left behind a liquidity void, which makes it a downside target.
Full Analysis
According to the current price action, EURUSD is setting up for a potential sell from 1.15882. The key condition here is not selling immediately, but waiting for a sweep of the candle at that level. Once the sweep occurs and the market shows a clear rejection, the sell entry becomes valid.
The reasoning behind this setup is aligned with the short-term structure:
On the 15-minute timeframe, the market printed an internal CHoCH, signaling early weakness and a potential shift in intraday direction.
The recent sharp move upward created a noticeable liquidity void. Price often seeks to rebalance these inefficiencies, making that void an attractive downside target once selling pressure begins.

USD/JPY – Bearish Flag Breakdown (25.11.2025)📝 Description 📌 Setup Overview FX:USDJPY
USD/JPY has completed a Bearish Flag on the M30 timeframe and price has now broken below the flag support with momentum.
The Ichimoku Cloud is acting as resistance, showing sellers stepping in again after a short pullback.
📉 Bias: Bearish continuation📍 Pattern: Bear Flag (Breakout confirmed)
🎯 Trading Plan
• Entry idea: After a clean breakout & retest confirmation below the flag base zone
• TP1: 156.055 (1st Support)
• TP2: 155.622 (2nd Support)
• SL suggestion: Above 157.000 (invalidates breakdown)
• RR potential: 1:2 — 1:3 depending on entry
🧠 Why this move makes sense
1️⃣ Price rejected Ichimoku cloud + structure resistance
2️⃣ USD weakness continues after recent pullback
3️⃣ JPY demand increases as risk sentiment cools ahead of key macro events
📌 What to expect
If price retests the flag support from below and rejects again, bearish momentum could accelerate toward 156.05 → 155.62.
💬 Your turn
Which target will hit first in your view — TP1 or TP2?
👇 Comment below — I reply to all comments.
🔖 SAVE this post so you don’t miss the trade update.
👍 LIKE if you want more Bear Flag & Triangle setups.
⚠ Disclaimer: For educational purposes only. Not financial advice. Trade based on your plan & risk management.
#USDJPY #forex #bearflag #priceaction #tradingview #technicalanalysis #chartanalysis #forexanalysis #ickycloud #supportandresistance #forextrading #marketstructure #smartmoney

Bitcoin - H1 Breakout Alert – Bulls Taking Control!BTC/USDT - Bitcoin has officially broken its descending trendline and completed a successful retest from the demand zone. This shift signals a potential momentum reversal, with buyers stepping in aggressively after weeks of corrective price action. BINANCE:BTCUSDT
🔍 Technical Overview
✔️ Clean trendline breakout on H1 timeframe
✔️ Strong retest at demand zone → buyers defended perfectly
✔️ Price now trading above the trendline, indicating bullish structure
✔️ First target: $95,000 (psychological level + key resistance)
✔️ Second target: $100,000 (major psychological level)
If bullish pressure continues, liquidity grabs above these zones could fuel an extended move.
📊 Fundamental Insight
Institutional interest rises, especially around accumulation zones
ETF inflows remain positive, boosting overall sentiment
#BTC #Bitcoin #BTCUSDT #Crypto #CryptoTrading #BitcoinAnalysis #TradingSetup #Breakout #TrendlineBreakout #PriceAction #TechnicalAnalysis #Binance #CryptoMarket #Bullish
💬 Support the Idea
If you found this analysis useful,
👉 Please LIKE 👍 and COMMENT 💬
Your support helps me share more setups daily!
⚠️ Disclaimer
This analysis is for educational purposes only.
Not financial advice. Always manage risk (1–2% per trade) and follow your trading plan.

GBP/JPY Technical OutlookMarket Bias:
Bullish bias with demand strength
Key Levels:
• Strong demand zone at lower timeframe support
• Resistance levels to monitor on higher timeframes
Reasoning:
The price shows bullish momentum supported by strong buyer interest and demand zones. Confirmation from lower timeframes will strengthen the case for upward movement. The demand from buyers creates potential for continuation higher.
Trade Idea:
Look for bullish entries upon confirmation on lower timeframes near the demand zones.
Potential Entry:
• After bullish confirmation on lower timeframes (e.g., bullish candle patterns, momentum) near demand zones

XAU/USD Intraday Plan | Gold Breaks Out — Can Buyers Hold?Gold broke out of the consolidation range yesterday, finally pushing above the 4098 level and extending into the 4142 resistance zone.
Price is now sitting above both the MA50 and MA200 — a constructive sign — but both moving averages remain flat, showing that momentum has not fully shifted yet.
If buyers want to build on this breakout, they need a clean hold above 4142. A confirmed break here would open the path toward 4198 → 4232.
If gold fails to clear 4142, we could see a pullback. First support sits at 4098, followed by 4052.
A deeper correction would bring us back into the Support Zone (4016–3968), with the HTF Support Zone (3921–3862) acting as the major safety net.
📌Key levels to watch:
Resistance:
4142
4198
4232
Support:
4098
4052
4016
3968
3921
3862
📰 Fundamental Focus:
Today brings the first batch of high-impact U.S. data for the week, including Core PPI, PPI, and Retail Sales — all key indicators of inflation and consumer strength. Traders should be prepared for sharper moves as the market reacts to inflation and consumer-spending data.

EUR/USD – Trade UpdateI have entered a long (buy) position on EUR/USD after an Inducement and a confirmed rejection. This setup now shows a strong entry signal, increasing the probability of a successful trade.

AUD/JPY – H4 - Rising Wedge Breakdown | Key Zones Targeted📝 Description:
The AUD/JPY pair is showing a clear Rising Wedge formation on the 4H timeframe, with three clean touches on the trendline—indicating weakening bullish momentum. Price has now broken below the lower trendline, suggesting increased probability of bearish continuation toward the next key zones. FX:AUDJPY
This setup highlights:
Rising Wedge pattern
Trendline break
Retest opportunity
Key support zones at 99.00 and 97.80
AUD fundamentals: driven by commodity demand, RBA policy, and risk sentiment
JPY fundamentals: influenced by BOJ stance, yields, and safe-haven flows
This analysis is ideal for traders monitoring price action, forex patterns, and high-probability setups on AUD/JPY.
Keep an eye on upcoming economic releases from RBA, BOJ, and US data, as they can influence risk sentiment and impact this pair heavily.
✅ Support this analysis with a
LIKE 👍 | COMMENT 💬 | FOLLOW 🔔
It helps a lot & keeps the ideas coming!
⚠️ Disclaimer: This analysis is for educational purposes only and does not constitute financial advice. Forex trading involves high risk. Trade only with capital you can afford to lose and always do your own research.

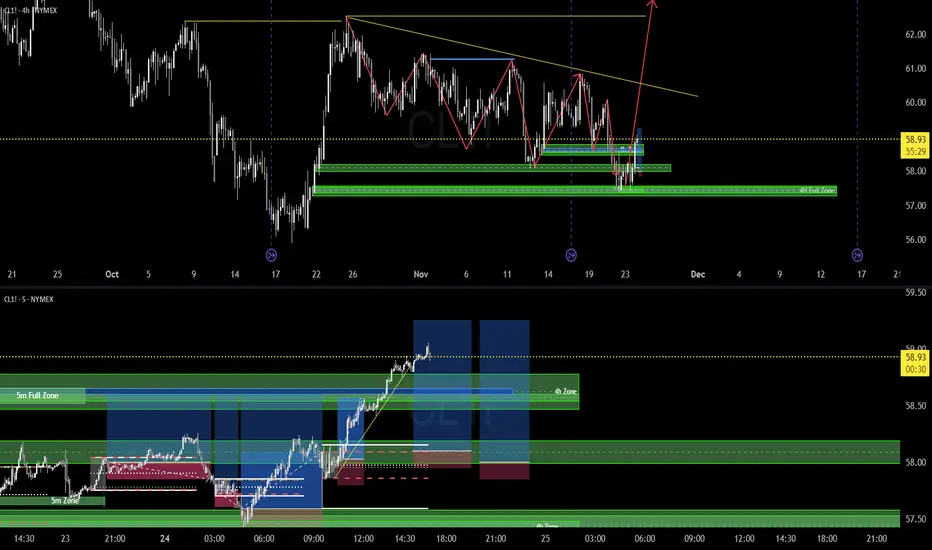
Confidence & Power | Supply & Demand Trading 4H/5m TimeframeOk, here it is for a 2nd chance.
Trendline is gonna get utterly swiped before we make a new high.
Based on 4H zones, I enter on the 5 minute chart.
- Mr. Trader-CL
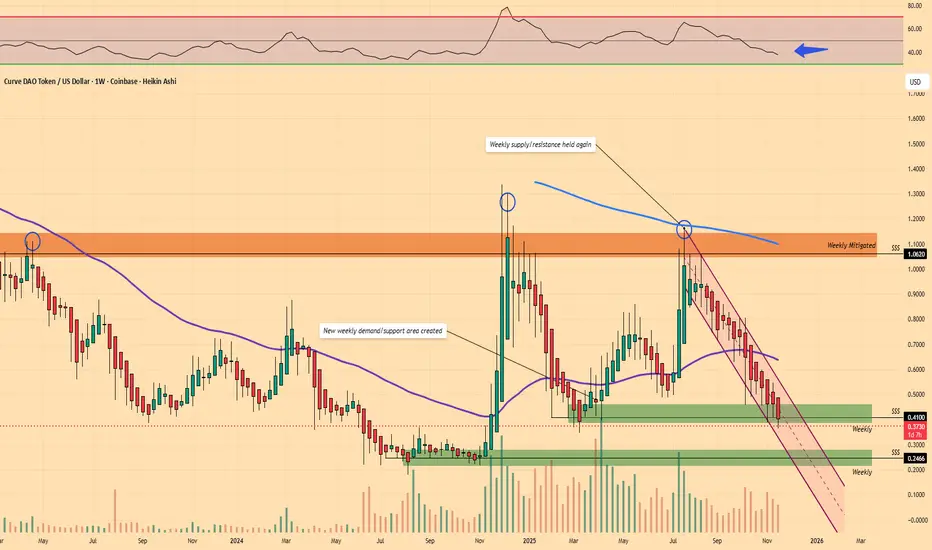
$CRV / Curve Finance - DeFi Play?Called the move back in May and we are back (due to the weekly resistance/supply holding) retesting a fresh weekly demand/support zone trading below the 50MA.
Hello old friend.
..still a good place to accumulate spot here (once I see buyers) for a quality project.
EUR/USD – Potential Trade SetupI was expecting a price rebound from the 1.14938 level, and the pair did touch this area. However, the current trend is downward, so the only potential entry would be after breaking the previous highs to take liquidity before resuming the decline.
Currently, the available opportunity is around 1.15633, following the high taken at 1.15525. Traders should watch for confirmations before entering and manage risk carefully, as the overall momentum remains bearish.

Supply & Demand vs Support & Resistance — Beyond the Lines“Two traders can look at the same level.
One sees a line.
The other sees the reason behind it.”
Most beginners start with Support & Resistance.
Advanced traders shift into Supply & Demand.
Both seem similar… and in some cases, they are the same.
But the difference lies in why price reacts — not just where.
Let’s break this down clearly.
1. Support & Resistance: The Surface Layer
Support and resistance are simple horizontal reaction levels.
Support
A price level where the market tends to bounce upward.
Resistance
A price level where the market tends to reject downward.
These levels represent crowd behavior.
Retail traders love them — which is why they often turn into liquidity pools.
Strength: easy to spot, widely used
Weakness: easily manipulated because stops cluster there
2. Supply & Demand: The Deeper Institutional Layer
Supply & Demand zones are created by imbalances — strong, one-sided moves driven by institutional orders.
To make the concept crystal clear:
Demand Zone
The last bearish candle (or group of candles) before a strong impulsive move upward, caused by institutional buying and imbalance.
Supply Zone
The last bullish candle (or group of candles) before a strong impulsive move downward, caused by institutional selling and imbalance.
These zones show where institutional buying or selling actually started.
Strength: precise entries, strong reaction zones
Weakness: requires deeper understanding and confirmation
3. How They Connect
This is where most traders get confused.
Support/Resistance = the reaction.
Supply/Demand = the reason for the reaction.
Many times:
A support level is formed because a demand zone sits right below it.
A resistance level is formed because a supply zone sits above it.
So yes — in many cases:
Demand = Support
Supply = Resistance
But only when the reaction was created by institutional imbalance.
4. When They Are NOT the Same
This is the part traders often miss.
❌ Support is NOT demand when:
• Price bounced many times (retail clustering)
• No strong bullish impulse originated there
• Candle structure shows hesitation, not institutional entry
This is just retail support, not a demand zone.
❌ Resistance is NOT supply when:
• Price tapped repeatedly (equal highs)
• No sharp drop came from that level
• The zone lacks displacement or imbalance
This is simply retail resistance, not a supply zone.
5. How to Use Both for Maximum Clarity
Here’s the practical way to combine them:
Use Support/Resistance to understand where retail will react.
Use Supply/Demand to understand where institutions will react.
Best workflow:
• Mark higher timeframe Supply/Demand
• Mark intraday Support/Resistance
• Wait for price to move between these layers
• Look for confirmation (ChoCH/BOS) at the real institutional zone
• Avoid taking trades directly at retail S/R without deeper context
This gives you direction, patience, and precision.
Example (XAUUSD)
Refer to M15 chart above:
Price respected an intraday support level,
but the real reversal happened only after tapping the demand zone below it,
where imbalance and institutional orders existed.
Support showed the bounce.
Demand explained the bounce.
One shows the line.
The other shows the truth behind the line.
📘 Shared by @ChartIsMirror
Do you trade with support and resistance, supply and demand, or a mix of both?
Share what you see — your approach reveals how you read the market’s story.

CAD/JPY – Wedge Breakout Pattern (21.11.2025)📝 Setup Overview OANDA:CADJPY
CAD/JPY has broken below a rising wedge structure, signaling weakening bullish momentum. After multiple rejections at the resistance zone, price is now losing steam below the Ichimoku cloud, showing early bearish pressure.A clean breakout + retest scenario opens the door for downside continuation toward the next demand zones.
📌 Trading Plan📍 Entry Idea:
Look for bearish continuation below the wedge support + cloud rejection.
🎯 Targets (Support Levels):
1st Support: 111.022
2nd Support: 110.561
🛑 Resistance Zone:
112.014 – 112.294
This zone continues to act as a strong supply area where sellers took control repeatedly.
📉 Today’s Fundamentals – Bearish CAD Bias
1️⃣ Crude Oil Pullback → Weakens CAD
Canada’s economy is heavily tied to oil prices. Today’s dip in crude oil puts pressure on the CAD, giving JPY an advantage.
2️⃣ Safe-Haven Demand Supports JPY
With global markets showing risk-off sentiment (concerns over slowing global growth + uncertain central bank guidance), investors favor safe-haven currencies like the Japanese Yen.
3️⃣ BoC Policy Tone Still Cautious
Recent Bank of Canada communications show limited confidence in economic momentum.
Markets expect slower growth → bearish CAD outlook.
➡️ Combination of oil weakness + JPY strength + wedge breakdown = bearish continuation setup.
🔖 Hashtags
#CADJPY #ForexAnalysis #PriceAction #WedgeBreakout #Ichimoku #FXTrading #TechnicalAnalysis #FundamentalAnalysis #SmartMoney #TradingViewCommunity #Kabhi_TA_Trading
⚠️ Disclaimer
This analysis is for educational purposes only.
Not financial advice. Always manage your risk and trade based on your plan.
💬 Support the Work
If you found this analysis helpful, please LIKE & COMMENT on the post ❤️
Your support motivates more high-quality setups daily!

Potential Downside Short-term - Long Term EntriesCOINBASE:BTCUSD has broken below the ascending channel that has held for several months, indicating a possible shift in momentum from bullish to bearish. BITSTAMP:BTCUSD is overbought on the RSI and broke below it's 200-day EMA as well. I'll certainly be adding to my long-term position on the way down and will likely grab a long position at some point- will post an update then. Until then, some RSI-based supply and demand zones to keep an eye on, watching closely

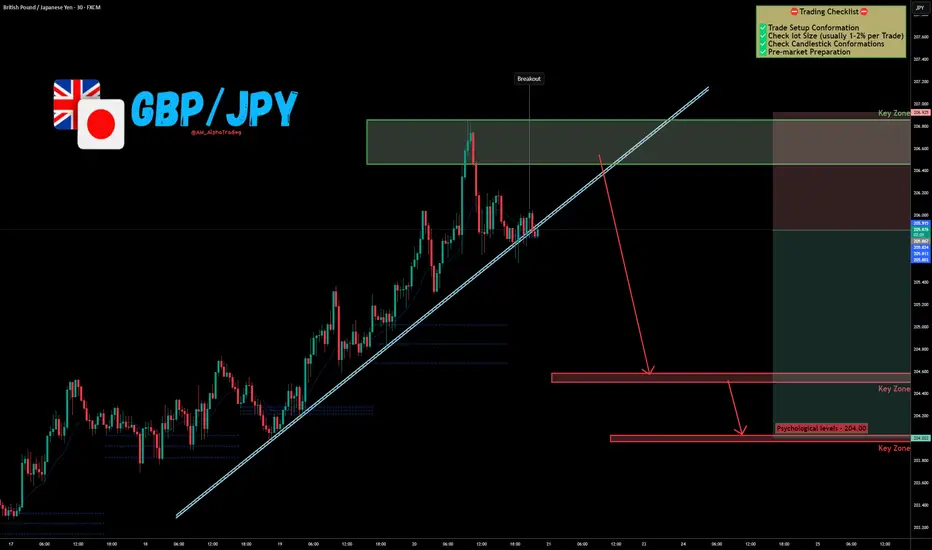
GBP/JPY Rejection at Supply → Next Stop: 204.00 !The GBP/JPY Pair, Price has been trading within a Trendline Breakout on the M30 chart, forming consistent lower highs and lower lows. Price action is now testing the lower boundary of the pattern, signalling a possible breakdown.
✅Market Context:
1️⃣Downward structure building inside the pattern.
2️⃣Sellers are showing strength near support levels.
3️⃣Breakdown below the trendline indicates momentum continuation toward lower zones.
✅Trade Plan :
Entry: Sell after confirmed breakdown below the support (Candle close below trendline or retest of the breakout).
💰Take Profit (TP): At the Key Zone – major support area identified ahead.
🛑Stop Loss (SL): Above the pattern structure / recent swing high.
✅Psychological Discipline:
1️⃣Stick to plan – No Revenge Trades.
2️⃣Accept losing trades as part of the strategy.
3️⃣Risk only 1–2% of your account balance per trade.
✅ Support this analysis with a
LIKE 👍 | COMMENT 💬 | FOLLOW 🔔
It helps a lot & keeps the ideas coming!
⚠️ Disclaimer: This analysis is for educational purposes only and does not constitute financial advice. Forex trading involves high risk. Trade only with capital you can afford to lose and always do your own research.
EUR/USD – Buy Setup DevelopingThe EUR/USD is now showing potential for a buy opportunity after sweeping the trendline liquidity. The pair appears ready to rebound from the 1.15162 level, which aligns with a 1-hour Order Block—adding further confluence for a bullish reaction.
This area may serve as a strong support zone, suggesting a possible upward move if price holds above it.

EUR/USD Analysis – Potential Buy OpportunityThe EUR/USD pair may start moving upwards to fill the liquidity void left during its decline over this week.
If a 15-minute candle closes above 1.15379 or inside this Order Block , this could present a good buying opportunity, with potential for the price to continue rising toward the Liquidity void
Keep a close eye on price action and ensure proper risk management before entering any trade.

EUR/CAD - Bearish Flag (20.11.2025)🧠 Setup Overview TICKMILL:EURCAD
EUR/CAD is forming a clean Bearish Flag Pattern after a strong impulsive drop.
Price is trading below the EMA, inside a rising corrective channel — a classic continuation structure. With cloud resistance above and repeated rejections from the upper flag boundary, bearish momentum is building. A confirmed breakdown below the lower trendline could trigger the next bearish leg.
📊 Trading Plan🔻 Sell Bias (Primary Scenario)
Watch for a candle break & retest below the flag
Enter short after confirmation
🎯 Targets:
1st Support: 1.6137
2nd Support: 1.6109
❌ Invalidation:
A strong candle close above 1.6230 cancels the bearish view
⚡ Fundamental Outlook – Today (20 Nov 2025)
CAD Fundamentals
1️⃣ Canadian Dollar strengthened as crude oil prices saw a mild rebound, supporting CAD (commodity-linked currency).
2️⃣ Bank of Canada remains cautious, but no new signs of easing have emerged — giving CAD some underlying firmness.
EUR Fundamentals
3️⃣ Euro under pressure due to rate-cut expectations in early 2026 as European economic data remains soft, especially in manufacturing.
4️⃣ Risk-off sentiment pushes flows toward safer currencies, indirectly affecting EUR negatively.
➡️ Fundamentals support a continuation move lower for EUR/CAD.
#EURCAD #Forex #BearishFlag #PriceAction #TechnicalAnalysis #EUR #CAD #ForexTrader #TradingSetup #KABHI_TA_TRADING #ChartsDontLieTradersDontQuit #TradingViewCommunity #SupportAndResistance #BreakoutStrategy
⚠️ Disclaimer
This analysis is for educational purposes only.
Not financial advice — always use proper risk management.
💬 Support My Work ❤️
If this setup helps you:👍 LIKE the post💬 COMMENT your view🔔 FOLLOW for daily setups
Your support motivates me to keep posting high-quality analysis!

EURUSD Short Setup if Key Level BreaksIf the EURUSD manages to break below the 1.15243 level, a potential short opportunity may develop around 1.15273. However, this setup is not confirmed yet, and the key element here is patience and proper validation.
For this scenario to become valid, the market must first close a 15-minute candle below 1.15243. Such a close would indicate that the price has successfully broken through the level and is showing signs of rejection from the 15-minute orderblock, suggesting that sellers are stepping in with intention.
This type of confirmation is essential because it filters out false breaks and ensures that the market is truly shifting momentum. If this rejection is validated, then the retest of 1.15273 could provide a precise and clean entry for short setups, with structure and liquidity alignment supporting the move.
Until that break and close happen, the level remains a potential reaction point rather than a confirmed bearish continuation signal. As always, waiting for clear confirmation helps avoid entering the market prematurely, especially during periods where liquidity sweeps are common.

The Arena of XAUUSD-GOLD: New Round BeginsMy friends, Good Morning,
I have prepared a gold analysis for you in a swing trading structure.
The timeframe of this analysis is 4 hours.
In my XAUUSD-GOLD analysis, I will open sell positions between 4124.0 and 4176.0.
My targets are: TP1 - 3995.0 and TP2 - 3969.0.📊
This analysis is purely for your information.
To my friends who support each of my analyses with their likes,
I share these analyses thanks to your likes, because every single like from you is my greatest source of motivation to keep posting.
I sincerely thank all my friends who leave a like. 🙏
With respect and love.❤️

Advanced Supply and Demand (HORC Trend + SnD StructureAfter studying the charts for some time, I’ve realized that candlesticks are all we need to make money in the market. The question is: can you read the story of market participants — where they showed their hand and revealed their intentions before a break of structure or a change of character, creating imbalances as they seek balance?
A concept called HORC is what I follow. It’s an advanced supply-and-demand framework that incorporates knowledge of participant behavior. In this series I will share what I’m looking at and my intentions.
Warning
Nothing shared here is financial advice; I am not an expert. I am still learning and figuring this out.