Gold Regains Direction: Watching Momentum and CluesLooking at the XAUUSD chart, I’m genuinely intrigued by what’s unfolding. Price continues to move steadily within an upward parallel channel, perfectly respecting the market structure, while we are starting to see early signs of renewed buying interest right after a strong rejection at the support zone.
At the moment, I’m focusing on the area around 3,721, near the upper boundary of the channel, as a safe target. If the upward momentum continues with strength and solid volume, this could present a strategic opportunity to enter the market and ride the trend.
Patience is key; I only take action when the price proves its true strength. The market may continue its strong uptrend or create a false move before a deeper correction.
Supply_and_demand

EUR/AUD - Selling Pressure Below 1.7850 (22.09.2025)#EURAUD #Forex #Trading #TechnicalAnalysis
EUR/AUD – Channel Breakout Pattern (30M)
EUR/AUD has broken below the rising channel, confirming a bearish reversal after completing a Head & Shoulders pattern at the top.
🔹 Market Structure:
Clear rejection from the resistance zone (1.7850 – 1.7860)
Breakdown of the bullish channel support
Head & Shoulders formation adding to bearish momentum
🔹 Key Levels:
1st Support: 1.7715
2nd Support: 1.7710
📉 Trading Idea:
As long as EUR/AUD stays below the channel resistance, selling pressure could drive price toward the support levels.
🎁 Please hit the like button and
🎁 Leave a comment to support for My Post !
Your likes and comments are incredibly motivating and will encourage me to share more analysis with you.
Best Regards, KABHI_TA_TRADING
Thank you.

EURUSD: wedge narrowing with downside targets in sightOn the daily chart, EURUSD has formed a rising wedge pattern, and the current price action indicates readiness for a decline. Attempts to hold above 1.1800 have failed, pressure has increased, and last week’s close can be viewed as a potential false breakout.
The first downside target is at 1.1413, where a strong support level lies. Further targets may shift to 1.0750 and 1.0480 levels that have accumulated significant volume over the past few months. A full breakdown of the wedge would give momentum to the bearish scenario and increase pressure on the euro.
From a fundamental perspective, the picture remains mixed: the 200 EMA capping from above and the sideways movement in the dollar index confirm the likelihood of euro weakness, but every pullback continues to be aggressively bought, preventing a collapse. If the dollar gains additional support from US macroeconomic data or Federal Reserve policy, the bearish scenario will become dominant.

NEAR/USDT - Bearish Outlook for short Term BINANCE:NEARUSDT NEAR/USDt - Channel Breakout with strong volume, looking for strong bearish in upcoming days.
As altcoin momentum intensifies, Near Protocol
NEARUSDT is rapidly emerging as a standout contender in the crypto space. Fueled by strong fundamentals and recent bullish market trends, NEAR’s rise has caught the attention of both retail and institutional investors.
With NEAR now bridging to Solana and TON via Chain Signatures, the future looks promising. Wondering where it’s headed next? Dive into our in-depth NEAR Price Prediction
However, if bearish pressure takes over and breaks the $2.0 to $1.8 support zone, a further decline is likely, with the $1.0 level becoming the next probable target.
Support by Likes and Comments.
Thank you.

XAUUSD| POSSIBLE SELL MOVE AFTER NEWS EFFECT I am closely monitoring a significant price zone after observing that the market pushed upward, taking out liquidity above the order block (OB) before closing back below it. This movement appears to be influenced by recent news. As the price stabilizes, I am considering a selling opportunity, but only under specific conditions:
1. The price must first sweep Friday's high, then touch and react from the daily order block.
2. There should be a clear change of character (CHOCH) or break of structure (BOS) on the 1-hour chart.
3. A refined entry signal must be established on the 15-minute chart.
4. Execution of the trade can be either through limit orders or instant execution.
If these criteria are met, I will proceed with the trade. Otherwise, I will remain sidelines and wait for the London session, focusing on the potential for Asian liquidity.

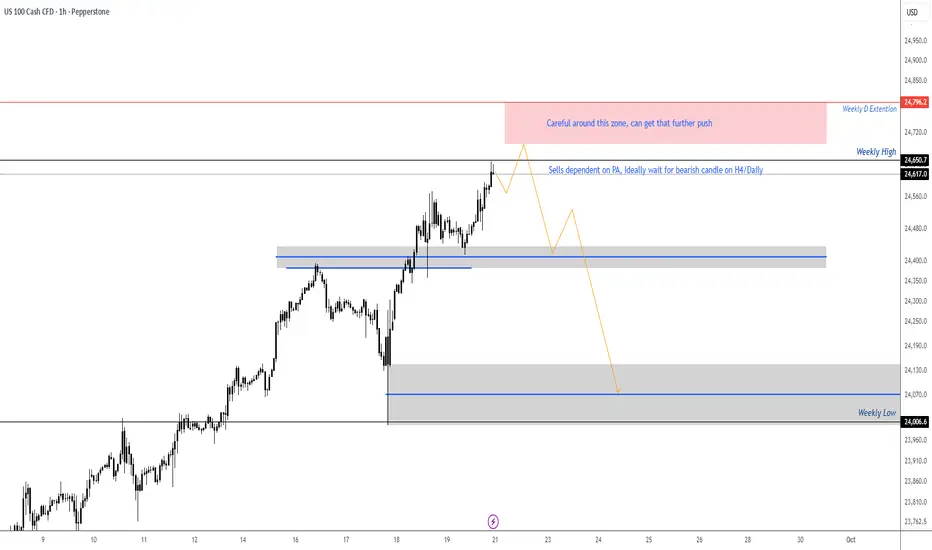
NASDAQ - setting up for Bearish SetupLooking for the bearish signal or the H4/Daily time frame, might get that final push for the D extension on the weekly timeframe, opening of the week might get a small pullback then continuation to the upside. Trade will be validated only if we get bearish PA setup on the H4/Daily. Looking for the setup to create a turn shape then can look for potential entries. If price does not present a bearish setup on the H4/Daily then the plan is no longer valid.
AUDJPY – SHORTA short position is proposed upon price rejection from the key resistance area. This area is defined by the confluence of the Supply Zone's POC level and a Dynamic Gann Resistance angle. The target is at the POC level within the next significant Demand Zone.
AUDJPY – SHORT
ENTRY PRICE - 98.150
SL - 99.400
TP - 94.400
Always follow the 6 Golden Rules of Money Management:
1. Protect your gains and never enter into a position without setting a stop loss.
2. Always trade with a Risk-Reward Ratio of 1 to 1.5 or better.
3. Never over-leverage your account.
4. Accept your losses, move on to the next trade and trust the software.
5. Make realistic goals that can be achieved within reason.
6. Always trade with money you can afford to lose.
Please leave your comment and support me with like if you agree with my idea. If you have a different view, please also share with me your idea in the comments.
Have a nice day!

Heads Up !! BTC Long Entry Incoming, Don't Miss ItThis is yet another Volume profile VAL long entry that is in line with the LVN of the current rotation we've been in since Sept 11.
Other strong confluences for this entry i did not show on this chart to keep it clean, but visible on my personal chart are
1. Entry is at Monthly VWAP
2. Entry is also at 1 SD from Weekly VWAP
Definitions
VAL - Value Area Low
LVN - Low Volume Node or Area
SD - Standard Deviation

Bitcoin - Will Support Hold?📢 NFX Market Update – COINBASE:BTCUSD
BITSTAMP:BTCUSD bullish rally recently hit resistance at $116,500, and price is now testing the $114,800 support zone. This level is acting as a strong psychological support, following the earlier break through the block order.
The key question: Will this support hold, or will price dip further toward the ascending channel support and the 200-day SMA?
My outlook: I believe support will hold. Price may briefly test lower levels - likely just a few wicks - before resuming higher.
🎥 More details in the video.

Price Reacting at Supply ZoneMarket is bearish and came back up to supply zone so we will wait for break of structure and to go short

BTC/USD Sell Setup: Overbought Signals a Pullback!COINBASE:BTCUSD The price is currently approaching a key resistance zone at the upper boundary of the ascending channel. This level often marks the point where a pullback could occur, especially as the price nears the top of the channel. If a correction takes place, the next key support level to watch is 113,500 USD.
Should buyers manage to defend this support, the bullish trend could continue, with potential for the price to break through previous highs. However, if the price breaks below the support level, we may see a deeper retracement back to the lower part of the channel.
This setup offers a potential opportunity to enter if a pullback occurs, especially with confirmation from price action, candle patterns, and volume around the key levels. Make sure to manage risk appropriately and only take trades when your setup is validated.
What are your thoughts on this setup? Drop your comments below, and let’s discuss!
Wishing you successful trades!

GBPAUD | Possible Re-entry on 15Min When analyzing price movements on a 4-hour chart, it's important to note that the price is currently coming from a fresh demand zone. This return to the demand zone indicates a potential bullish intent, suggesting that buyers may be stepping in at this level.
Now, if we scale down to the 15-minute chart, we can observe a subtle shift in the price action. There is a trendline liquidity that is positioned just above our identified point of interest (POI), which is complemented by a fair value gap (FVG). This trendline presents an additional confluence that supports the possibility of continued upward movement.
As market participants, we should proceed with caution and closely monitor how price reacts when it approaches this zone once more. It is also beneficial to take the time to observe these patterns and phenomena in your own analysis to deepen your understanding. Happy trading!

EURUSD Short: Price Reverse and Start FallHello, traders! The price auction for EURUSD has been operating within a well-defined ascending channel for several weeks. This bullish structure has been confirmed by multiple pivot points, with buyers defending the ascending demand line and sellers consistently emerging at the upper supply zone near the 1.1715 level. This has established a clear rotational pattern between the channel's boundaries.
Currently, the auction is at a critical inflection point, once again testing the upper boundary of this channel. The price has rallied to meet the ascending supply line, which forms a strong confluence of resistance with the horizontal 1.1715 - 1.1740 supply area. This is the same zone where previous rallies have failed, making it a key battleground.
The primary scenario anticipates a rejection from this resistance confluence, continuing the established pattern of rotation. The expectation is that sellers will defend the supply zone and initiate a new downward move back towards the channel's support. A failure to break out higher would confirm a short-term correction is underway. The take-profit for this rotational play is therefore set at 1.1605 points, targeting the ascending demand line of the channel. Manage your risk!

EUR/USD Nears Key Supply Zone Amid Rising Short PositionsThe EUR/USD is currently approaching a significant daily supply zone. This is an area where, in the past, the price briefly touched before reversing and heading downward. Now, the currency pair is nearing a second test of this supply level, which could signal that institutional traders are preparing to add more short positions. Historically, these supply zones tend to act as resistance points, and the repeated testing suggests a potential buildup of selling pressure.
Looking at the recent positioning of different market participants, last week saw an increase in short positions among Non-Commercial traders, indicating that large speculators are betting on a decline in the EUR/USD. Conversely, Commercial traders are at their lowest levels since August 2024, which typically signals that those involved in hedging or commercial transactions are less inclined to support the current price levels. Meanwhile, retail traders continue to add to their positions, often acting as a contrarian indicator.
In tandem, the US dollar itself is entering a demand zone, as evidenced by the increase in Non-Commercial contracts on the dollar index. This suggests that speculative traders are betting on the dollar strengthening, which aligns with the potential for a downside move in EUR/USD.
Given these combined signals—the approaching supply zone, the increase in short positions among large traders, and the dollar entering a demand area—I am looking for a possible shift towards the downside for EUR/USD. This could lead to a strengthening of the US dollar as the market prepares for a potential reversal or continuation of the bearish trend.
Additionally, I will include my analysis of the DXY (US Dollar Index), which remains valid and supports this perspective. The DXY’s current positioning and technical setup reinforce the likelihood of the dollar gaining strength in the near term. Overall, the market is showing signs that favor a downside move, and I will be monitoring these levels closely for confirmation.
✅ My DXY Point of view:
✅ Please share your thoughts about EURUSD index in the comments section below and HIT LIKE if you appreciate my analysis. Don't forget to FOLLOW ME; you will help us a lot with this small contribution.

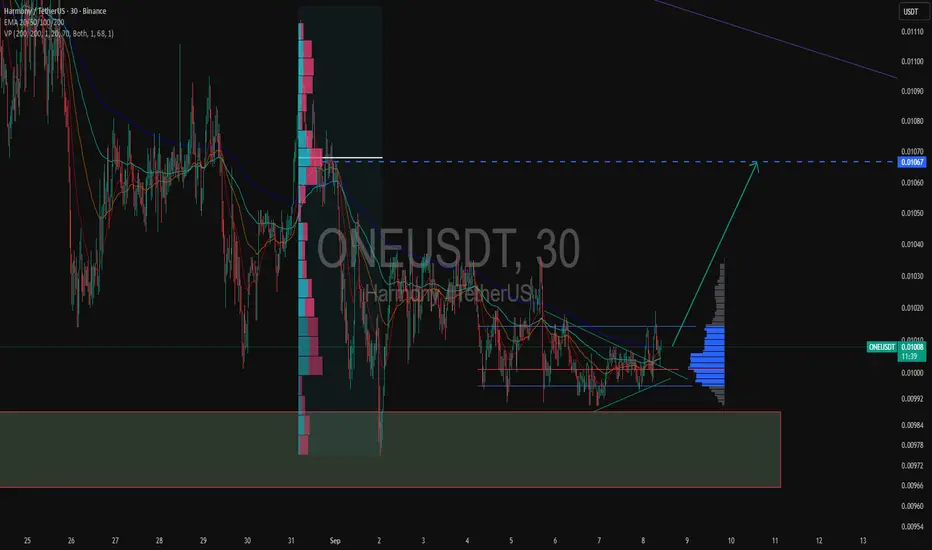
ONEUSDT 30M small step towards reversalHarmony (ONE) is once again reminding traders that even modest altcoins can surprise with sudden moves.
After days of sideways action the price finally found support around 0.0098–0.0099 and is now attempting a breakout. The chart shows a wedge compression, EMAs aligning, and the volume profile confirming a buyer’s zone. If the price secures above 0.0102 the door opens towards 0.0107 as the first solid target.
Fundamentally it’s not the star of the show but with crypto market momentum ticking up ONE could easily catch the wave. Right now it looks like a student before the exam: everything is learned, just needs to answer out loud.
Along with ONE I’m also adding TURBOUSDT, ADAUSDT and XRP (Ripple) to my buy block — they’re setting up for similar bounce opportunities.
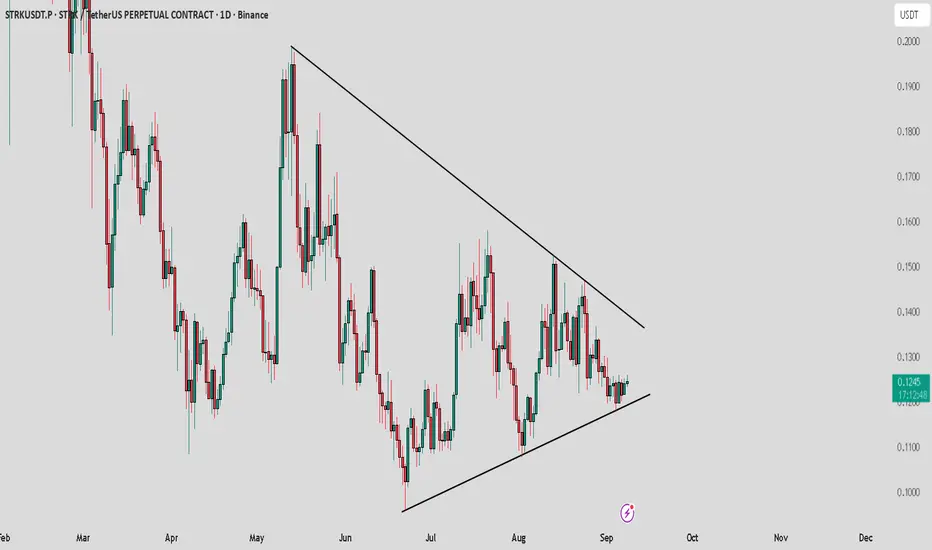
STRK /USDT : Holding support and bouncing to approach resistanceSTRK/USDT is holding strong support and climbing toward the $0.13 resistance.
A breakout above this resistance could open the way for a bullish rally toward $0.20. Keep a close watch for confirmation.
BTCUSD 1D Bitcoin making new climbing plansAfter the summer correction Bitcoin is once again showing strength.
The chart is shaping a rising channel and the pullback to the 108500 support worked textbook-style.
Moreover, a breakout above 113000 will open the way directly to 125000.
Volume profile supports the buyers’ side while the price action looks like a healthy pause before the next impulse.
Fundamentally the backdrop stays bullish with institutional flows into ETFs and Fed rate cuts still on the table for year-end.
The irony is that while many were waiting for 94k or lower Bitcoin just secured its rope and started climbing higher.

XAUUSD Long- Fri, Sep 5, 2025I did open a long position on Gold yesterday hoping to get close to the ATH. Luckily it did and gave me a 1:4 rr. I guess this is it for gold so far and it is going to drop a bit for the foreseeable future.
what do you think??
-Moz
#XAUUSD #long #ATH

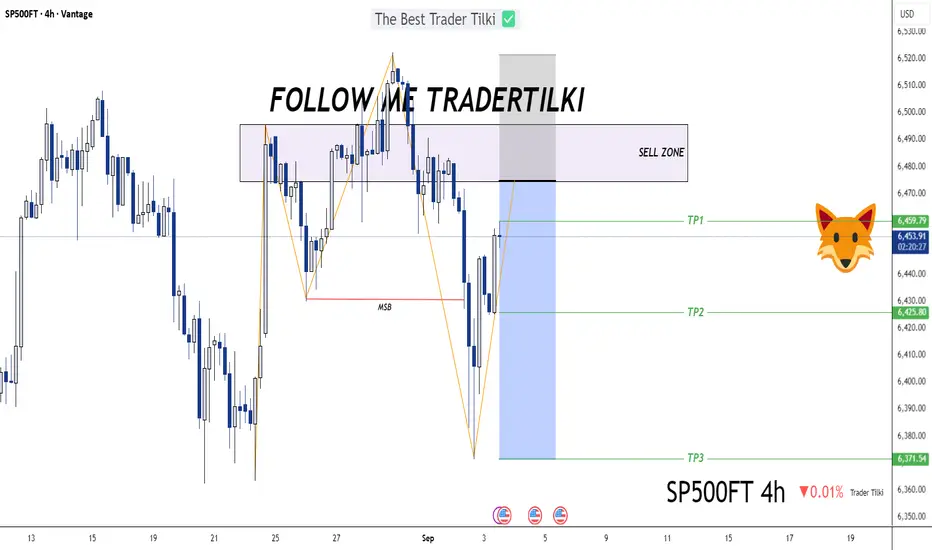
SP500 Structure Shift: Sell Zone ActivatedHey Guys 👋
I’ve prepared an SP500 analysis for you. Since the market structure has shifted, I’ll be opening a sell position from my designated sell zone.
📌 Entry: 6,474.90
📌 Stop: 6,522.12
🎯 TP1: 6,459.79
🎯 TP2: 6,425.80
🎯 TP3: 6,371.54
RISK REWARD - 2,21
Every single like you send my way is a huge source of motivation for me to keep sharing these analyses. Big thanks to everyone supporting with a like 🙏
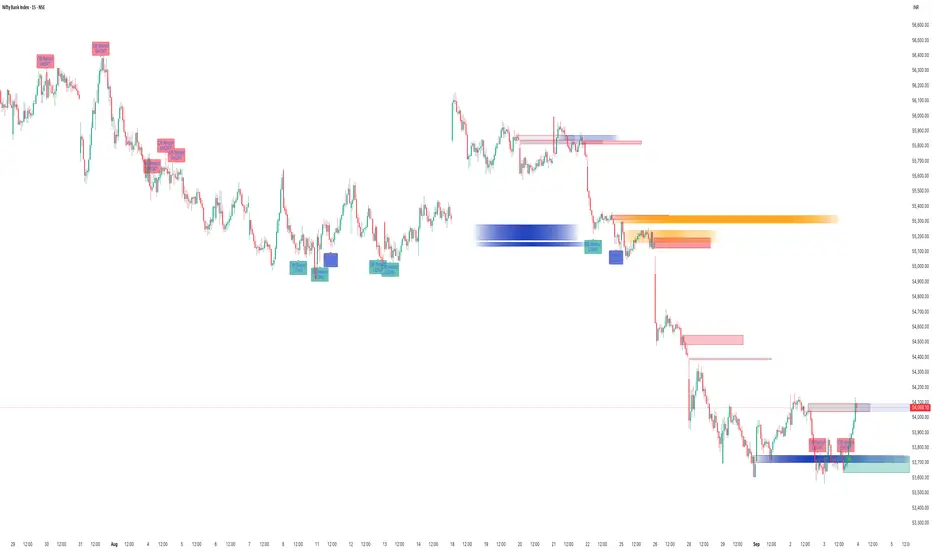
How To Capture Market Moves With SMC Suite Indicator?📊 SMC Suite Capturing Market Moves — Order Blocks • Breakers • Liquidity Sweeps • FVG
The chart above shows how the SMC Suite works in live market conditions on BankNifty. By combining Order Blocks, Breaker flips, Liquidity Sweeps, and Fair Value Gaps, the tool highlights where smart money is entering and where reversals are likely to occur.
🔹 Key Highlights from This Chart
1. Order Blocks — Bullish and bearish OBs correctly marked institutional footprints before price reversals.
2. Breaker Blocks — Invalidated OBs flipped into Breakers, giving continuation entries in trend direction.
3. Liquidity Sweeps — Several highs/lows were taken out, followed by reversals back into structure. These sweeps acted as confirmation for later setups.
4. Fair Value Gaps (FVGs) — The script marked imbalances that later served as retracement zones. Price respected these gaps, providing clean reversal opportunities.
5. Retest Alerts — Each zone was validated only on retests with optional wick rejection, reducing noise and improving signal quality.
⸻
🔹 Why It Matters
This chart shows that SMC Suite is not just drawing zones randomly — it creates a workflow:
• Sweep liquidity ➝ impulsive displacement ➝ zone creation (OB/Breaker/FVG) ➝ retest confirmation.
This makes it easier to follow institutional logic and align entries with high-probability setups.
📌 Conclusion
From strong downside moves to clean bounces, the SMC Suite captured both continuation setups (Breakers) and reversal setups (OB/FVG retests). The integration of liquidity logic makes it a practical trading tool across indices, forex, and crypto.
XAUUSD 15m buying potentialMalaysian SNR + SMC concept with engulfing orderblock.
Entry: 3384
SL: 3380
TP: 3393

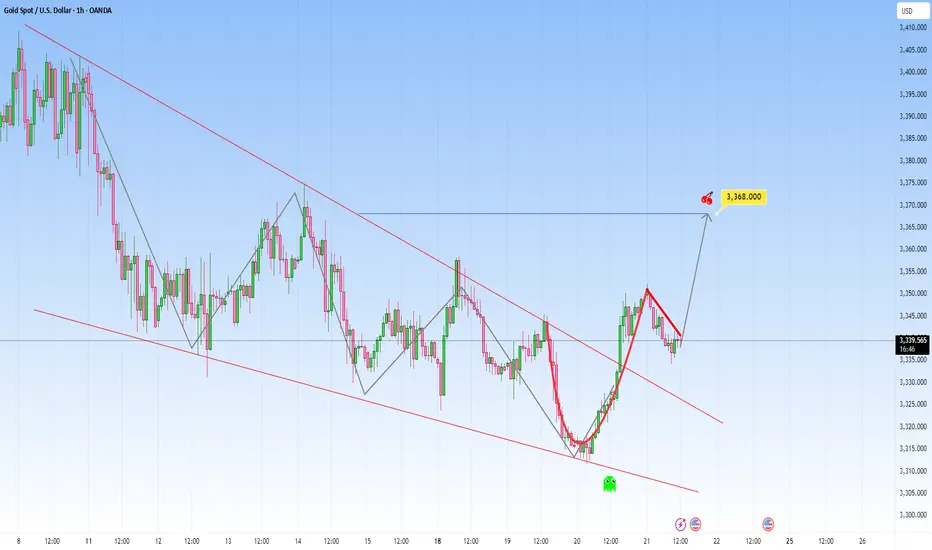
Cup and handle pattern spotted: Optimistic view for GoldOANDA:XAUUSD is showing a clean Cup and Handle setup. The price dipped to around 3,310, rounded out, and climbed back to the 3,350–3,360 zone, that’s our cup. Now it's pulling back slightly into a tight handle.
If price breaks above it with strength, I’d be expecting a move toward 3,368$. Until then, it’s a waiting game, no breakout, no trade.
Classic bullish setup forming, as anticipation is building up.
GBP/JPY - Breakout (22.08.2025)The GBP/JPY TRADENATION:GBPJPY pair on the M30 timeframe presents a Potential Buying Opportunity due to a recent Formation of a Breakout Pattern. This suggests a shift in momentum towards the upside and a higher likelihood of further advances in the coming hours.
Possible Long Trade:
Entry: Consider Entering A Long Position around Trendline Of The Pattern.
Target Levels:
1st Resistance – 200.02
2nd Resistance – 200.42
🎁 Please hit the like button and
🎁 Leave a comment to support for My Post !
Your likes and comments are incredibly motivating and will encourage me to share more analysis with you.
Best Regards, KABHI_TA_TRADING
Thank you.
Disclosure: I am part of Trade Nation's Influencer program and receive a monthly fee for using their TradingView charts in my analysis.
