"BTC at Critical Reversal Zone – Watch This Key Liquidity Trap
"BTC at Critical Reversal Zone – Watch This Key Liquidity Trap 🎯"
Market Structure Overview
BOS (Break of Structure): Multiple BOS points indicate shifts in trend phases, first to the downside (end of July to early August) and then back to the upside.
BOL (Break of Low): This marked a key liquidity grab before the reversal rally began.
Liquidity Zones: The chart highlights both sell-side liquidity (below lows) and buy-side liquidity (above highs), showing where institutional traders hunt stops.
2. Key Supply & Demand Zones
Support Zone (112,500 – 114,500): This level acted as a demand base after the liquidity sweep in early August. Price reacted strongly here, triggering the bullish leg.
Previous Resistance (121,500 – 122,500): This zone has capped price multiple times, making it a critical area for sellers to defend.
3. Current Trade Setup
Entry Zone: Around 120,000 – 120,400, where a short setup is triggered upon rejection.
Stop Loss: Above 122,120, just beyond the resistance to avoid premature stop-outs.
Target: 116,500 – aligning with prior liquidity pools and structural support.
4. Educational Takeaways
Liquidity Hunts: Notice how price often spikes into liquidity pools before reversing—this is common in BTC’s volatile environment.
Confluence Trading: The short setup aligns with resistance retest + liquidity grab + BOS, increasing probability.
Risk Management: Using defined zones for stop loss and target helps maintain a favorable risk/reward ratio.
Summary:
BTC is currently respecting the higher-timeframe resistance zone, with a clear short-term bearish setup in play. A rejection from the entry zone could trigger a drop toward the 116,500 target. Traders should monitor price action closely and avoid chasing entries—patience and precision are key.
Supportandresistancezones

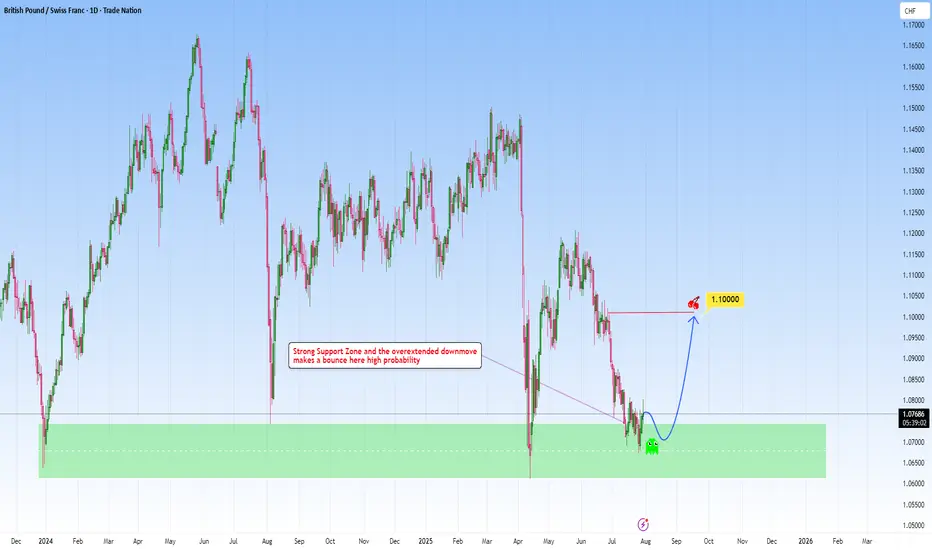
GBPCHF meets strong support: A reversal here is high probabilityLooking at GBPCHF and how it fits within my approach to structure-based trading, this one is really speaking my language.
Price has come down into a key higher-timeframe support zone: a zone that’s proven itself multiple times in the past. Now, price has shown some initial rejection there, making my long position towards 1.1000 a clear, rational target.
What makes this setup different could be the patience behind it. As we let the market complete its downward leg, waited for price to revisit a reliable zone, and now anticipating a bounce back. It’s a move that I’ve captured across my previous charts again and again.
Let me know in the comments what you think
Disclosure: I am part of Trade Nation's Influencer program and receive a monthly fee for using their TradingView charts in my analysis.
Gold Trading Strategy XAUUSD August 14, 2025Gold Trading Strategy XAUUSD August 14, 2025:
Gold prices continued to rise in the European session on August 13, 2025 as mild US inflation data raised expectations of a Federal Reserve rate cut in September, while a weaker US dollar also boosted demand for gold.
Fundamental news: The US labor market report earlier this month initially weighed on the greenback, but the latest US CPI data added pressure as it did not show a clear acceleration in inflation due to tariffs in July. The inflation data reinforced the possibility that the Fed will take a more dovish stance in September, which is what the market is expecting.
Technical analysis: After a deep correction to the 3330 area, gold prices showed signs of increasing again. On the H1 frame, an upward price channel has been formed, but the current MA lines are still moving sideways, not showing a clear trend. The 3350 - 3355 area will be the important area to decide whether this uptrend channel can hold or not. RSI on H1 and H4 timeframes has entered the buy zone, this is a very good condition for us to trade. We will trade at the support zones and large liquidity zones of gold prices.
Important price zones today: 3350 - 3355, 3335 - 3340.
Today's trading trend: BUY.
Recommended orders:
Plan 1: BUY XAUUSD zone 3350 - 3352
SL 3347
TP 3355 - 3365 - 3375 - 3390.
Plan 2: BUY XAUUSD zone 3335 - 3337
SL 3332
TP 3340 - 3350 - 3370 - 3390.
Plan 3: SELL XAUUSD zone 3388 - 3390
SL 3393
TP 3385 - 3375 - 3365 - 3355 (small volume).
Wish you a safe, successful and profitable trading day.🥰🥰🥰🥰🥰

EURUSD Technical Analysis (Educational Breakdown) EURUSD Technical Analysis (Educational Breakdown)
1. Market Structure Overview
The chart shows a clear downtrend phase that started after failing to break the major resistance around 1.1780 – 1.1820.
Price formed lower highs and eventually broke below a rising trendline, signaling a shift from bullish momentum to bearish control.
Recent movement shows a retracement toward a defined entry zone, suggesting a short-term pullback opportunity.
2. Key Levels
Resistance Zone (1.1780 – 1.1820): This area has acted as a strong supply zone in the past, rejecting bullish attempts and triggering heavy sell-offs.
Support Zone (1.1340 – 1.1380): A key demand area where previous reversals took place.
Current Entry Zone: Between 1.1697 – 1.1750, aligning with a minor resistance zone and previous supply reaction.
3. Price Action Insights
Fair Value Gap (FVG) identified earlier near 1.1700 served as a reaction zone before a push downward.
The price is now revisiting an area near the previous imbalance, which aligns with a confluence of resistance and short-term overbought conditions.
If price action rejects the entry zone, a bearish swing toward 1.1534 is likely.
4. Trade Setup Idea (Short Bias)
Entry: 1.1697 – 1.1750 (retest of broken structure).
Stop Loss: Above 1.1772 to avoid stop hunts beyond resistance.
Target: First take profit at 1.1534; extended target toward 1.1400 if bearish momentum persists.
5. Risk Management & Educational Note
This setup is based on supply & demand principles plus market structure shifts.
Always confirm entries with lower-timeframe rejection patterns before executing.
Protect capital with a maximum of 1–2% risk per trade and adjust lot sizes accordingly.
📌 Summary:
EURUSD is currently testing a high-probability short zone after a structural breakdown. If rejection occurs, sellers could push price toward mid-range support at 1.1534, and potentially deeper toward the 1.1400 zone. However, if bulls manage to reclaim and close above 1.1780, this bearish view becomes invalid.

Gold Eyes Short-Term Pullback Before Key Support Test"Gold Eyes Short-Term Pullback Before Key Support Test 🏆📉"
Market Structure
The chart shows a clear range-bound price action between the strong support near 3,303 – 3,316 and the resistance zone around 3,420 – 3,440.
Multiple Higher Lows (HL) indicate that the market has been trying to build a bullish structure, but the recent level rejection from resistance suggests sellers are still defending that zone aggressively.
2. Key Zones
Resistance (3,420 – 3,440): Price tested this level and faced a sharp rejection, marking it as a strong supply zone.
Support (3,303 – 3,316): Historical buy reactions are seen here, making it a crucial demand zone.
Entry Zone: Around 3,351 – 3,360, which is being used for the current short setup.
3. Pattern & Price Action
BOS (Break of Structure) occurred earlier on the left side of the chart, breaking above previous highs and confirming bullish strength at that time.
BOL (Break of Low) later on indicates a shift in momentum, as price failed to maintain the bullish push and created a bearish swing.
The Bullish Fair Value Gap (FVG) earlier provided a springboard for upward movement, but recent momentum failed to sustain.
4. Current Trade Idea (Short Bias)
Entry: 3,351 – 3,360 (retracement to minor resistance after breakdown).
Stop Loss: Above 3,380, protecting against a false breakout.
Target: 3,316 (mid-term) with a possible extension to 3,303 if bearish pressure continues.
5. Sentiment & Risk Factors
Bears are currently favored due to the rejection from major resistance and the inability of bulls to reclaim 3,380+.
If the price reclaims and holds above 3,380, this short setup will be invalidated, and the market could retest 3,420 – 3,440.
📌 Summary:
XAUUSD is trading in a defined range, with the current structure leaning bearish after resistance rejection. A short position from the entry zone targets the strong support below, but traders should remain cautious as higher lows in the past indicate that bulls may still attempt to defend support aggressively.

Gold Trading Strategy XAUUSD August 13, 2025Gold Trading Strategy XAUUSD August 13, 2025:
Gold prices recovered slightly, currently trading around $3,351/oz, positive US inflation data for July has reinforced market expectations that the US Federal Reserve (FED) will cut interest rates in September, while a weaker US dollar has boosted gold's appeal.
Fundamental news: Data from the US Bureau of Labor Statistics showed that the Consumer Price Index (CPI) increased 2.7% year-on-year in July, lower than the expected 2.8% and unchanged from June. Core CPI increased 3.1% year-on-year and 0.3% month-on-month, the largest increase in six months.
Technical analysis: The sideways range of 3,340 - 3,360 has not been broken yet. The MAs are showing signs of moving sideways, showing the tug-of-war between buyers and sellers. RSI H1 has started to move towards the buy zone, RSI H4 is heading towards the average line. There is a high possibility that gold price will have a correction according to RSI of H4 and increase strongly again.
Important price zones today: 3340 - 3345, 3365 - 3370 and 3385 - 3390.
Today's trading trend: SELL.
Recommended orders:
Plan 1: SELL XAUUSD zone 3367 - 3369
SL 3372
TP 3364 - 3355 - 3345.
Plan 2: SELL XAUUSD zone 3387 - 3389
SL 3392
TP 3384 - 3374 - 3364 - 3345.
Plan 3: BUY XAUUSD zone 3340 - 3342
SL 3337
TP 3345 - 3355 - 3365 - 3385 - OPEN.
Wish you a safe, successful and profitable trading day.💗💗💗💗💗

USDCHF still bullish expectations
OANDA:USDCHF bullish push we are have, price is make short revers till zone, currently its on sup zone, from which expecting new bullish push.
SUP zone: 0.80400
RES zone: 0.82000, 0.82500

GBPNZD: We could see a rejection at resistance once moreGBPNZD is range bound currently, and this latest moves continues the narrative of it. Right now, it's approaching a major resistance, where each touch here has showed good rejection.
My target would be toward 2.25230, an achievable target.
Though a scenario for more upside is possible and can happen just as much. But, I would take the side for more downside in this particular case.
Let me know in the comments what you think:
Disclosure: I am part of Trade Nation's Influencer program and receive a monthly fee for using their TradingView charts in my analysis.

XAUUSD Gold Trading Strategy August 12, 2025XAUUSD Gold Trading Strategy August 12, 2025:
Gold prices were under pressure on Monday (August 11) and recovered in the morning trading session today (August 12). US President Trump clearly stated that he would not impose import tariffs on gold, dispelling previous market concerns about disruptions to the global gold supply chain.
Fundamental news: Investors are paying attention to the Federal Reserve's interest rate outlook. Gold is entering a correction phase after tariff concerns are resolved, and price movements may be more influenced by Dollar and inflation data.
Technical analysis: Gold prices continue to correct downwards following the trend from last week, with MA lines still acting as resistance. Currently, the RSI H1 frame is approaching the oversold zone, and there is a high possibility that gold will recover this weekend. Resistance and high liquidity areas such as 3354 - 3359 and 3370 - 3375 will be very good trading areas.
Important price zones today: 3354 - 3359, 3370 - 3375 and 3318 - 3323.
Today's trading trend: SELL.
Recommended orders:
Plan 1: SELL XAUUSD zone 3357 - 3359
SL 3362
TP 3354 - 3344 - 3334 - 3324.
Plan 2: SELL XAUUSD zone 3373 - 3375
SL 3378
TP 3370 - 3360 - 3340 - 3320.
Plan 3: BUY XAUUSD zone 3318 - 3320
SL 3315
TP 3323 - 3333 - 3343 - 3363 (small vol).
Wish you a safe, successful and profitable trading day.🌟🌟🌟🌟🌟

EURGBP - Breaking trendline, suggesting downside correctionThe price action on the EURGBP presents an opportunity of structural transition. The ascending trendline has acted as dynamic support, has pushed upmoves beautifully. This trendline is marked by good rejections, reflected bullish dominance.
The recent movement though could signal a shift. The market has started to break above this ascending structure, and it could early suggest that bullish momentum is weakening.
I will be waiting for the price to return to the broken trendline. A confirmation pattern in order to filter false moves, a structure retest that reinforces breakout reliability.
From this base, I am expecting it to target the 0.85600 level.
An ideal approach here would involve observing the character of the pullback. If the market returns to the trendline with strong bullish volume, it strengthens the bullish case.
The trendline break on the chart is not just a signal, it’s a storyline being told. It marks a shift with a story. And if volume, structure and timing align as they appear poised to, this move could be the first move in a broader downside correction.

XAU/USD Intraday Plan | Support & Resistance to WatchGold is consolidating just under the $3,353 level after yesterdays drop from $3,399.Price is holding below both the 50MA (pink) and 200MA (green), keeping the short-term bias tilted bearish.
If buyers manage to reclaim $3,353 and close back above the 200MA, the first upside target would be $3,380, followed by $3,399 and $3,422 if strength builds.
Failure to reclaim $3,353 could see sellers retest $3,329, then the $3,313-$3,295 Secondary Support Zone. A deeper breakdown would expose $3,281-$3,254 Higher Timeframe Support Zone.
📌 Key Levels
Resistance:
‣ $3,353
‣ $3,380
‣ $3,399
‣ $3,422
Support:
‣ $3,329
‣ $3,313
‣ $3,295
‣ $3,281
‣ $3,254
🔎 Fundamental Focus
All eyes on today’s U.S. CPI release.
⚠️ CPI days often see false breaks and whipsaws — let the market settle before taking positions.

F 1H Long Swing Conservative Trend TradeConservative Trend Trade
+ long balance
+ support level
+ ICE level
+ 1/2 correction
- biggest volume 2Sp-
+ weak test
- above first bullish bar close entry
Calculated affordable virtual stop loss
1 to 2 R/R above 1D T1 take profit
Daily Trend
"+ long impulse
+ neutral zone"
Monthly Trend
"+ long impulse
+ long volume distribution
+ neutral zone"
Yearly Trend
"+ long impulse
+ volumed T2 level
+ volumed 2Sp+
+ 1/2 correction"

EURGBP higher bearish for expect
OANDA:EURGBP trend line breaked, DESCENDING TRIANGL also breaked, +after BOE event from last week here having higher bearish expectations
SUP zone: 0.86700
RES zone: 0.85900, 0.85600

"Gold’s Next Big Move? The Hidden Entry Zone Smart Money "Gold’s Next Big Move? The Hidden Entry Zone Smart Money is Watching!"
Gold (XAUUSD) is currently consolidating after a series of higher lows, signaling sustained bullish momentum from the strong support region around $3,280–$3,300. Price has respected key structural points, forming a clean market structure with:
BOS (Break of Structure) confirming bullish intent after reclaiming prior resistance.
Bullish FVG (Fair Value Gap) acting as a liquidity zone for potential re-entries.
Multiple Higher Lows, highlighting strong buyer defense levels.
The chart indicates a possible short-term retracement into the $3,350–$3,357 entry zone, which aligns with demand structure. From this zone, buyers are expected to push toward the $3,400–$3,415 resistance target.
Key technical levels:
Entry Zone: $3,350–$3,357 (demand area)
Stop Loss: Below $3,340 to protect against deeper pullbacks
Take Profit: $3,400 psychological level and $3,414 structural resistance
Market Sentiment:
The combination of a strong support base, sustained higher lows, and bullish imbalance zones suggests a favorable risk–reward setup for long positions. A clean breakout above $3,415 could trigger a larger bullish leg toward the $3,440 resistance zone.
📈 Bias: Bullish above $3,350
💡 Watch for a reaction at the entry zone before committing to positions.

Review and plan for 12th August 2025 Nifty future and banknifty future analysis and intraday plan.
This video is for information/education purpose only. you are 100% responsible for any actions you take by reading/viewing this post.
please consult your financial advisor before taking any action.
----Vinaykumar hiremath, CMT

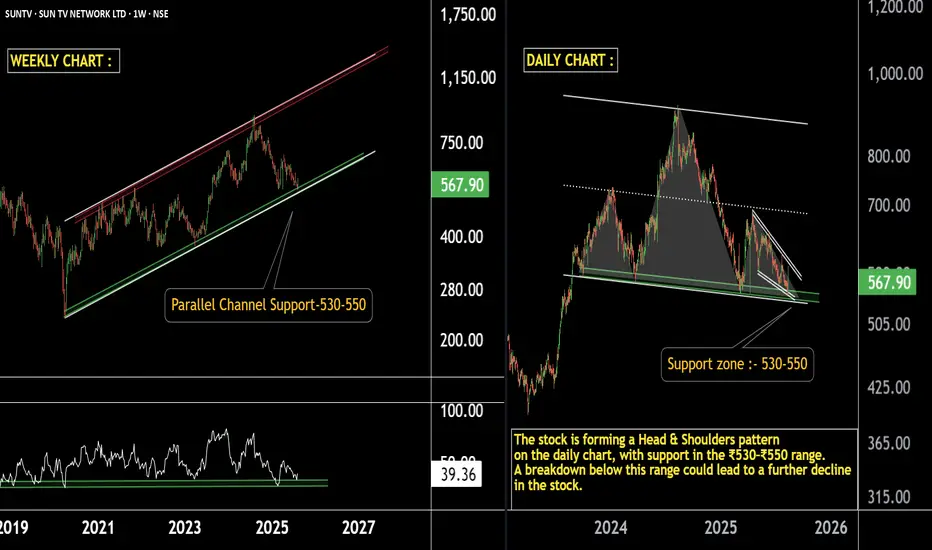
Support or Breakdown? Sun TV at Crucial JunctureSun TV Network – Technical Outlook
Weekly Timeframe:
The stock is trading near the parallel channel support zone of ₹530–₹550.
Weekly RSI indicates that the stock is taking support at this level.
Daily Timeframe:
The stock is also taking support around ₹530–₹550.
However, it is forming a Head & Shoulders pattern — a breakdown below this level could trigger a major fall.
If the ₹530–₹550 support zone holds, we may see higher prices in Sun TV Network.
Stay connected for further updates.
Thank you!!
USDJPYUSDJPY Is moving in range
Sell/Short from Resistance Buy/long from Support
This plans on playable befroe CPI data tomorrow / Untill Support Or resistance breaks, trade it between Support & Resistance
Manage risk as per your capital
support resistance
Candle stick cofirmation

Range, Gaps, and Whipsaws: Gold Awaits Its Next Big MoveThe final days of last week have been frustrating for Gold traders, to say the least.
Starting Thursday, when the price tested the waters around 3400, we entered a range — but not a calm one. The moves inside this range were sharp and violent: a quick rally to 3400 followed by an equally quick drop to the 3380 zone, and so on.
Even the final hours of Friday mirrored this behaviour, with Gold dipping to 3380 only to recover and close the week near 3400.
The Asian open a few hours ago brought another twist — a gap above 3400 that was quickly filled, followed by continued downside in what could be described as a classic “gap and crap” scenario.
From a chart perspective, the bigger picture is still unclear. We do, however, have two critical levels to watch:
• 3365 → important support
• 3400 → key psychological resistance and technical level
Until we get a clear and decisive break above or below one of these zones, direction remains uncertain.
Personal plan:
• I would avoid trading an immediate breakdown below support today — in such a case, I’d prefer to wait for the daily close before committing.
• On the other hand, if price pushes back towards 3400, I suspect we might finally see a breakout, so I’ll be preparing for long positions in that scenario.
For now, a wait-and-see approach seems most prudent.
Disclosure: I am part of TradeNation's Influencer program and receive a monthly fee for using their TradingView charts in my analyses and educational articles.

Weekly Market Outlook – Nifty & S&P 500 AnalysisNifty closed the week at 24,363, down 200 points from the previous week’s close, after making a high of 24,736 and a low of 24,337. As highlighted last week, Nifty traded exactly within my projected range of 25,000–24,100, but the negative takeaway is that it has now closed below the crucial support of 24,400.
If Nifty sustains below 24,300 next week, there is a strong probability of it testing 24,000/23,900 support levels. My outlook for the coming week: expect movement within 24,800–23,900, with a potential bounce from 24,000/23,900.
Interestingly, this marks the 6th consecutive week of Nifty closing lower — something that last happened 12 years ago in August 2013. Historically, after five straight weeks of selling, we usually see at least one green candle. If that bounce comes next week, my focus will be on whether selling resumes afterward or finally takes a breather.
Remember the timeless stock market wisdom:
“When everyone is fearful, be greedy. When everyone is greedy, be fearful.”
For long-term investors waiting for a dip, the opportunity is here — consider accumulating fundamentally strong companies for the long haul. Traders, brace for volatility.
S&P 500 Outlook:
The S&P 500 closed 150 points higher than last week, validating my prediction of holding 6,200. On the weekly chart, the index is showing signs of forming an M-pattern — a bearish setup. To negate this, the S&P 500 must sustain above 6,400, which could extend its rally towards 6,454/6,500 and the key Fibonacci level of 6,568.
However, if it fails to hold 6,400, we could see a retest of 6,225. Investors in U.S. markets should trail their stop-losses to protect gains.
Key Levels to Watch Next Week:
Nifty: Support – 24,000/23,900 | Resistance – 24,800
S&P 500: Support – 6,225 | Resistance – 6,454/6,500/6,568

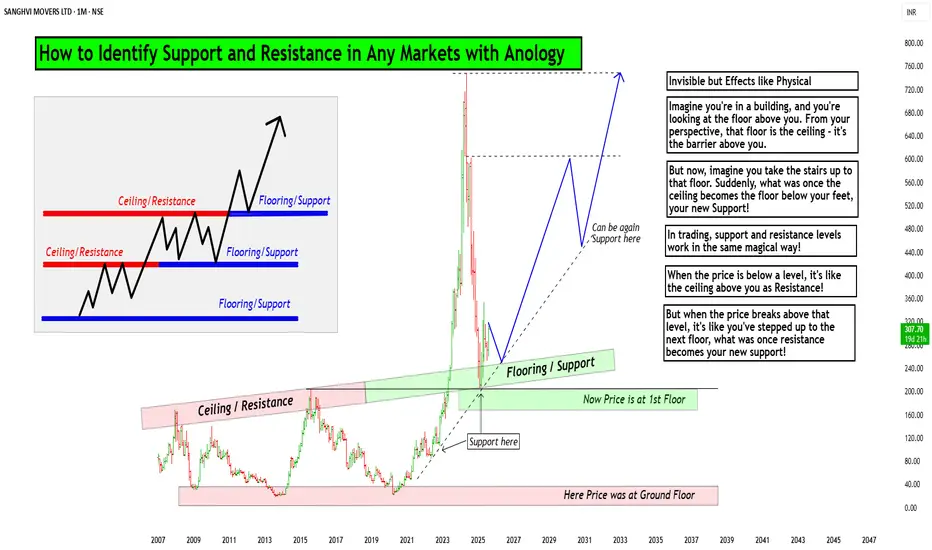
How to Identify Support and Resistance in Markets with AnologyHello Friends,
Welcome to RK_Chaarts,
Today we are going to learn & understand real work of Supports and Resistances in markets,
and Market structure with very good examples (Educational Post)
The Market's Architecture: Support and Resistance
This is an excellent analogy for understanding two of the most worthful concepts in technical analysis: support and resistance. By thinking of the market as a multi-story building, we can visualize how price moves and what happens when it hits certain levels.
- The Core Analogy: The Building and the Elevator
- Imagine the market as a large building with many floors. The price of an asset (like a stock or a cryptocurrency) is like an elevator moving up and down within this structure. The floors and ceilings of the building are not physical barriers but represent specific price points that the market has collectively agreed upon as important.
- The Floor (Support)
The floor of a building provides a solid base and prevents the elevator from falling further. In the market, this is called a support level. A support level is a price point where buying pressure is strong enough to stop the price from declining. When the "elevator" (price) reaches the floor, it finds enough buyers to give it a lift, preventing a deeper fall. A strong support level is like a thick concrete floor—it has been tested multiple times and holds firm, showing that there is significant demand for the asset at that price.
- The Ceiling (Resistance)
- The ceiling of a building sets the upper limit for the elevator's movement on a given floor. This is the market's resistance level. A resistance level is a price point where selling pressure is strong enough to prevent the price from rising further. When the "elevator" hits the ceiling, it encounters a large number of sellers who are ready to take profits, pushing the price back down. A strong resistance level is like a low ceiling—the price hits it and retreats, indicating that many investors believe the asset is overvalued at that point.
Breaking Through: New Levels
The most dynamic part of the analogy is what happens when the elevator breaks through a floor or ceiling.
Breakout (Breaking the Ceiling):
When the price has enough momentum to push through the resistance level (the ceiling), it has essentially moved to a new, higher floor. This is a significant event. The old ceiling, which was previously a barrier, now becomes the new floor. This is a key trading principle: old resistance often becomes new support. The market has established a new, higher trading range, and if the price falls back to that level, it will likely find buyers there, who now see it as a good value.
Breakdown (Breaking the Floor):
Once if price falls from that floor (Support level) which is called as Breakdown in technical language, then lower floor can be the next stop for elevator (Next Support for price), The old floor, which once provided support, now becomes a new ceiling. This is the reverse principle: old support often becomes new resistance. If the price tries to rally back up, it will likely get stuck at this old support level, as it's now seen as a good place to sell.
Structural Integrity (Volume)
Think of market Volume like a construction team. When a lot of people are involved (high volume), the structure is stronger.
Imagine a ceiling in the market. If lots of buyers (high volume) break through it, that's like a robust construction team building a new floor. It's unlikely to collapse.
On the other hand, if sellers break through a floor with high volume, that's a strong sign they're serious about the downward move.
But if the volume is low, it's like a weak construction team. Even if they break through, the move might not last. It's like a flimsy wall that could easily be reversed.
So, volume gives us a sense of whether the market's moves are strong and reliable, or weak and likely to change.
I am not Sebi registered analyst.
My studies are for educational purpose only.
Please Consult your financial advisor before trading or investing.
I am not responsible for any kinds of your profits and your losses.
Most investors treat trading as a hobby because they have a full-time job doing something else.
However, If you treat trading like a business, it will pay you like a business.
If you treat like a hobby, hobbies don't pay, they cost you...!
Hope this post is helpful to community
Thanks
RK💕
Disclaimer and Risk Warning.
The analysis and discussion provided on in.tradingview.com is intended for educational purposes only and should not be relied upon for trading decisions. RK_Chaarts is not an investment adviser and the information provided here should not be taken as professional investment advice. Before buying or selling any investments, securities, or precious metals, it is recommended that you conduct your own due diligence. RK_Chaarts does not share in your profits and will not take responsibility for any losses you may incur. So Please Consult your financial advisor before trading or investing.
EURCHF: Likely pullback at resistanceI am watching for a reversal EURCHF, expecting a rejection with a target at around 0.93550.
This area is where it can become a decision point: either price bounces, or it breaks above and the move can start to go higher.
I'll be watching for confirmation: not just in candlestick structure, but also in volume behavior.

SOLUSD📉 SOLUSD – Resistance Rejection (Sell Call)
🔄 LHs & LLs in formation
🔍Intant sell Book Partial profits
🎯 Entry: 🔽 Marked on chart
🛡 SL: ⛔ Marked on chart
💰 TP: 🎯 Marked on chart

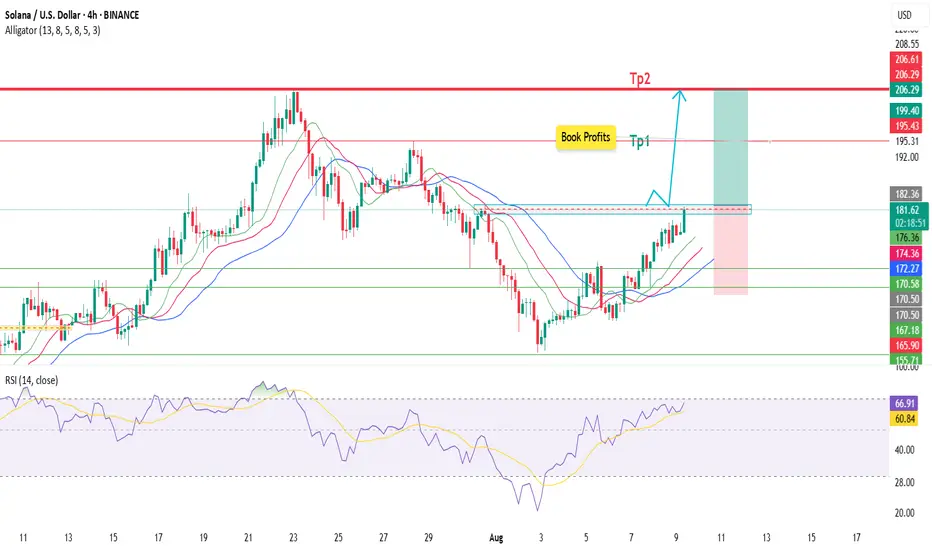
SOLUSD🐊 SOLUSD – Alligator Entry (Buy Call)
📈 HHs & HLs in formation
🔍 Wait for resistance breakout ➡️ retest ➡️ bullish candle confirmation
🎯 Entry: 🔼 Marked on chart
🛡 SL: ⛔ Marked on chart
💰 TP: 🎯 Marked on chart