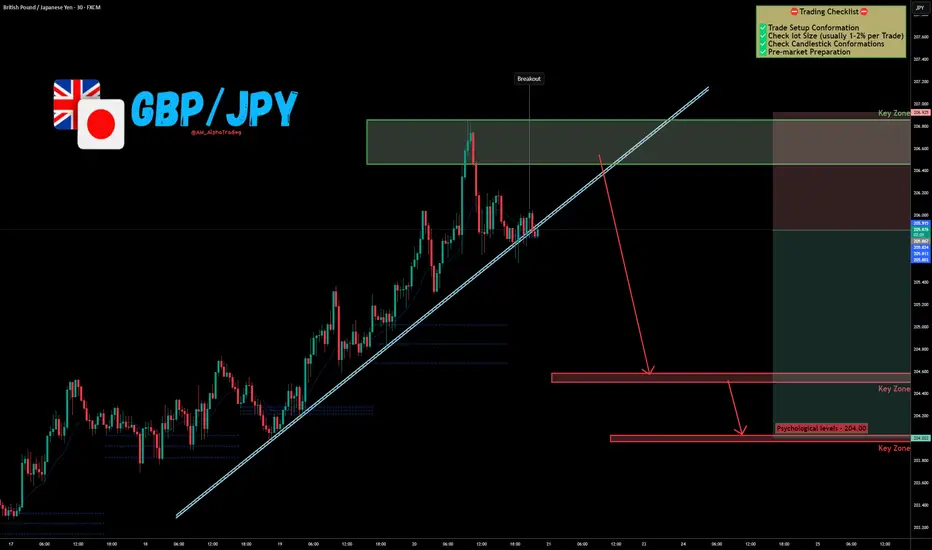
GBP/JPY Rejection at Supply → Next Stop: 204.00 !The GBP/JPY Pair, Price has been trading within a Trendline Breakout on the M30 chart, forming consistent lower highs and lower lows. Price action is now testing the lower boundary of the pattern, signalling a possible breakdown.
✅Market Context:
1️⃣Downward structure building inside the pattern.
2️⃣Sellers are showing strength near support levels.
3️⃣Breakdown below the trendline indicates momentum continuation toward lower zones.
✅Trade Plan :
Entry: Sell after confirmed breakdown below the support (Candle close below trendline or retest of the breakout).
💰Take Profit (TP): At the Key Zone – major support area identified ahead.
🛑Stop Loss (SL): Above the pattern structure / recent swing high.
✅Psychological Discipline:
1️⃣Stick to plan – No Revenge Trades.
2️⃣Accept losing trades as part of the strategy.
3️⃣Risk only 1–2% of your account balance per trade.
✅ Support this analysis with a
LIKE 👍 | COMMENT 💬 | FOLLOW 🔔
It helps a lot & keeps the ideas coming!
⚠️ Disclaimer: This analysis is for educational purposes only and does not constitute financial advice. Forex trading involves high risk. Trade only with capital you can afford to lose and always do your own research.
Supportandresistancezones
XAU/USD Intraday Plan | Gold Under Pressure, 4,078 Remains KeyGold delivered choppy price action yesterday due to the news releases, with buyers failing to break above the 4078 resistance. The metal has now slipped lower and is currently testing the upper boundary of the Support Zone.
With price still holding below both the MA50 and MA200, the sellers maintain the short-term advantage, as these moving averages continue to act as dynamic resistance.
For buyers to step back in, we need to see a clean recovery above 4053 and then a confirmed break of the key 4078 level for buyers to attempt a move toward 4115.
If selling pressure remains, a full test of the Support Zone (4027-3996) is likely. A break below this area could trigger a deeper correction into the HTF Support Zone (3968-3921).
📌 Key levels to watch:
Resistance:
4053
4078
4115
Support:
4027
3996
3968
3921
🔎Fundamental focus:
A batch of U.S. data — including Flash PMI and Consumer Sentiment revisions — could bring volatility after yesterday’s choppy moves.
We also have political headlines and Fed speakers throughout the day, which may add intraday swings as markets react to fresh news.

Is Apple Stock $APPL About To Crash Hard?Apple. Yes, one of the most liquid, most loved, and most worshipped stocks on the planet is about to teach retail traders a very expensive lesson. And no, you don’t need fundamentals, Bloomberg breaks, or Tim Cook whispers. You just need supply and demand imbalances, price action… and a little patience — the hardest skill ever created by nature.
Let’s dive into why AAPL could drop like a stone straight into the next monthly demand level. And yes… smaller timeframes can turn us into absolute dummies, so today I’ll save you from yourself.
Apple. The king of liquidity. The heavyweight champion of market capitalization. The stock that every beginner wants to buy… usually at the worst possible moment, of course.
And today, we’re going to talk about what really matters for the next years — the monthly supply and demand structure, not the tiny little M15 candles that make us behave like confused chickens.
Why Apple Is Setting Up a Major Drop (Again)
AAPL has been in a long-term bullish trend for years, but what many traders forget is this:
👉 Rallies eventually need to correct.
👉 Big imbalances act like magnets.
👉 Smaller timeframe “signals” make people behave like total dummies.

Moving sideways and waiting for a breakout🔍 1. Descending Trendline (red line)
This is an important dynamic resistance.
Price has touched the descending trendline many times and been rejected → the overall trend still leans bearish.
Each retest of the trendline that fails to break gives a sell signal.
👉 Only when price closes above the descending trendline will the short-term trend have a chance to reverse.
🟦 2. Upper Resistance (light blue zone)
This is the area where the market previously made a strong reversal → strong supply zone.
If price breaks the trendline and moves toward this zone, it is a high-probability area where selling pressure may appear again.
🟩 3. Key Support (green zone)
Price has reacted many times at this support zone → strong support.
This is also where price can form a reversal pattern if buyers return.
👉 If price breaks below this support, the bearish trend will continue strongly toward the lower support zone.
🔄 4. Trading Scenarios
Scenario 1: Breakout of the descending trendline → Price moves up to resistance
Price may bounce from the current support area → move up to retest the descending trendline.
If the trendline is broken and retested successfully → target is the major resistance zone above.
For BUY:
Wait for a break & retest of the descending trendline.
BUY GOLD : 4000 - 3998
Stoploss : 3988
Take Profit : 100-300-500pips
SELL GOLD : 4130 - 4132
Stoploss : 4142
Take Profit : 100-300-500pips

EUR/CAD - Bearish Flag (20.11.2025)🧠 Setup Overview TICKMILL:EURCAD
EUR/CAD is forming a clean Bearish Flag Pattern after a strong impulsive drop.
Price is trading below the EMA, inside a rising corrective channel — a classic continuation structure. With cloud resistance above and repeated rejections from the upper flag boundary, bearish momentum is building. A confirmed breakdown below the lower trendline could trigger the next bearish leg.
📊 Trading Plan🔻 Sell Bias (Primary Scenario)
Watch for a candle break & retest below the flag
Enter short after confirmation
🎯 Targets:
1st Support: 1.6137
2nd Support: 1.6109
❌ Invalidation:
A strong candle close above 1.6230 cancels the bearish view
⚡ Fundamental Outlook – Today (20 Nov 2025)
CAD Fundamentals
1️⃣ Canadian Dollar strengthened as crude oil prices saw a mild rebound, supporting CAD (commodity-linked currency).
2️⃣ Bank of Canada remains cautious, but no new signs of easing have emerged — giving CAD some underlying firmness.
EUR Fundamentals
3️⃣ Euro under pressure due to rate-cut expectations in early 2026 as European economic data remains soft, especially in manufacturing.
4️⃣ Risk-off sentiment pushes flows toward safer currencies, indirectly affecting EUR negatively.
➡️ Fundamentals support a continuation move lower for EUR/CAD.
#EURCAD #Forex #BearishFlag #PriceAction #TechnicalAnalysis #EUR #CAD #ForexTrader #TradingSetup #KABHI_TA_TRADING #ChartsDontLieTradersDontQuit #TradingViewCommunity #SupportAndResistance #BreakoutStrategy
⚠️ Disclaimer
This analysis is for educational purposes only.
Not financial advice — always use proper risk management.
💬 Support My Work ❤️
If this setup helps you:👍 LIKE the post💬 COMMENT your view🔔 FOLLOW for daily setups
Your support motivates me to keep posting high-quality analysis!

MGNT Short 5M Conservative CounterTrend DaytradeConservative CounterTrend trade
+ short impulse
+ resisting bar test level
+ 1/2 correction
+ weak approach
+ biggest volume 2Ut-
- manipulation signal configuration needs a test
Calculated affordable virtual stop
1 to 2 R/R take profit
1H Countertrend
"- long impulse
+ volumed TE / T1
+ weak approach
+ biggest volume 2Ut-"
1D Trend
"+ short impulse
+ BUI level
+ 1/2 correction
+ resistance level
- volumed retest"
1M
Trend
"+ short impulse
= neutral zone type 2
+ continuation of the trend"
1Y CounterTrend
"- long impulse
- T2 level
- support zone
- 1/2 correction
- biggest volume Sp?
+ model doesn't work"

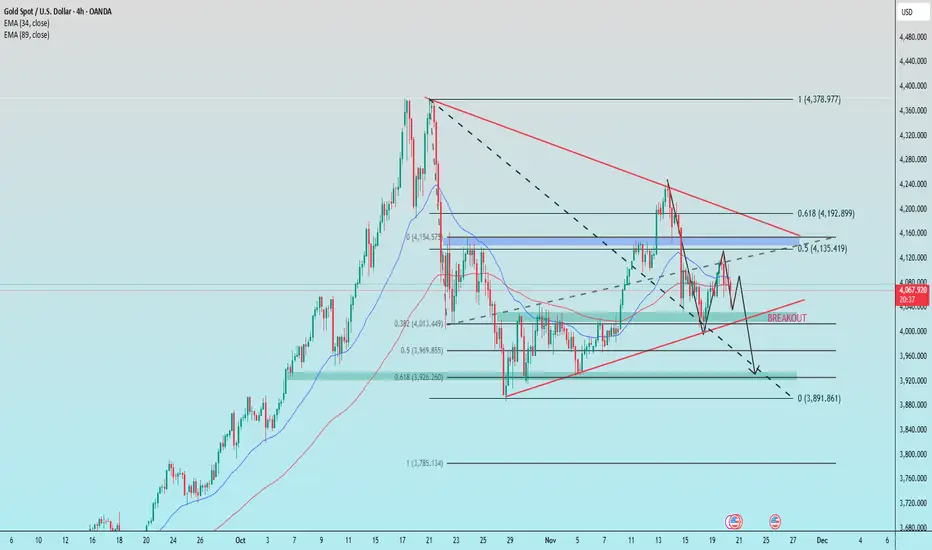
NONFARM returns after many days of closure1. Trendline
Descending trendline (upper): Strong dynamic resistance, price is repeatedly rejected → main trend remains bearish.
Ascending trendline (lower): Dynamic support, but has just been broken downward → buying pressure is weakening.
2. Key Support Levels
3,926 – 3,969 (Fibo 0.5–0.618): Strong confluence zone, the main target if the ascending trendline breaks.
3,891 (Fibo extension 1.0): Deep support, potential area for a short-term bottom.
3. Key Resistance Levels
4,135 – 4,155 (Fibo 0.5 + supply): Strongest resistance, price faced strong rejection here.
4,192 – 4,200 (Fibo 0.618): Higher resistance, aligned with the descending trendline → strong selling confluence.
Trade Ideas
BUY GOLD : 3948 – 3950
Stoploss: 3938
Take Profit: 100–300–500 pips
SELL GOLD : 4148 – 4150
Stoploss: 4160
Take Profit: 100–300–500 pips
AUDUSD: Complexity is in it's peak!Dear Traders, The Aussie is not easy to trade these days! However, I've been asked for an analysis. I suggested to risk less than an ordinary trade!
This is the daily chart
We might have seen newly form bearish channel! However, it might be just a correction!
We'll see
While we are ready for long in this setup!
A shorting from here with stop-loss over the bearish trendline is also considerable.

GBP/USD - Fundamental Ahead - UK Tax & Upcoming Budget The GBP/USD Pair, Price has been trading within a wedge Pattern on the H1 chart, forming consistent lower highs and lower lows. Price action is now testing the lower boundary of the pattern, signalling a possible breakdown. FPMARKETS:GBPUSD
✅Market Context:
1️⃣Downward structure building inside the pattern.
2️⃣Sellers are showing strength near support levels.
3️⃣Breakdown below the trendline indicates momentum continuation toward lower zones.
✅Trade Plan:
Entry: Sell after confirmed breakdown below the support (Candle close below trendline or retest of the breakout).
💰Take Profit (TP): At the Key Zone – major support area identified ahead.
🛑Stop Loss (SL): Above the pattern structure / recent swing high.
✅Psychological Discipline:
1️⃣Stick to plan – No Revenge Trades.
2️⃣Accept losing trades as part of the strategy.
3️⃣Risk only 1–2% of your account balance per trade.
✅ Support this analysis with a
LIKE 👍 | COMMENT 💬 | FOLLOW 🔔
It helps a lot & keeps the ideas coming!
⚠️ Disclaimer: This analysis is for educational purposes only and does not constitute financial advice. Forex trading involves high risk. Trade only with capital you can afford to lose and always do your own research.

GBP/USD - Triangle Breakout (18.11.2025)🧠 Setup Overview
GBP/USD has broken below the triangle structure, signaling a shift toward bearish momentum after repeated rejections from the upper trendline.
Price is sitting under the breakout region, indicating that sellers are gaining control.
With fundamentals supporting USD strength, the downside continuation scenario looks favorable.
📊 Trading Plan🔻 Primary Bias: Sell
Wait for a retest & rejection near the triangle support-turned-resistance
Look for continuation toward the lower support zones
🎯 Targets:
1st Support: 1.3091
2nd Support: 1.3062
#GBPUSD #Forex #TechnicalAnalysis #PriceAction #TriangleBreakout #BearishBias #USD #GBP #ForexSignals #TradingView #KABHI_TA_TRADING #ChartsDontLieTradersDontQuit #FXMarket #TrendlineBreak #SupportAndResistance
⚠️ Disclaimer
This analysis is for educational purposes only and does not constitute financial advice.
Always follow your confirmation signals and risk management rules before trading.
💬 Support My Work ❤️
If this analysis helps you: 👍 LIKE💬 COMMENT🔔 FOLLOW
Your support motivates me to post more clean and consistent chart breakdowns!

XAU/USD Intraday Plan — Critical Resistance AheadGold has shown a strong recovery from the Support Zone, reclaiming the 50MA and breaking above the 4078 resistance, which has now flipped into support. Price is currently trading around 4095, but the 200MA is acting as immediate resistance.
For buyers to continue higher, we need a clean break above 4115, the next key resistance. A confirmed break above this level would open the path toward 4170 and 4232.
If price fails to clear 4115, we could see a rejection back toward the 4078–4053 immediate support area. A break below that zone would expose a deeper pullback into the Support Zone again.
📌 Key Levels to Watch
Resistance:
4115
4170
4232
Support:
4078
4053
4027
3996
🔎Fundamental Focus:
The key event today is the FOMC Meeting Minutes, which could spark volatility depending on whether the tone appears more hawkish or dovish. Traders will be watching closely for clues on upcoming policy direction.

GBP/CAD - Triangle Breakout (17.11.2025)🧠 Setup Overview
GBP/CAD has broken below a symmetrical triangle, signaling a potential bearish continuation after repeated rejections from the upper trendline. The pair is now trading under the breakout level, with sellers showing strong control. If bearish momentum continues, the next support zones become key targets.
📊 Trading Plan 🔻 Bearish Scenario (Primary Bias)
Look for a clean breakdown retest and rejection for confirmation
Bearish continuation expected toward the support areas below
🎯 Targets:
1st Support: 1.8335
2nd Support: 1.8287
⚡ Fundamental Outlook — Today (17 Nov 2025)
GBP Sentiment – The Pound remains under pressure as markets expect the Bank of England to stay cautious, given ongoing inflation uncertainty and slowing economic data.
CAD Sentiment – The Canadian dollar stays supported by stable Bank of Canada policy and improving expectations around the energy sector.
– Rising US bond yields indirectly support CAD’s strength through its correlation with risk-on flows.
➡️ Overall: Fundamentals align with the bearish bias on GBP/CAD.
#GBPCAD #Forex #TechnicalAnalysis #TriangleBreakout #PriceAction #CAD #GBP #ChartPatterns #ForexTrader #TradingView #KABHI_TA_TRADING #ChartsDontLieTradersDontQuit #BearishSetup #MarketOutlook #FXMarket
⚠️ Disclaimer
This analysis is for educational purposes only and not intended as financial advice.
Always wait for confirmation and follow your risk management rules.
💬 Support My Work ❤️
If this helped you:
👍 LIKE, 💬 COMMENT, and 🔔 FOLLOW
Your support encourages more clean chart breakdowns & daily setups!

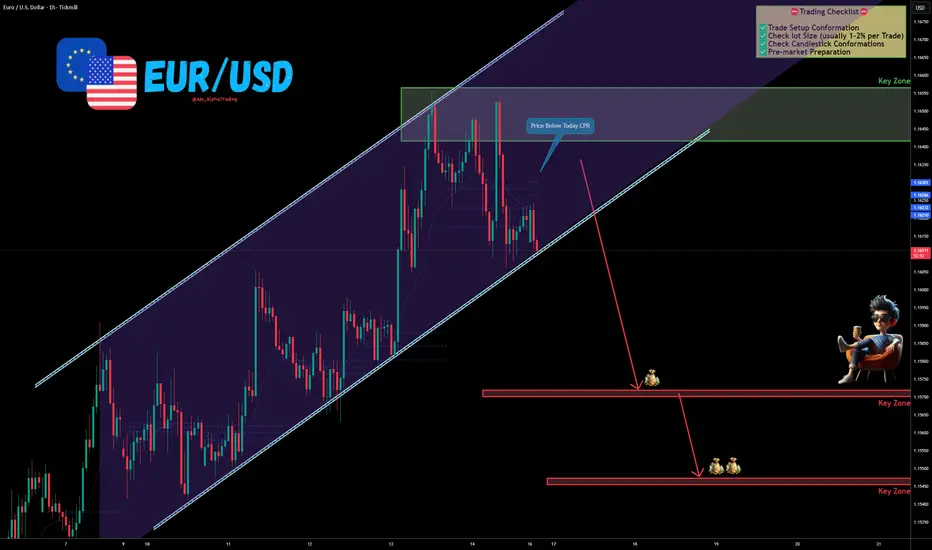
EUR/USD – Channel Breakdown Possibility | CPR Rejection Signals The EUR/USD Pair, Price has been trading within a Channel Pattern on the H1 chart, forming consistent lower highs and lower lows. Price action is now testing the lower boundary of the pattern, signalling a possible breakdown.
✅Market Context:
1️⃣Downward structure building inside the pattern.
2️⃣Sellers are showing strength near support levels.
3️⃣Breakdown below the trendline indicates momentum continuation toward lower zones.
✅Trade Plan:
Entry: Sell after confirmed breakdown below the support (Candle close below trendline or retest of the breakout).
💰Take Profit (TP): At the Key Zone – major support area identified ahead.
🛑Stop Loss (SL): Above the pattern structure / recent swing high.
✅Psychological Discipline:
1️⃣Stick to plan – No Revenge Trades.
2️⃣Accept losing trades as part of the strategy.
3️⃣Risk only 1–2% of your account balance per trade.
✅ Support this analysis with a
LIKE 👍 | COMMENT 💬 | FOLLOW 🔔
It helps a lot & keeps the ideas coming!
⚠️ Disclaimer: This analysis is for educational purposes only and does not constitute financial advice. Forex trading involves high risk. Trade only with capital you can afford to lose and always do your own research.
KHC Short 5M Aggressive Trend DayTradeAggressive Trend Trade
- long impulse
- unvolumed T1
+ resistance zone
+ biggest volume 2Ut+
+ weak test
+ first bearish bar closed entry
Calculated affordable virtual stop loss
Bought puts
1 to 2 R/R take profit
1H Trend
"+ short impulse
+ BUI level
+ resistance zone
+ 1/2 correction
- strong approach"
1D Trend
"+ short impulse
+ BUI test / T2 level
+ resistance zone
+ volumed 2Ut+"
1M Trend
"+ short impulse
= neutral zone 2"
1Y
Trend
no context

XAU/USD Intraday Plan – Watching Reaction at Support ZoneAfter a brief consolidation yesterday, gold dropped into the Support Zone and is currently trading around 4014. Market structure remains bearish, with price sitting below both the MA50 and MA200. The series of rejection wicks shows buyers are trying to push back, but momentum is still with the sellers for now.
The first resistance is at 4027. For buyers to gain traction, we need a clean break above 4027, followed by a break above 4053 — only then could we see an attempt toward 4078.
If price fails to hold the Support Zone and breaks below 3,996, the next downside target becomes the HTF Support Zone — a major area where buyers have reacted strongly in the past.
📌Key levels to watch:
Resistance:
4027
4053
4078
Support:
3996
3968
3921

What will be the next gold trend on November 18th?1. Trend and Trend Lines
Prices are trading below a major descending trend line.
→ The overall trend remains down.
The long-term ascending trend line (red) has already broken out,
signaling weakening buying pressure and increased downward pressure.
2. Key Resistance
4.103 – 4.105:
Strong resistance zone where the Fibonacci (0.618–0.5), horizontal resistance, and EMA overlap.
→ Selling is likely to reassert itself in this price range.
3. Key Support
3.932 – 3.940:
This is the strongest support zone, overlapping the Fibonacci extension at 2.618.
This is an important low point in the bearish structure.
4. Price Scenario
If prices fail to retest the resistance at 4.103,
→ A continued decline along the downward trend is likely.
The next target is around 3.932 – 3.950.
Summary
Major Trend: Downward
Strong Resistance: 4.103 – 4.105
Target Support: 3.932 – 3.950
Structure: Trendline Break + Fibo Extension → Prefer Downward Scenario
BUY GOLD: 3932 – 3930
Stop Loss: 3922
Take Profit: 100–300–500 pips
SELL SCALP GOLD: 4064 – 4066
Stop Loss: 4073
Take Profit: 100–300–500 pips
SELL GOLD: 4103 – 4105
Stop Loss: 4115
Take Profit: 100–300–500 pips

EURUSD - Support Hold & Break of Structure – Long Setup ActivePrice has been moving in a downward trend with a clean descending trendline respected across multiple sessions (Tokyo → London). However, the market has now reached a major support zone, where buyers previously stepped in aggressively.
Key Technical Highlights
🔹 Support Zone (Demand Area):
Price reacted strongly from the marked support region, signaling fresh buy orders entering the market.
🔹 Trendline Break:
The latest bullish impulse has broken the descending trendline, indicating a potential shift in short-term structure.
🔹 CHoCH + BOS Signals:
A clear CHoCH followed by bullish BOS confirms that buyers are gaining control after the prolonged downtrend.
🔹 Session Context (Tokyo):
During Tokyo, price created a consolidation range before breaking out impulsively—often a sign of liquidity being taken before a directional move.
Entry Zone
Price is expected to continue
Discount price level within the swing
Support continuation area
Bullish Target
The bullish target is positioned near 1.16300, where major liquidity and imbalance reside.

XAUUSD | Trendline Squeeze at Support – Big Move LoadingPrice continues to trade within a descending structure, respecting a clear trendline acting as dynamic resistance. Each retest of the trendline has produced lower highs, confirming bearish order flow.
Key Observations
🔹 Support Zone (Demand Area):
Price is currently resting inside a strong support zone highlighted in red. This zone has previously generated bullish reactions, but recent candles show weakening demand.
🔹 Break of Structure (BOS):
Multiple BOS levels confirm bearish momentum, suggesting sellers are still in control.
🔹 Weak Low Formation:
The recent low is labeled as weak, indicating it may be targeted for liquidity before a potential reversal.
🔹 Tokyo Session Range:
Price consolidated during Tokyo, forming a small distribution inside the trendline.
Possible Scenarios
📈 Bullish Scenario
If price rejects the support zone strongly and breaks above the descending trendline, we could see a bullish retracement toward the Strong High, targeting the upper yellow target zone (≈ 4080–4100).
📉 Bearish Scenario
If support fails and price breaks below the weak low, expect continuation downward into the lower target zone (≈ 3940) where liquidity sits.
Bias
Short-term bearish as long as price remains under the trendline.
Potential bullish reversal only if structure shifts (ChoCH/BOS to the upside).

EUR/USD - Ascending Triangle (17.11.2025)🧠 Setup Overview TICKMILL:EURUSD
EUR/USD has formed an ascending triangle, but instead of breaking upward, price failed at the horizontal resistance and slipped below the rising trendline — signaling potential bearish reversal. The pair is rejecting the 1.1650–1.1660 supply zone, and downside momentum is building as fundamentals shift in favor of USD strength.
📊 Trading Plan🔻 Bearish Scenario (Primary Bias)
Look for trendline retest rejection for confirmation
Expect continuation to the downside toward key support zones
🎯 Targets:
1st Support: 1.1581
2nd Support: 1.1561
🔰 Resistance Zone: 1.1650 – 1.1660
⚡ Fundamental Updates (Today – 17 Nov 2025)
1️⃣ Fed officials remain cautious about easing policy due to persistent inflation risks.
• This reduces the chances of a near-term rate cut → USD strengthens.
2️⃣ U.S. government bond yields rise as investors move into safer assets during stock market weakness.
• Higher yields = stronger USD → bearish pressure on EUR/USD.
These fundamentals align with the technical breakdown, supporting further downside.
#EURUSD #Forex #TechnicalAnalysis #PriceAction #AscendingTriangle #BearishSetup #USD #EUR #FundamentalAnalysis #ForexSignals #TradingView #KABHI_TA_TRADING #ChartsDontLieTradersDontQuit #FXMarket #TrendlineBreak #SupplyZone
⚠️ Disclaimer
This is not financial advice.All content is for educational purposes only. Always confirm signals and apply strict risk management before entering trades.
💬 Support My Work ❤️
If this analysis helps you —
👍 Like 💬 Comment 🔔 Follow
Your support motivates me to post more daily setups & clean chart analysis!

SOL — Deep Pullback Into Major SupportSOL has been in a steady freefall over the past weeks. On the higher timeframes the key support and resistance zones are very clearly defined. The $250 level acted as a big resistance area, with multiple rejections showing sellers were firmly in control up there.
On the downside, the $125 support zone has shown clear strength, with bulls defending this area and producing strong bounces each time price revisited it.
The swing low at $126 presents an attractive long opportunity, especially with the sell-side liquidity and the quarterly level at $124.54 sitting just below, adding further confluence. Additionally, the anchored VWAP from the $8 low lies around $114, aligning almost perfectly with the 0.886 Fibonacci retracement at $113.3, providing deeper support should price extend lower.
Long Entry Zones:
0.786 Fib: $129.13
0.886 Fib: $113.3
Why the 0.786–0.886 Zone Is a Major Reversal Area
The 0.786–0.886 Fib zone is one of the best spots to look for a reversal after a deep pullback. It’s where strong trends often take their final dip before bouncing.
Here’s why it works so well:
It’s the typical “deep correction” zone in strong trends.
Price usually sweeps sell-side liquidity here before reversing.
Many harmonic patterns use this exact area as their turning point.
It often lines up with anchored VWAPs or volume nodes, adding extra support.
It’s basically the capitulation zone where weak hands exit right before a bounce.
Overall, it’s a clean area with clear invalidation and great R:R → perfect for spotting high-probability reversal setups.
_________________________________
💬 If you found this helpful, drop a like and comment!

Support and resistance key guide (Volume, Trendlines, FVG, MA)Support and resistance key guide (Volume, Trendlines, FVG, MA)
1️⃣ Importance of Support and Resistance in Highly Volatile Crypto Markets
The cryptocurrency market operates 24/7/365, exhibiting far greater volatility than traditional financial markets. This volatility presents substantial profit opportunities, but it also triggers intense fear and greed among investors, creating significant psychological stress.
Support and resistance serve as key milestones in this chaos, signaling zones where price reactions are likely. Beyond mere technical analysis, they reflect the collective psychology of countless traders. Understanding them is essential for success in crypto trading.
2️⃣ The Nature of Support and Resistance and Their Psychological Basis
Support and resistance occur where buying and selling pressures strongly collide, slowing or halting price movement.
Support:
At this level, buyers see the asset as "cheap enough!" and stand ready, forming a psychological and physical barrier against further decline. Additionally, traders previously trapped in losing positions may sell at breakeven, adding resistance against further drops.
Resistance:
At this level, sellers perceive the asset as "expensive enough!" and offload positions, while traders previously trapped at highs may sell with a "better late than never" mindset, limiting upward movement.
※ Meaning of Support/Resistance Breakouts and “Fakeouts”:
When a support level is breached, existing buyers may panic and trigger stop-loss selling. Conversely, breaking resistance may prompt buyers to enter, accelerating the trend.
However, some breakouts can be “fakeouts,” designed to exploit trader psychology. Premature chasing of such moves should be avoided.
3️⃣ Key Support and Resistance Pattern Analysis
📈 Trendlines and Consolidation Zones: The Psychology Behind Market Order
Trendlines: Trendlines visually represent the shared expectation among traders that price will move in a certain direction. Touching an upward trendline triggers “buy at a bargain” psychology, while touching a downward trendline triggers “it can’t go higher” sentiment.
Consolidation Zones (Boxes): These are zones where buying and selling pressures balance each other. Traders plan trades around these zones, dominated by the “waiting for breakout” psychology to capture significant moves.
📈 FVG (Fair Value Gap): Market Inefficiency and Smart Money Footprints
FVGs occur when the market moves too rapidly through a price range, leaving a “price gap.” They often reflect sudden activity by smart money (institutions, whales).
Gap Filling:
Markets instinctively avoid leaving incomplete states (FVGs) unaddressed. When price re-enters an FVG zone, the players who drove the prior rapid move may close or re-enter positions, forming support/resistance. Beginners can treat FVGs as smart money footprints and follow their activity strategically.
📈 Moving Averages (MA): Collective Psychology and Trend Direction
Moving averages reflect the average price perceived by the market over a period. Being widely monitored, they act as psychological support/resistance levels.
Short-term MA (e.g., 50MA): Reflects short-term trader sentiment. Price below it can trigger “short-term trend broken?” anxiety, while above it fosters optimism.
Long-term MA (e.g., 200MA): Represents long-term trader psychology and trend direction. Price below 200MA creates fear of a long-term downtrend, while above inspires hope of a sustained uptrend. When acting as support/resistance, MAs carry strong psychological consensus as a widely observed benchmark.
📈 POC (Point Of Control) Volume Profile: Market Consensus and the Power of Volume
POC is the price level with the highest traded volume over a period. It indicates market agreement on price, with substantial volume concentrated there.
Price below POC: POC becomes strong resistance. Buyers trapped in losing positions may sell at breakeven, and sellers actively resist upward moves.
Price above POC: POC acts as strong support. Buyers believe “price won’t fall below this level,” and prior sellers may switch to buying.
POC represents the market’s “expected price” and the zone where loss-aversion psychology is strongest.
📈 Fibonacci: Natural Order and Human Expectation
Fibonacci retracements apply golden ratio mathematics to charts, reflecting the expectation that price will reverse at certain levels, forming support/resistance.
These levels are not coincidental; many traders plan trades around them, causing real market reactions.
Levels like 0.5 (50%) and 0.618 (61.8%) are psychologically significant, viewed by traders as buying or selling opportunities. Support/resistance forms through “herd psychology,” as many act in unison.
📈 CME Gap: Institutional Moves and Market Regression Instinct
CME gaps occur in Bitcoin futures dominated by institutional investors. They happen when the spot market moves over weekends while futures are closed, and the market tends to “fill the gap.”
Gap Filling: CME gaps represent periods without institutional activity, prompting the market to normalize these “abnormal” price zones.
Traders anticipate “the gap will eventually be filled,” making these zones potential strong support/resistance, reflecting future-oriented market psychology.
4️⃣ Managing Trading Psychology Using Support and Resistance
Even the best tools are ineffective without psychological discipline.
Confirmation bias and stop-loss discipline: Ignoring losses due to selective perception leads to ruin. When support breaks, acknowledge your prediction was wrong and act decisively to exit.
Overbought/oversold psychology and FOMO:
Avoid chasing price surges out of fear of missing out (“everyone else is profiting, why not me?”).
During crashes, resist panic selling at the bottom. Base trades on your rules derived from support and resistance.
Partial trading for risk management:
Avoid buying all at support or selling all at resistance at once. Splitting trades across multiple support/resistance levels provides psychological stability and reduces the impact of wrong predictions.
5️⃣ Comprehensive Strategy Formation and Practical Application Tips
Multi-level Support/Resistance Confluence: Overlapping zones (e.g., Fibonacci 0.618 + 200MA + POC + FVG bottom) create very strong support/resistance. These reflect collective trader agreement and can be traded with higher confidence.
Volume Analysis and Support/Resistance Strength: High volume at a zone confirms its significance. Reliable breakouts require strong volume, showing market participation and intent.
Develop Your Own Trading Plan: Don’t blindly follow all patterns. Choose indicators and methods that suit you to establish personal trading rules. Adhering to these rules maintains psychological stability and long-term success.
If you found this content helpful, please show your support with a Boost (🚀) and a comment (💬)! Your encouragement is a great motivation for us to create better analyses and content. You can also follow us to receive notifications about new posts.
GBPJPY higher bullish expectations
OANDA:GBPJPY trend based analysis, currently price in ASCENDING TRIANGL, from here expecting higher bullish continuation.
SUP zone: 202.500
RES zone: 204.500, 205.000

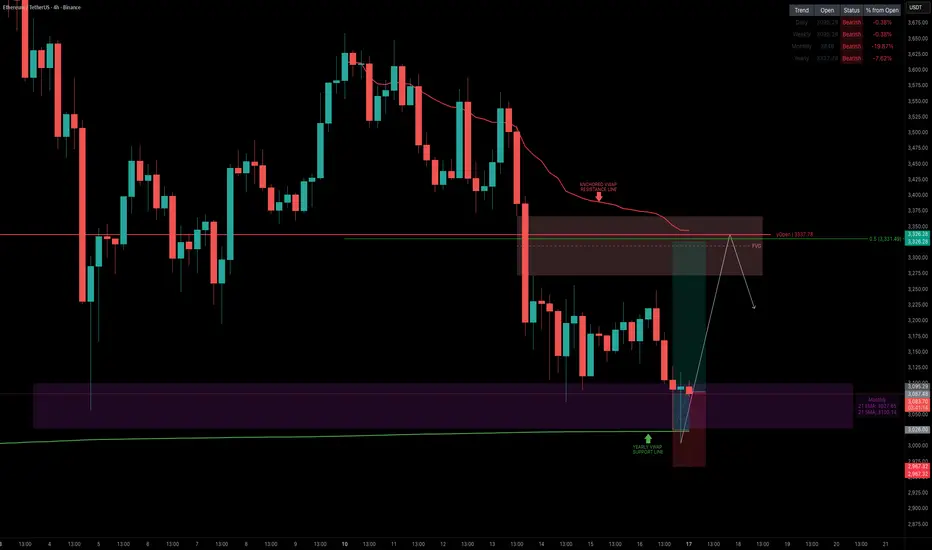
ETH — The $3,000 Rebound Zone: Multi-Confluence SupportETH has reached a key level around $3,000, a major psychological zone that also aligns with multiple high-timeframe supports. The yearly VWAP sits at $3,023.5, providing the first layer of confluence. Additionally, both the 21-month EMA ($3,028) and the 21-month SMA ($3,100) cluster tightly in this region, reinforcing it as a strong structural support zone.
This creates a long setup with a clear invalidation below the $3,000 level. The primary target is the 0.5 Fibonacci retracement at $3,331, which lines up closely with the yearly open at $3,337.78. This area also contains a fair value gap and the anchored VWAP, forming a solid resistance cluster and a logical take-profit zone.
Support and resistance levels are well-defined, and the trade structure is clean.
R:R ~1:5 if entering directly at the yearly VWAP support
R:R ~1:2 if entering at current price levels
Overall, ETH is positioned at a high-probability long zone with strong multi-confluence support and a clear upside target.
🔍 Indicators used
DriftLine — Pivot Open Zones → For identifying key yearly/monthly/weekly/daily opens that act as major S/R reference points
Multi Timeframe 8x MA Support Resistance Zones → to identify support and resistance zones such as the monthly 21 EMA/SMA.
VWAP
➡️ Available for free. You can find it on my profile under “Scripts” and apply it directly to your charts for extra confluence when planning your trades.
_________________________________
💬 If you found this helpful, drop a like and comment!