ETHUSDT H1 HTF Range Resistance and Bearish Continuation Setup📝 Description
BINANCE:ETHUSDT is consolidating below a descending HTF resistance trendline after failing to reclaim prior highs. Price is reacting inside a weak corrective structure, with upside moves lacking impulsive continuation and holding below key premium levels.
________________________________________
📈 Signal / Analysis
Primary Bias: Bearish while price remains capped below the H1 range high and descending trendline
Preferred Setup:
• Entry: 3,299
• Stop Loss: Above 3,307
• TP1: 3,286
• TP2: 3,274
• TP3: 3,253 (HTF liquidity / lower FVG)
________________________________________
🎯 ICT & SMC Notes
• Price trading below descending HTF resistance
• Upside moves classified as corrective retracements
• Liquidity resting below recent equal lows
• HTF FVG below remains unfilled and acts as a draw
________________________________________
🧩 Summary
As long as CRYPTOCAP:ETH fails to break and hold above the descending resistance and range high, the structure favors continuation toward lower liquidity pools and HTF PD arrays.
________________________________________
🌍 Fundamental Notes / Sentiment
Market sentiment remains cautious, with no clear bullish catalyst supporting sustained upside, increasing the probability of technical pullback continuation.
________________________________________
⚠️ Risk Disclosure
Trading involves substantial risk and may result in capital loss. This analysis is for educational purposes only and does not constitute financial advice. Always apply proper risk management, predefined stop-loss levels, and disciplined position sizing aligned with your trading plan.
Sweep

ETHUSDT M15 BPR Rejection and Short-Term Pullback Setup📝 Description
BINANCE:ETHUSDT has pushed back into a prior H1 BPR / liquidity zone after a strong recovery leg. The current move appears corrective, with price reacting near resistance rather than showing clean continuation strength.
________________________________________
📈 Signal / Analysis
Primary Bias: Bearish while price holds below the H1 BPR and recent high
Preferred Setup:
• Entry: 3,141
• Stop Loss: Above 3,148
• TP1: 3,134
• TP2: 3,121
• TP3: 3,093 (lower liquidity)
________________________________________
🎯 ICT & SMC Notes
• Rejection from H1 BPR signals supply presence
• No confirmed bullish BOS after the rally
• Downside liquidity remains unfilled
________________________________________
🧩 Summary
CRYPTOCAP:ETH is showing signs of rejection at resistance. As long as price remains capped below the BPR, a controlled pullback toward lower PD arrays is favored over upside continuation.
________________________________________
🌍 Fundamental Notes / Sentiment
This week’s US macro data supports a stronger USD and higher-for-longer rates, keeping liquidity tight for risk assets. In this environment, Ethereum remains vulnerable to downside, with bearish continuation favored and any short-term rebounds likely corrective rather than trend-changing.
________________________________________
⚠️ Risk Disclosure
Trading involves substantial risk and may result in capital loss. This analysis is for educational purposes only and does not constitute financial advice. Always apply proper risk management, predefined stop-loss levels, and disciplined position sizing aligned with your trading plan.

BTCUSDT H4 HTF Supply Rejection and Corrective Bearish Pullback 📝 Description
CRYPTOCAP:BTC is currently reacting inside a higher-timeframe H4 supply zone after a strong impulsive bullish leg. The recent upside move has stalled within HTF resistance, and price action shows signs of distribution rather than continuation. The structure suggests a corrective bearish phase developing within higher-timeframe PD arrays.
________________________________________
📈 Signal / Analysis
Primary Bias: Bearish while price holds below the H4 supply zone and recent rejection high
Preferred Setup:
• Entry: 91,400
• Stop Loss: Above 92,520
• TP1: 90,315
• TP2: 89,581
• TP3: 88,262 (HTF draw / lower liquidity)
________________________________________
🎯 ICT & SMC Notes
• Clear rejection from HTF H4 order block
• Current move classified as a corrective pullback within a broader range
• Lower liquidity pools remain unfilled and act as downside magnets
________________________________________
🧩 Summary
CRYPTOCAP:BTC is showing weakness after tapping a major H4 supply zone. As long as price remains capped below this HTF resistance, the expectation favors a controlled bearish pullback toward lower PD arrays before any potential re-accumulation or structural shift.
________________________________________
🌍 Fundamental Notes / Sentiment
Market sentiment remains neutral-to-slightly risk-off, with no strong bullish catalyst supporting continuation at current highs. In such conditions, reactions from HTF supply are more likely to extend into corrective bearish moves rather than immediate trend continuation.
________________________________________
⚠️ Risk Disclosure
Trading involves substantial risk and may result in capital loss. This analysis is for educational purposes only and does not constitute financial advice. Always apply proper risk management, predefined stop-loss levels, and disciplined position sizing aligned with your trading plan.

BNB H1 HTF FVG Rejection and Pullback Continuation Setup📝 Description
On the H1 timeframe, CRYPTOCAP:BNB has pushed into a higher-timeframe H4/H1 Order Block and overlapping H1–30m FVGs, where price is now showing hesitation. The recent upside move appears corrective within a broader range, with price trading in premium and reacting to unmitigated sell-side areas.
________________________________________
📈 Signal / Analysis
Primary Bias: Bearish below HTF Order Block
Preferred Setup:
• Entry: 907.5 (H1 FVG)
• Stop Loss: Above 912
• TP1: 901.9
• TP2: 890.8
• TP3: 880.2
________________________________________
🎯 ICT & SMC Notes
• Price reacting inside HTF Order Block (H4/H1)
• Clear H1–30m FVG rejection zone overhead
• Below-price liquidity and unfilled FVGs remain intact
________________________________________
🧩 Summary
CRYPTOCAP:BNB is currently trading in premium HTF territory, where sellers are expected to defend. Failure to reclaim and hold above the H1 FVG increases the probability of a pullback toward the 890 and 880 liquidity zones. This setup favors patience on shorts rather than chasing upside.
________________________________________
🌍 Fundamental Notes / Sentiment
Overall crypto sentiment remains mixed, with majors showing corrective behavior rather than strong impulsive continuation. In the absence of a clear risk-on catalyst, rallies into HTF supply are more likely to attract distribution.
________________________________________
⚠️ Risk Disclosure
Trading involves substantial risk and may result in capital loss. This analysis is for educational purposes only and does not constitute financial advice. Always apply proper risk management, predefined stop-loss levels, and disciplined position sizing aligned with your trading plan.

BTC - Shakeout Complete… Is the Trap Set???Bitcoin just delivered a classic manipulation move into the higher-timeframe demand zone❗️ The sharp sell-off below structure flushed late longs and triggered stops, only to be quickly reclaimed.
That’s not weakness. That’s intent.
📉📈From a structural perspective , this demand zone has already proven itself before. Price reacted strongly from it in the past, and once again, buyers stepped in aggressively after the sweep. This suggests the downside move was more about liquidity than genuine trend reversal.
⁉️ Now comes the key question.
⚔️As long as BTC holds above this demand and continues to build acceptance, the focus shifts to a recovery move back into the prior structure and supply zone above. That area will be the real test, whether this bounce is just a correction, or the start of a larger continuation.
For now, patience is key. Let price show its hand near demand before committing.
Is this the reset before the next leg higher, or just a temporary relief bounce? 🤔
⚠️ Disclaimer: This is not financial advice. Always do your own research and manage risk properly.
📚 Stick to your trading plan regarding entries, risk, and management.
Good luck! 🍀
All Strategies Are Good; If Managed Properly!
~Richard Nasr

Why Every Trend Begins and Ends With LiquidityEvery trend in crypto begins and ends with liquidity. Before a trend can move with force, the market must collect the stop orders that provide the fuel for expansion. These orders sit above equal highs, below equal lows, inside inefficiencies, and around obvious retail breakout levels. Price does not trend because sentiment magically aligns.
It trends because the market clears liquidity at one side of the structure and then expands toward the next pool. The earliest phase of any trend usually starts with a sweep: price reaches beyond a key high or low, triggers stops, absorbs the resting orders, and immediately snaps back. This wick is the first sign that the breakout attempt failed and that larger participants have used the liquidity to take positions.
Once liquidity is taken, the market shifts into structural progression. Higher highs and higher lows form not because traders collectively decide to buy, but because the market now has trapped sellers below the sweep, providing momentum as price moves toward the next logical liquidity target.
Structure becomes the visible footprint of this process. Impulse legs show aggression after liquidity collection, and pullbacks tend to remain orderly because the directional objective has not yet been completed.
Every trend is essentially a journey from one liquidity pool to the next, with structure simply describing how that journey unfolds.
The end of a trend is equally tied to liquidity. A trend rarely dies from weakening momentum alone. Instead, it typically completes when price reaches a major pool of opposing liquidity, often equal highs in an uptrend or equal lows in a downtrend.
The final move into that level is usually fast and dramatic, designed to trigger breakout traders while simultaneously running the stops of those holding late in the trend. Once the liquidity is collected, the market loses incentive to continue and snaps back inside the level, exposing the sweep as a terminal event rather than a continuation. This reversal wick marks the end of one trend and the beginning of the liquidity cycle in the opposite direction.
From there, the process repeats. Liquidity is taken. Structure shifts. Displacement confirms intention. A retest provides the entry. And the new trend begins by targeting the next liquidity pool in line.
When traders understand this cycle, trends become far easier to read. Direction is no longer based on hope, indicators, or isolated candles. It is built on recognising how liquidity motivates movement and how structure validates that movement.
Liquidity shows where the market wants to travel, structure shows how it gets there, and together they form a practical framework for identifying when trends are forming, when they are maturing, and when they are preparing to reverse.

AUDCAD – When Price Refuses to Come BackThis chart isn’t interesting because of what price did.
It’s interesting because of what price refused to do .
After a clear structural shift, AUDCAD printed a bullish breaker and then launched vertically. No hesitation. No overlap. No courtesy pullback. Just expansion.
That tells a very specific story.
This was not a market inviting participation.
This was a market escaping a price range .
The bullish breaker exists, but it was never mitigated . Price didn’t return to rebalance, didn’t test commitment, didn’t allow confirmation. That’s not accumulation — that’s urgency.
So even though the bias flipped bullish , the location never became tradable.
What followed was consolidation above the move — not inside it. That’s acceptance at higher prices, not demand being built below.
In other words:
Direction is clear
Intent is visible
Participation is missing
This is why I don’t confuse market intent with market opportunity .
Sometimes the market tells you:
“ I’m bullish — but you’re late. ”
And the correct response is not FOMO, not prediction, not forcing an entry —
it’s patience.
This chart stays on watch until price comes back to unfinished business , or until a new narrative forms.
This post is about location, behavior, and restraint — not a trade call.
— SmellyTaz
Decoding chaos
⚠️ This is not financial advice.

My prediction for future movement of USDCAD pairWith short word's.
The price in downtrend , and it have a older liquidity should be sweep. After weep all liquidity it will return back to daily FVG

Anticipate Movement Inside of a Range EnvironmentA large portion of crypto price action does not trend. It ranges. And for many traders, this is where the most capital is lost. A range environment feels simple on the surface price moves between two boundaries, but inside those boundaries, liquidity builds, traps form, and false signals appear constantly. Understanding how ranges behave is a core skill for developing consistency.
A range forms when the market fails to create meaningful higher highs or lower lows. Buyers and sellers balance out, and price oscillates between defined support and resistance. This compression is not random. It reflects indecision, accumulation, or distribution depending on the higher-time frame context. Traders who treat a range like a trend are the ones most often punished.
The first step is identifying the boundaries. Equal highs at the top of a range and equal lows at the bottom reveal where stops accumulate. These stops become liquidity pools. Price frequently sweeps one side of the range before moving to the other, trapping breakouts and fading momentum traders. A clean sweep is not the breakout; it is the intention-revealing event before direction is chosen.
Inside the range, structural signals lose reliability. Traditional trend tools cannot be applied. Instead, focus on behaviour at the edges: rejection wicks, failed breakouts, displacement after a sweep, and reclaim patterns. These reactions show whether a sweep is simply clearing liquidity or if a genuine expansion is developing.
Patience is critical. Entering in the middle of the range exposes you to noise, uncertainty, and poor reward-to-risk. The edge comes from waiting at the boundaries where liquidity sits and confirmation appears. A range can persist far longer than expected, so forcing trades inside it leads to frustration and unnecessary losses.
The real purpose of studying ranges is not just to trade them but to anticipate what follows. A compression phase often precedes expansion. When liquidity on one side is taken and price breaks structure with intent, the next directional leg becomes far easier to participate in. Ranges are where future trends prepare themselves.

USDJPY | Institutional Sells from HTF Supply Zone (Instant ExecuUSDJPY has tapped into a higher-timeframe supply zone that aligns with the weekly sweep and 4H CHoCH, confirming potential downside momentum.
After the recent BOS, price retraced back into the previous structural supply, forming an S&S pattern (sweep and shift) within the same zone.
The setup aligns with bearish intent from institutional order flow, suggesting smart-money distribution before the next leg down.
🔹 Execution: Instant market sell from 154.15–154.20
🔹 Stop-Loss: Above 154.55 (protected high)
🔹 Target: 152.80 (Realistic TP area)
🔹 Bias: Bearish continuation into lower liquidity zones
Technical Confluence:
• W1 sweep confirms distribution phase
• 4H CHoCH + BOS = structural shift bearish
• S&S rejection inside refined M30 supply
• Liquidity resting below recent lows (152.80)
This setup respects SMC principles — liquidity sweep → structural shift → premium entry — under institutional context.
💬 Monitor for a clean M15–M5 confirmation candle close to maintain precision entry and manage partials along the way.

XAUUSD shortGold showing short-term weakness we can take advantage of
✅ Bearish market
✅ Pullback to a good level
✅ Clipped resistance for short term sell
✅ Entry after trapped buyers
One thing to look out for is the pullback, that isn't fully convincing
General wisdom is less valuable than specific savvy

Liquidity Zones Explained: Where Smart Money GoesMarkets don’t move randomly. Every candle, spike, or reversal happens for a reason and that reason is liquidity.
Liquidity is what fuels price movement. It’s where buy and sell orders are concentrated, and where large players execute positions without showing their hand.
Understanding where liquidity lies gives traders a major advantage, because price doesn’t move to levels by accident. It moves there to fill orders.
Liquidity represents the pool of resting orders waiting to be filled — stop losses, pending buys, or sells.
When price reaches these areas, volume spikes, and the market finds enough counterparties for large players to enter or exit positions.
Liquidity isn’t just numbers on the book. It’s the invisible map of trader behavior:
– Stops above highs (where breakout traders get trapped)
– Stops below lows (where panic selling occurs)
– Consolidation zones (where both sides accumulate orders)
These areas become magnets for price movement.
When you see sharp wicks above or below key levels, it’s often not manipulation — it’s collection.
Smart money drives price into these zones to trigger stop losses and capture liquidity before reversing in the true direction.
The move looks random, but it’s calculated.
The goal is to fill large positions efficiently, using retail orders as exit liquidity.
Instead of chasing price, learn to wait for liquidity grabs.
The simplest method is to mark obvious highs and lows and observe how price reacts when those levels are taken.
If price breaks a key high but fails to continue — and momentum shifts back down — it’s often a sign of a liquidity sweep, not a breakout.
These moments reveal where the real players are positioning themselves.
Trading liquidity is about reaction, not prediction.
Liquidity zones reveal where traders are trapped and where professionals engage.
If you stop focusing on where price is and start paying attention to why it moves there, you’ll see the market with far more clarity.

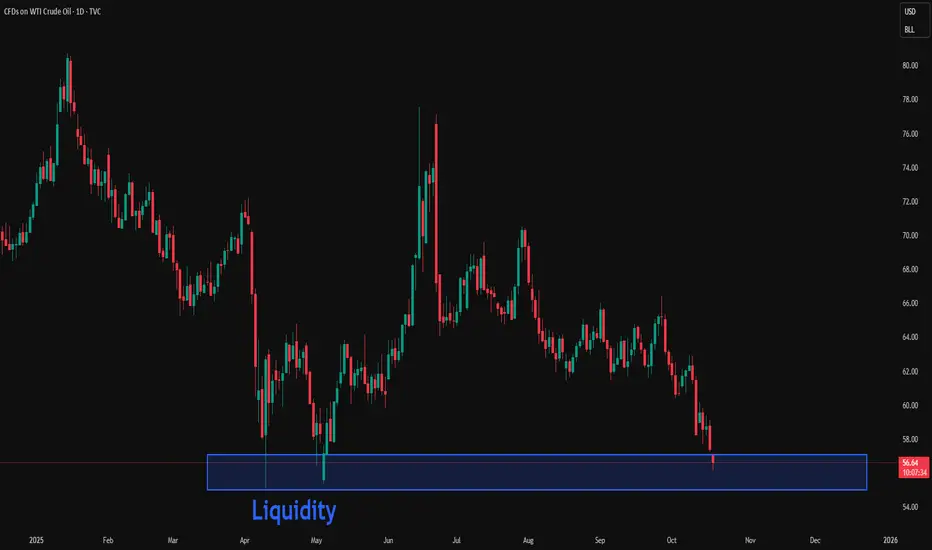
USOIL: Waiting for a liquidity sweep on the Daily timeframeIn my previous analyses on USOIL, including the fundamental outlook, price has been trending lower within a narrow channel between $70 and $50.
I’m looking for a buy opportunity on higher timeframes after a large liquidity sweep.
Weekly Outlook:
* Trend: assessed using at least three trend indicators, with market structure as the primary guide.
** Weak or Reversal Signals: Assessed based on one of our criteria for trend reversal signals.
*** Support/Resistance: Selected from multiple factors – static (Swing High, Swing Low, etc.), dynamic (EMA, MA, etc.), psychological (Fibonacci, RSI, etc.) – and determined based on the trader’s discretion.
**** Our advice takes into account all factors, including both fundamental and technical analysis. It is not intended as a profit target. We hope it can serve as a reference to help you trade more effectively. This advice is for informational purposes only and we assume no responsibility for any trading results based on it.
George Vann @ ZuperView
Nzd/Usd - Bullish Reversal After Liquidity SweepLiquidity Sweep observed below the recent weak low, indicating a potential stop-hunt and smart money accumulation.
Break of Structure (BOS) and multiple Change of Character (CHoCH) signals suggest a shift from bearish to bullish market structure.
Price has shown a bullish CHoCH after the liquidity sweep, aligning with a potential trend reversal.
Entry:
Entry Zone: ~0.57462 (Marked with blue arrow)
Price has just broken above the minor range high, confirming bullish intent.
Targets:
TP1: ~0.57790 – Aligns with the nearest resistance zone.
TP2: ~0.58090 – Retest of a strong high and major resistance zone.
Stop Loss Suggestion:
Below the swept liquidity low, ideally under 0.57300 (weak low), to protect against a deeper pullback.
Key Concepts Highlighted:
CHoCH (Change of Character) – Shift from bearish to bullish trend.
BOS (Break of Structure) – Confirmation of direction change.
Liquidity Sweep – Possible smart money move to trap sellers.
Resistance Zones – Marked areas for potential profit-taking.
Bullish Bias Justification:
Price action has swept liquidity, formed a higher low, and broken previous lower highs.
CHoCH confirms shift in momentum; likely targets are previous supply zones (TP1 & TP2).
Favoring long setups while structure remains bullish above weak low.

sept 29: 1 loss, 2 winssept 29: 1 loss, 2 wins
I saw that price tapped the DAY FVG + EQH up there and has downtrended massively, so I looked for shorts.
Applied my AVWAPS, and my confluence filters(Orderflow+sweep+div+FVG), which was favorable so I entered.
I kinda rushed into the first trade because I woke up late, but basically would have also won there if I just plotted the AVWAP first(yeah), because if i did plot my AVWAP,
I would have seen that price has a few more pips before hitting the AVWAP line, so I could have put my entry higher and my stoploss higher.
Well I just moved my SL on the first trade, and then re-entered twice after it "respected" the AVWAP (plotted from the DAY FVG STING).
Standard 10TP5SL, and it won twice. so, good day I guess.

SEPT 26: PRICE GOES DOWN TO 4H FVG BEFORE COMING UP AGAINSEPT 26: PRICE GOES DOWN TO 4H FVG BEFORE COMING UP AGAIN
I think price is going up more until a HTF POI is hit.
It has to come down first to a bullish 4h FVG so i entered short once my criteria for entry has appeared(sweep, divergence, overbought, reversal candle+engulfing candle).
Let's see how it goes.

SEPT 24: SUBOPTIMAL TRADE ENTRY?SEPT 24: SUBOPTIMAL TRADE ENTRY?
Well, price came off of monthly fvg and daily eqh last time and has recently took a noseddive so ORDERFLOW was bearish.
1H BULLISH DIV happened though and the ORB was below price once I looked at the charts, so it might reverse?
But at the same time price is reacting off of the 15min fvg + sr flip so let's see if the bullish reversal happens or it comes running back down again.
kinda 50/50 on this one, because price is kinda at the middle between the bullish reversal and the bearish orderflow and confluences.
so we'll see if it wins, i guess.
Sept 18, 2025: A+ Setup
This is it. I'll trade like this til the day I di3... hopefully after 50 years or more lol.
TRADING STRAT:
1. TAP INTO HTF (4HR & HIGHER) POI (HTF FVG/LTF SWEEP)
2. 4HR & LOWER DIVERGENCE
3. CISD / FVG / FVA
4. FVA DISPLACEMENT & RESPECT = ENTER\
That's it.

Perfect Setup AnatomyPERFECT SETUP ANATOMY: Sept 17, 2025
OBVIOUS LIQUIDITY SWEEP(SSL) AREA, OF COURSE PRICE WILL TAKE IT OUT LOL.
i THOUGHT ABOUT PUTTING AN ENTRY HERE JUST IN CASE MY INITIAL FVA RESPECT
ENTRY WAS TAKEN OUT, BUT I WAS OFF THE PC BY THAT TIME SO I DIDN'T.
WELL, THERE WAS A BULLISH DIV + SWEEP + FVA RESPECT AT THIS POINT,
SO I DID WHAT ANY SANE PERSON WOULD DO, RE-ENTER.
Price moved as follows:
1.) TRENDLINE LIQUIDITY GATHERING
2.) ACCUMULATION BEFORE TRENDLINE BREAKOUT. This is where sweep+div+cisd+fvg+fva happened. "PDA accumulation"
3.) FVA RESPECT/RE-TEST
4.) PRICE HITS ORIGINAL DAY EQH TARGET
5.) I SHOULD HAVE PUT THIS ON 1:3RR,
BUT I'M GOING TO TRY 1:1RR FIRST
(TO INCREASE WINRATE = INCREASE CONFIDENCE IN THE STRATEGY),
WITH A TRAILING STOP THAT STARTS AT 1.5RR USING MT5.
LOGIC IS, SO IT FULL TPs AT 1RR MINIMUM,
AND RIDE THE TREND IF THE PRICE RUNS FARTHER.
-
so, here's what's required again for a trade to start being considered:
0. HTF Target (EQH/EQL) + HTF OF Alignment
1. Previous Orderflow Liquidity Sweep
2. Accumulation of BUY/SELL Arguments (Trendline Liquidity & FVA = recent sweep+div+CISD+FVG) / PDA ACCUMULATION
3. Respect of FVA
4. Entry
Bias - uptrend, day eqh
Narrative - sting into htf fvg = ltf ssl
Context - ssl to eqh
Entry - fva respect & retest

Swing Setup: (1D+4H) POI + 5min DIVERGENCE + FVA RESPECT So I did my top down analysis, saw a 1D FVG and price respected it, so I looked for divergences and i found it on the 5min, saw price made an FVA and displaced through it so I decided it was time to enter that because a 4H and 1D FVG is a strong POI, and the fact that price did not burst through it meant it was getting respected.
So I think it was at this time that I saw the FVA has formed and has been respected so I looked for an entry.
For the actual entry, I think there was a small bullish FVG there above the FVA so I took that.
Since price was at a 1D + 4H FVG, I considered it as the Internal Range Liquidity(IRL) and therefore targeted the External Range Liquidity (ERL). I put my SL quite far, at the bottom of this sting into the FVG. It got me 2.8RR I think, and that's good enough.
I made this trade on friday, and it only resolved the next trading day, which was monday.
TL;DR, 4H and above POI(IRL), once you see it getting respected (with an FVA + FVG), take it as a sign, enter without hesitation, and target the ERL.

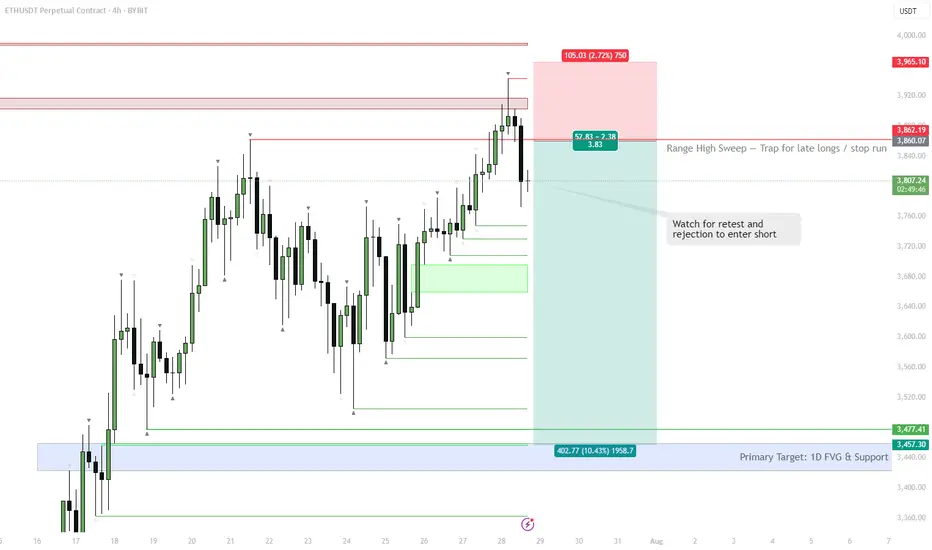
ETH | #4h #short — Range High Sweep & Short SetupScenario:
ETH swept the range high at $3,860, trapping late buyers and triggering stops. Watching for a retest of this level — if it holds as resistance and we see rejection, that’s a short trigger.
Target:
Main target is the 1D FVG at $3,457–$3,477. Possible extension: sweep of range low if selling accelerates.
Why:
Failed breakout setups are classic mean reversion triggers, especially when supported by a visible liquidity pool (FVG) below.
Plan:
Wait for a retest and rejection to confirm short. Partial TP at the FVG zone, manage risk above the sweep high.
HYPE | Sweep & Reclaim SetupPlan:
Watching for a sweep into the blue H4 Untapped Demand zone, then a reclaim of 41.237 (green line) to add longs.
Ideal target: new ATH and 55 extension.
If the blue zone fails or we can't reclaim 41.237, risk-off mode: equal lows at 30.6 could be the draw.
Reasoning:
A sweep into demand would reset local liquidity and trap late shorts.
Reclaiming 41.237 confirms a shift in momentum and invalidates the breakdown.
Structure is bullish above 41.237; below, risk increases for deeper downside.

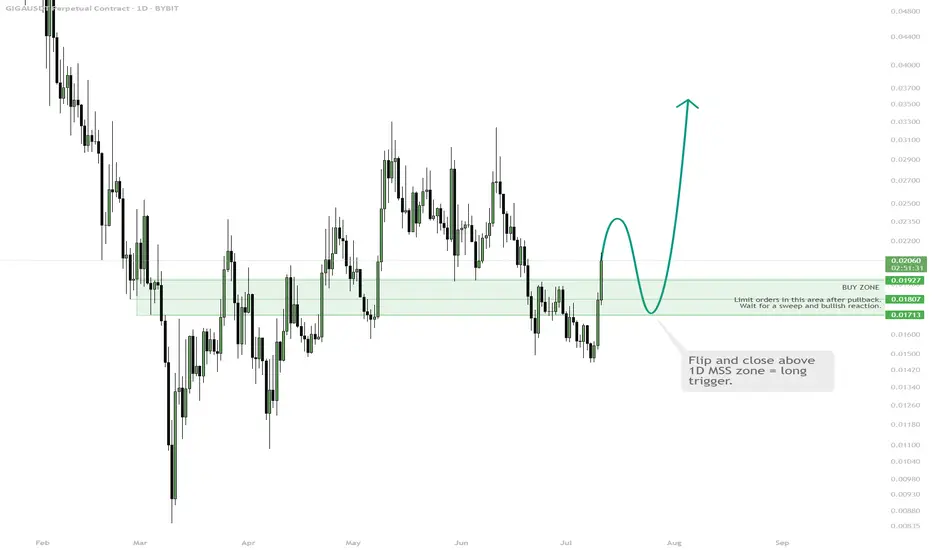
GIGA | Watch for 1D MSS Flip & Long TriggerBUY ZONE $0.0175–0.0192 — wait for pullback, enter on bullish signal.
TRIGGER: Flip and hold above 1D MSS zone.
STOP: Close below $0.0171 = exit.
TP: $0.025 / $0.03 — take profit on move up.
Wait for the break and flip above 1D MSS, then enter long on confirmation. Avoid early entry — only buy after a clear signal. Fix part of profit at resistance.