SWELL/USDT – Key Demand Zone: Relief Rally or Breakdown?Full Analysis
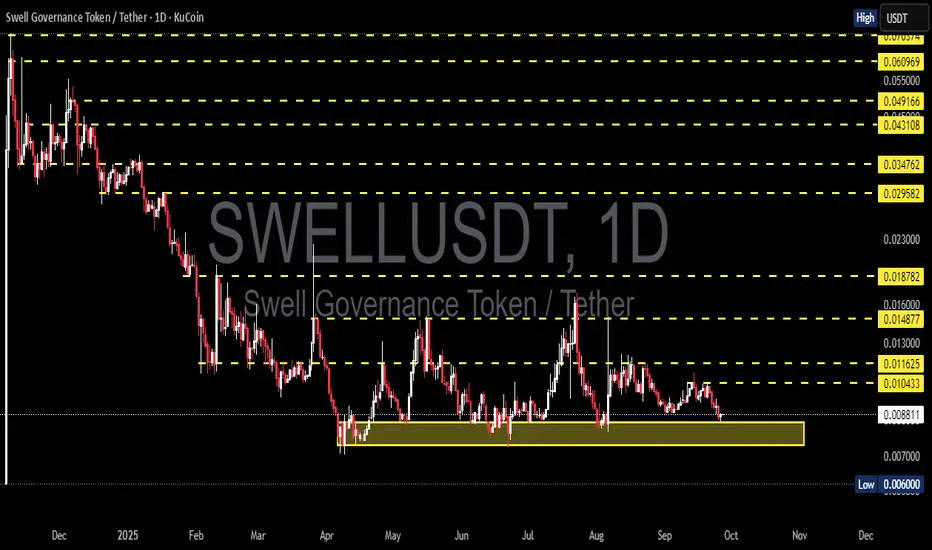
SWELL is currently at a critical juncture. After a prolonged downtrend since early 2025, the price has shifted into a range-bound structure, with a strong demand zone around 0.0060 – 0.0088 (highlighted in yellow).
This zone has been tested multiple times over the past few months, suggesting that buyers—potentially whales or institutions—are defending it. However, the more a support level is tested, the weaker it often becomes, raising the stakes for what comes next.
---
Structure & Price Pattern
Primary trend: bearish since the start of the year, but the momentum of the decline has slowed since Q2 → forming a range market.
Current pattern: multi-touch support combined with lower highs on the upside → signaling a phase of accumulation or distribution.
Key levels:
Support zone: 0.0060 – 0.0088.
Resistance layers: 0.0104 → 0.0116 → 0.0149 → 0.0187.
If the support zone holds, the probability of a relief rally is high. If it breaks, we could see a new capitulation phase.
---
Bullish Scenario
1. Bounce from demand zone
Confirmation: a strong daily rejection candle (hammer / bullish engulfing) with rising volume.
Short-term target: 0.0104 – 0.0116.
Extended targets: 0.0149 – 0.0187 if a breakout gains traction.
Upside potential: +30% to +100% from current levels.
2. Structural breakout
If price closes above 0.0116 on the daily chart, structure shifts into a higher-high formation.
This would significantly increase the probability of a larger bullish leg.
---
Bearish Scenario
1. Support breakdown
If the daily close falls below 0.0060, the demand zone will have failed.
This could trigger another strong sell-off and force the price to search for lower support levels.
Downside potential: at least -30% from current price, possibly more under heavy selling pressure.
---
Implications for Traders
Aggressive traders may consider entering within the demand zone with a tight stop-loss just below 0.0059. High risk, but potentially high reward if the bounce materializes.
Conservative traders should wait for a confirmed breakout above 0.0116, then enter on the retest. This approach provides a clearer bullish structure and better confirmation.
Risk management is critical here—SWELL is a small-cap altcoin with high volatility.
---
Conclusion
SWELL/USDT is standing at a major decision point. The 0.0060–0.0088 demand zone is the battlefield where the next trend direction will be decided—whether we see a relief rally toward higher resistances or a bearish breakdown into uncharted territory.
For traders, this is the time to stay patient and wait for confirmation: watch daily candle closes, volume spikes, and market reactions around this zone before making a move.
---
#SWELL #SWELLUSDT #CryptoAnalysis #Altcoin #TradingView #PriceAction #SupportResistance #Breakout #CryptoTrading #TechnicalAnalysis
Swell
SWELLUSDT 1D AnalysisSWELL ~ 1D Analysis
#SWELL This trade is very high risk
Buy if you still have confidence in this coin with a short term target of at least 15%+ from here.

SWELLUSDT 1D Analysis SWELL ~ 1D Analysis
#SWELL Buy after successfully breaking this resistance line with a short term target of at least 10%+ from here.

Swell: Your Altcoin ChoiceThis is a good choice. If you are already in and waiting for a recovery, the wait is almost over. If you are out and looking to buy, then timing is great. SWELLUSDT is trading at a new All-Time Low with early reversal signals.
We have a reversal signal coming from the candles as well as a rounded bottom still in the making.
The initial drop, is a full down-move, a down-wave or bearish impulse. The last and second drop is very small. It is more likely a flush, rejection or stop-loss hunt. The second drop from late March indicates that there is no longer a bearish wave. This is the last bearish action before the market produces a change of trend.
"The bottom is in" is not necessarily a sure thing. Always be prepared for some more shaking before prices grow, just as a precaution. What is certain, is that the next major phase is a bullish cycle, anything lower would be short-lived and a manufactured market move. The downtrend is over. After going down, the market tends to grow.
I am mapping some targets for you. These are not necessarily the All-Time High, there can be more growth by the end of the 2025 bullish cycle. These can happen in the mid-term. Within 3 months. When considering the long-term, prices can go off the chart.
This is a good pair.
Thanks a lot for this Altcoin Choice.
Namaste.

SWELL looks bullish (4H)A significant trendline has been broken, and we have an iCH on the chart. Additionally, a key QM L has been reclaimed. With a pullback to the entry zones, we will be looking for buy/long positions.
The targets are marked on the chart.
A daily candle close below the invalidation level will invalidate this analysis.
For risk management, please don't forget stop loss and capital management
When we reach the first target, save some profit and then change the stop to entry
Comment if you have any questions
Thank You
SLong

XRP - ZOOM OUT - LOOK AT THE BIGGER PICTURE - CryptoManiac101XRP / USD TA
Let's quickly zoom out and look at the bigger picture here. What's happening? We are strictly following the ascending channel and we should be getting ready for the first hyper leg up of this alts bull cycle sometime in November.
As always, I'm here just to show my own views and I hope you guys find it helpful! Enjoy!

Expected to rise $XRP/USD with SWELL 2020 coming up.Expectations for XRP are very high.
Most recently, the resistance is on the ¢ 25.7 line, and breaking through this line is likely to be the starting point for the explosion. Since the low price was hit on September 24, the price has been steadily rising, and expectations for the rise are steadily rising.
In the past, the trend before the SWELL event was that expectations were raised by the SWELL date and then fell on the SWELL date for the third consecutive year. Under such circumstances, although there is a possibility that it will be sold on the SWELL date this year as well, it is expected that the increase will continue from next week to the date.
In next week, it is necessary to pay close attention to the trends in the US presidential election, stock markets, financial markets, gold market trends and the cryptocurrency market, but the rise in XRP will be in the cryptocurrency market. There is no doubt that it will have a positive effect on.
I would like to expect an increase while continuing to thoroughly manage risks.

$XRP/USD At the time of actual preparation? Today I would like to think about the long-term market price of XRP.
In the current weekly chart, there are three points that you should definitely be aware of.
1) Price range from ¢ 27 to ¢ 30 (blue line)
2) Uptrend line after the corona shock
3) Positional relationship of various moving averages
First of all, 1) It is no exaggeration to say that this blue line is the most conscious in the XRP market since 2017. We have been supporting and resisting this line many times over the last three years, and have never broken since it broke below this line in August 2019. Since the beginning of 2020, I have tried to break this line twice, but it has failed.
Under such circumstances, move on to 2). Since the COVID-19 pandemic that came in March, it has steadily pushed up the market while drawing a double bottom. While the uptrend line is also strongly conscious, the upper price is resisted by the light blue line, so the chart pattern is in the shape of an ascending triangle, and expectations for a breakout are rising.
Finally 3) Although the short-term, medium-term, and long-term moving averages have deviated so far, they have finally converged recently. It is a well-known fact that various moving averages create trends while repeating convergence and diffusion, but the short-term moving averages are also pointing upwards, and the golden cross from here is also visible.
Under these circumstances, it is less than a month before the biggest conference, SWELL 2020, is held.
Although I have to refrain from easy long hair, I think that it is the best time to buy with a solid strategy in the medium to long term.

XRP could absolutely explode this month!First of, apologies for the clickbait-ish title - it´s the only thing that gets people to pay attention nowadays apparently. With that being said, the tittle is not entirely misleading and here´s why.
General analysis:
- last two monthly closes are very interesting as we closed the month of September in a doji type candlestick which typically signals indecision or perhaps even reversal
- the following month was followed by a nice bullish candle that showed buyers are still interested in XRP at these prices
- these two candles put together indicate a potential bottoming formation
The way to trade this setup is very simple:
- as soon as we take out the high of September at roughly 32 cents, I expect this thing to absolutely explode to the upside, when XRP goes, it goes hard
- conversely, should we fall below the support (thick blue line) and especially if we trade below the low of the doji this thing is likely going down much more
Bias?
- short term time frames (1D, 2D, 3D) look a bit shitty and with Swell coming up I wouldnt be surprised at all if we see a short sell off to 23 - 25cents. Remember though, we are focusing on the weekly and monthly here
- the fact that my lovely MA´s have crossed to the upside is really really good, even more so when it happens on a monthly scale
- we appear to be in a falling wedge (no, this is not a descending triangle in any way, shape, or form), which do tend to resolve to the upside
- finally, I usually don´t give a you-know-what about fractals but it is interesting how all the previous XRP pumps were preceded by big doji candles (blue boxes), followed by a nice bullish candle which ultimately lead to a big breakout
In short, my bias currently is to the upside but either way this thing breaks, the way to trade it is very simple, which is why you should definitely pay attention to XRP in the coming weeks.
Take care.


is XRP about to Bart its way UP? to recovery and beyondXrp had a nice trendline that lasted several weeks, but it get out of there and now is showing some signs of recovery;
could we see xrpbtc forming a bart way up to the 0.000038 and continue gaining more value?
with Swell just around the corner I think the answer is probably yes, we'll see
not financial advice, trade carefully

XRP 4-Hour Chart Probable First Stop and ContinuationAfter news like walmart's remitance services we can expect the start of an Uptrend once we clear 0.304 which could happen later today; first stop could be 0.33 and then a continuation after more good news at Swell.
Not finantial advice, trade carefully.

XRP Golden Cross heading into Swell! Here we can see the 50 day Moving average intersecting the 100 day Moving average on the 1 day time frame. This is known as a Golden Cross and is hugely bullish.
We can also see the price above the Ichimoku Cloud and support at $0.27.
With Swell in only a few days I think we could get a break out here and with the Fibonacci retracement tool we can see that $0.50 in the short term is very possible if we can break through the 1st tough resistance at $0.40

diamond bottom ----- patience is a virtueswell approaching.... if this plays out - trade it on the way up and enter on confirmation of the diamond breakout. patience people... q4 and q1 2020 will be rewarding

RIPPLE - Breakout On The DailyHello my friends! First of all - please be careful with some ideas about XRP on this platform. While i think Fractals (a repeating chart-pattern) work good if they are applied well, i do always take them with a grain of salt. Expecting the price to pump within a matter of days like back in 2017 and 2015 is nothing but delusional.
Anyway, we've made some great profits with XRP in the past days and it seems like there's a(nother) breakout in the making.
The picture get's clearer on the lower time-frames (6H, 4H, 2H).
I hope you guys don't mind if i not mention my exact setup and how i trade some indicators like the ADX etc.
It's mostly experience (i've failed a lot) and some secrets :-) But feel free to ask questions in the comment section
and please share your own ideas. I really enjoy reading them.
The price is moving in an Channel (upward). While the volume is declining, we're making some strong moves.
We can use the Channel (Bottom) to determine a Buy Zone for maximum profit located at 0.285 .
Our Target is located at the Previous High at 0.328
There's an "Emotional Price Level" right in front of us at 0.300 . I'm expecting more volume to kick-in anytime soon
during the weekend.
THANKS! For all the positive feedback im receiving lately.
Leave a thumbs up if you like this idea and Follow me for more updates!
Disclaimer:
Any opinions, chats, messages, news, research, analyses, prices, or other information contained in this Idea are provided as general market information for educational and entertainment purposes only

Mid-Term XRP Analysis TD Sequential WeeklyIn most important exchanges XRP has just printed three 9's in the weekly chart using TD Sequential; the first one in the 2017 bull market (I think it was actually January 2018, those days right?), the second near the bottom in August 2018, the third one just a month ago, and right now we are in the number 2 with a bullish outlook and high probabilities of making the fourth 9 (and second being bullish and maybe in the midst of another bull market).
That being said, price in the next days can go way lower than we would like it (closing next week above 0.242 cents aprox.) and still form (print) a 9 in six weeks, so in the mid-term I'm completely bullish because of fundamentals and news, MACD weekly bullish crossover, Swell, and the fact that XRP vs BTC already is trending upwards, so if we can´t "make it" in Fiat, we still have the possibility of "making it" big time vs BTC-market.
Resistance according to chart above are 0.30, another at 0.37 area, then 0.425 aprox, then 0.50, we could spend anywhere from a few hours to full days correcting at those levels, and then more upside, or just smash through it the xrp-way lol.

XRP same actors / similar moveBroke low
will we break high into a daily pinch now???
Review old ideas. Thanks everyone ^_^

Yearly Support Looks Really GOOD on XRPI must say, the bounce from the 0,21 XRP/EUR pair, same on XRP/USD Looks really solid.
Target of 1 EUR, just above 1 USD looks really good from here.
If it might drop lower, almost any level looks like a good buy, but do your own research.
Swell event is upcoming and Ripple already put out some positive news on XRP now ODL (On Demand Liquidity) and might have some big announcements upcoming on Swell and towards end of year and further.
Take care and feel free to comment.

XRPUSD 1H - Lets Go! You Old-Timey!XRPUSD Finding support at 0.49 and looking to test major resistance 0.52. Let's Play!
What do you guys think? Let's discuss your ideas.
Like, Share and Follow for more TA if you want me to keep posting.
~ Steazy - Signing Out!
“I believe in analysis and not forecasting.”
~ Nicolas Darvas

$XRP long again after the #swellbyripple conferenceXRP clearly found support after the swell conference. Taking my long entry again here.

XRP/USD is bearish after SWELL irrational pump (4H and DAILY)Hi,
4h timeframe
Technical elements :
-Bearish Chuvanov fork > XRP is retesting the 2nd line of the fork
-Rising wedge > XRP is standing on the parallel of the wedge at the moment, which is the 1st target of a wedge pattern but not the last one
-Double top > we should not pay attention to the big shadow of the higher high candle, obviously a FOMO shadow, just look at the candles bodies > we need to retest the neckline of this double top
-Oscillator (RSI and stochastic) bearish divergences > it began well before the higher high (with the FOMO shadow) and it continued after this higher high. (look at the red circles)
-VWMA55 passed under MA55 > volume is losing momentum (yellow circle)
-Are we beginning the 5th corrective wave ? I think so. Because if you try to do it another way, 3 will massively overlap 1.
If I'm wrong and we already completed the 5th wave... we may be witnessing a bounce in next hours before dump continuation.
Why we're not in an ascending triangle ? Because XRP didn't touch the lower trendline 3 times but only 2 times. It needs to bounce a third time on this line to consider an ascending triangle pattern. We can at most, imagine it.
Fundamental analysis :
-SWELL conference is over > no incredible news
If you bought because of Santander news, you should know that they were already planning to use Ripple tech before, and their app is not designed with xRapid technology but xCurrent network. So it doesn't need XRP currency.
SELL THE (NEWS) SWELL
Good luck !

