Nestle Swing CandidateChart Analysis :
Price making a decending triangle breakout pattern of day tf while taking support on 1255-1260 zone. Charts looks good to go long.
Key Levels :
Entry : At day close 1275-1280
Support : 1255-1260
Resistance : 1288/1300/1310
SL : Day close below 1255
Targets will be as per risk and emotion
Disclaimer:
I am not SEBI registered. This analysis is for educational purposes only and not investment advice. Please do your own research before trading or investing.
Swing

SILVER Will Go Down From Resistance! Short!
Take a look at our analysis for SILVER.
Time Frame: 1D
Current Trend: Bearish
Sentiment: Overbought (based on 7-period RSI)
Forecast: Bearish
The market is approaching a key horizontal level 5,142.9.
Considering the today's price action, probabilities will be high to see a movement to 4,723.3.
P.S
The term oversold refers to a condition where an asset has traded lower in price and has the potential for a price bounce.
Overbought refers to market scenarios where the instrument is traded considerably higher than its fair value. Overvaluation is caused by market sentiments when there is positive news.
Like and subscribe and comment my ideas if you enjoy them!

EURUSD Will Go Higher! Long!
Please, check our technical outlook for EURUSD.
Time Frame: 9h
Current Trend: Bullish
Sentiment: Oversold (based on 7-period RSI)
Forecast: Bullish
The market is approaching a significant support area 1.158.
The underlined horizontal cluster clearly indicates a highly probable bullish movement with target 1.165 level.
P.S
We determine oversold/overbought condition with RSI indicator.
When it drops below 30 - the market is considered to be oversold.
When it bounces above 70 - the market is considered to be overbought.
Like and subscribe and comment my ideas if you enjoy them!

USDJPY Will Go Down! Sell!
Here is our detailed technical review for USDJPY.
Time Frame: 1D
Current Trend: Bearish
Sentiment: Overbought (based on 7-period RSI)
Forecast: Bearish
The market is on a crucial zone of supply 155.460.
The above-mentioned technicals clearly indicate the dominance of sellers on the market. I recommend shorting the instrument, aiming at 152.862 level.
P.S
Overbought describes a period of time where there has been a significant and consistent upward move in price over a period of time without much pullback.
Like and subscribe and comment my ideas if you enjoy them!

GBPAUD Will Move Lower! Short!
Take a look at our analysis for GBPAUD.
Time Frame: 6h
Current Trend: Bearish
Sentiment: Overbought (based on 7-period RSI)
Forecast: Bearish
The price is testing a key resistance 2.023.
Taking into consideration the current market trend & overbought RSI, chances will be high to see a bearish movement to the downside at least to 2.006 level.
P.S
Please, note that an oversold/overbought condition can last for a long time, and therefore being oversold/overbought doesn't mean a price rally will come soon, or at all.
Like and subscribe and comment my ideas if you enjoy them!

USOIL Is Bullish! Buy!
Please, check our technical outlook for USOIL.
Time Frame: 9h
Current Trend: Bullish
Sentiment: Oversold (based on 7-period RSI)
Forecast: Bullish
The market is trading around a solid horizontal structure 59.384.
The above observations make me that the market will inevitably achieve 61.007 level.
P.S
The term oversold refers to a condition where an asset has traded lower in price and has the potential for a price bounce.
Overbought refers to market scenarios where the instrument is traded considerably higher than its fair value. Overvaluation is caused by market sentiments when there is positive news.
Like and subscribe and comment my ideas if you enjoy them!

EURGBP Is Going Down! Short!
Take a look at our analysis for EURGBP.
Time Frame: 1h
Current Trend: Bearish
Sentiment: Overbought (based on 7-period RSI)
Forecast: Bearish
The market is approaching a key horizontal level 0.881.
Considering the today's price action, probabilities will be high to see a movement to 0.880.
P.S
Overbought describes a period of time where there has been a significant and consistent upward move in price over a period of time without much pullback.
Like and subscribe and comment my ideas if you enjoy them!

USD/JPY - Multi Timeframe Analysis🚀 USD/JPY Forecast: Breaking Out of the Wedge! 🚀
Hey traders! 👀 The USD/JPY is looking like it’s gearing up for a big move, so let’s dive into the charts and break it down.
🔍 4-Hour Chart (Top Left):
We’ve got an Ascending Wedge Formation on our hands! Price has been creeping up towards key resistance, but it’s been bouncing off this trendline like a pinball. Look at the Entry Zone right here — we could see a breakout soon, either to the upside or downside. Are we going to push higher, or is this the calm before the storm? ⚡
🎯 Target Levels:
Target 1: First stop if the breakout happens is just above 155.00.
Target 2 : After that, we’re eyeing 156.00, which could be a major resistance zone.
📅 Daily Chart (Middle):
On the daily, we’re still seeing that wedge formation play out. The pressure is building, and it's almost time for the price to make its move. Will the bulls keep charging, or will we see a shift in momentum? That strong support below might just give us a push if we drop back down.
📊 Weekly Chart (Bottom Right):
Looking at the long-term picture, USD/JPY is in an upward trend, breaking through key resistance levels over the last few months. We’ve already seen a Break of Structure (BOS) at 151.00, and now we’re breaking above 154.00! This could signal the continuation of the uptrend as we eye 156.00 next.
💥 Key Levels to Watch:
Resistance: 156.00 (Eyes on this level — it could be the next big hurdle!)
Support : 152.00 (Look for a possible retracement here if we see a pullback)
Next Target: If we break 156.00, we could see USD/JPY heading even higher towards 160.00 in the coming months!
🔥 What’s Next?
The squeeze is real! Will USD/JPY break higher, or are we about to see a sharp reversal? Either way, there’s plenty of action to look forward to in the coming days. Make sure you’re ready!
💬 How are you planning to trade USD/JPY right now? Drop your thoughts below and let’s discuss the setup!

NZD/JPY BEARS ARE GAINING STRENGTH|SHORT
Hello, Friends!
NZD-JPY uptrend evident from the last 1W green candle makes short trades more risky, but the current set-up targeting 86.923 area still presents a good opportunity for us to sell the pair because the resistance line is nearby and the BB upper band is close which indicates the overbought state of the NZ/JPY pair.
Disclosure: I am part of Trade Nation's Influencer program and receive a monthly fee for using their TradingView charts in my analysis.
✅LIKE AND COMMENT MY IDEAS✅

GOLD Will Go Lower From Resistance! Sell!
Here is our detailed technical review for GOLD.
Time Frame: 4h
Current Trend: Bearish
Sentiment: Overbought (based on 7-period RSI)
Forecast: Bearish
The market is on a crucial zone of supply 4,085.57.
The above-mentioned technicals clearly indicate the dominance of sellers on the market. I recommend shorting the instrument, aiming at 3,997.50 level.
P.S
The term oversold refers to a condition where an asset has traded lower in price and has the potential for a price bounce.
Overbought refers to market scenarios where the instrument is traded considerably higher than its fair value. Overvaluation is caused by market sentiments when there is positive news.
Like and subscribe and comment my ideas if you enjoy them!

EURUSD Will Go Up From Support! Buy!
Take a look at our analysis for EURUSD.
Time Frame: 5h
Current Trend: Bullish
Sentiment: Oversold (based on 7-period RSI)
Forecast: Bullish
The price is testing a key support 1.161.
Current market trend & oversold RSI makes me think that buyers will push the price. I will anticipate a bullish movement at least to 1.167 level.
P.S
We determine oversold/overbought condition with RSI indicator.
When it drops below 30 - the market is considered to be oversold.
When it bounces above 70 - the market is considered to be overbought.
Like and subscribe and comment my ideas if you enjoy them!

USDCAD Will Go Higher! Long!
Please, check our technical outlook for USDCAD.
Time Frame: 5h
Current Trend: Bullish
Sentiment: Oversold (based on 7-period RSI)
Forecast: Bullish
The market is trading around a solid horizontal structure 1.401.
The above observations make me that the market will inevitably achieve 1.407 level.
P.S
Overbought describes a period of time where there has been a significant and consistent upward move in price over a period of time without much pullback.
Like and subscribe and comment my ideas if you enjoy them!

EURCAD Will Go Up! Buy!
Here is our detailed technical review for EURCAD.
Time Frame: 9h
Current Trend: Bullish
Sentiment: Oversold (based on 7-period RSI)
Forecast: Bullish
The market is testing a major horizontal structure 1.628.
Taking into consideration the structure & trend analysis, I believe that the market will reach 1.639 level soon.
P.S
Please, note that an oversold/overbought condition can last for a long time, and therefore being oversold/overbought doesn't mean a price rally will come soon, or at all.
Like and subscribe and comment my ideas if you enjoy them!

DXY Will Go Lower! Short!
Please, check our technical outlook for DXY.
Time Frame: 5h
Current Trend: Bearish
Sentiment: Overbought (based on 7-period RSI)
Forecast: Bearish
The market is approaching a significant resistance area 99.554.
Due to the fact that we see a positive bearish reaction from the underlined area, I strongly believe that sellers will manage to push the price all the way down to 99.097 level.
P.S
We determine oversold/overbought condition with RSI indicator.
When it drops below 30 - the market is considered to be oversold.
When it bounces above 70 - the market is considered to be overbought.
Like and subscribe and comment my ideas if you enjoy them!

GOLD Is Going Up! Long!
Take a look at our analysis for GOLD.
Time Frame: 2h
Current Trend: Bullish
Sentiment: Oversold (based on 7-period RSI)
Forecast: Bullish
The market is approaching a key horizontal level 4,007.16.
Considering the today's price action, probabilities will be high to see a movement to 4,053.41.
P.S
Overbought describes a period of time where there has been a significant and consistent upward move in price over a period of time without much pullback.
Like and subscribe and comment my ideas if you enjoy them!

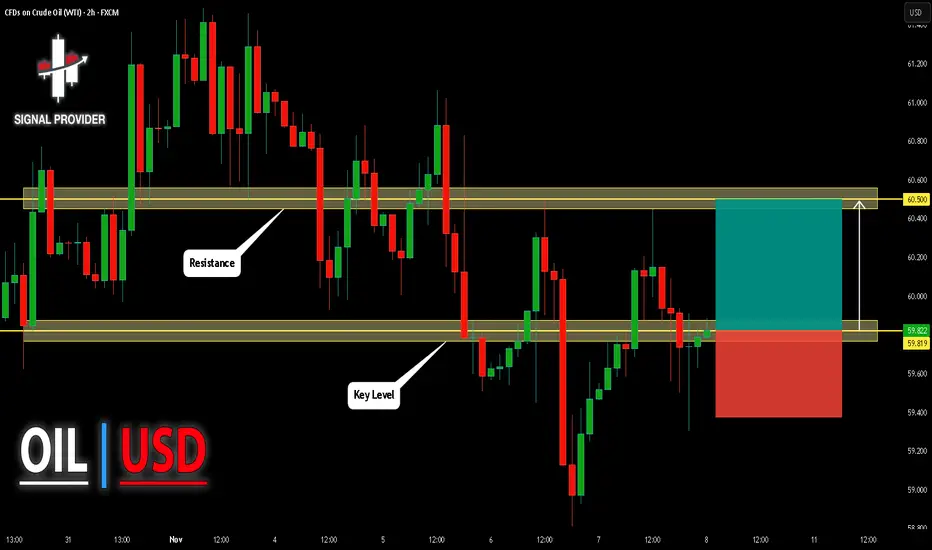
USOIL Will Move Higher! Buy!
Take a look at our analysis for USOIL.
Time Frame: 2h
Current Trend: Bullish
Sentiment: Oversold (based on 7-period RSI)
Forecast: Bullish
The price is testing a key support 59.819.
Current market trend & oversold RSI makes me think that buyers will push the price. I will anticipate a bullish movement at least to 60.500 level.
P.S
Please, note that an oversold/overbought condition can last for a long time, and therefore being oversold/overbought doesn't mean a price rally will come soon, or at all.
Like and subscribe and comment my ideas if you enjoy them!
USDJPY Will Move Lower! Short!
Take a look at our analysis for USDJPY.
Time Frame: 1D
Current Trend: Bearish
Sentiment: Overbought (based on 7-period RSI)
Forecast: Bearish
The market is approaching a key horizontal level 154.543.
Considering the today's price action, probabilities will be high to see a movement to 151.281.
P.S
The term oversold refers to a condition where an asset has traded lower in price and has the potential for a price bounce.
Overbought refers to market scenarios where the instrument is traded considerably higher than its fair value. Overvaluation is caused by market sentiments when there is positive news.
Like and subscribe and comment my ideas if you enjoy them!

USDCHF Is Bullish! Long!
Please, check our technical outlook for USDCHF.
Time Frame: 1D
Current Trend: Bullish
Sentiment: Oversold (based on 7-period RSI)
Forecast: Bullish
The market is approaching a significant support area 0.793.
The underlined horizontal cluster clearly indicates a highly probable bullish movement with target 0.802 level.
P.S
We determine oversold/overbought condition with RSI indicator.
When it drops below 30 - the market is considered to be oversold.
When it bounces above 70 - the market is considered to be overbought.
Like and subscribe and comment my ideas if you enjoy them!

EUR/USD - Forecast🟦 EUR/USD – Next Move Forecast (4H)
🧠 Market Story Right Now
Price just tapped into that mini BSL and rejected — classic liquidity grab.
Below it, we’ve got a 71% retracement zone + mini demand block, which is exactly where price is chilling now.
This is the decision-making area.
HTF is still leaning bullish,
STF is doing a small correction,
So we’re in a classic “pullback before continuation” setup.
🧊 1. The Pullback Zone Is Loaded
The shaded 4H IMB (inefficiency) + 71% + last B.O.S area…
Everything screams:
➡️ “Let me correct, rebalance, and then send it.”
Perfect spot for smart-money entries.
📈 2. What’s Likely Next?
Scenario A (Most Probable): Bullish Continuation 🚀
Price dips slightly deeper into the grey demand block →
fills remaining imbalance →
accumulates →
then punches back upward toward that external BSL at 1.17000+.
This aligns with:
HTF direction
BOS structure
Liquidity roadmap
IMB fill
BSL magnet above
This is your rocket setup.
Scenario B (If Support Fails): Deeper Sweep Then Up
If price breaks below the grey demand block cleanly,
expect a sweep down into the orange 4H IMB.
That level holds strong historical reaction.
Wicks into it = huge buy signal.
Then same outcome: bullish continuation.
So downside is liquidity business — not trend reversal.
💡 3. Bias Summary
🔥 Bias : Bullish after rebalancing
📍 Buy Zone : Grey 4H IMB / 71% retracement
🎯 Target : 1.16800 – 1.17200 (external BSL)
🚨 Invalidation : Hard close below orange IMB
⚡ Flow: Pullback → Rebalance → Send it
📝 4. What the Chart Is REALLY Saying
“Let me wick down, catch liquidity, refill the imbalance…
then I’m off to hunt that BSL above.”
This is exactly how EUR/USD likes to move — slow pullback, quick expansion.

Gold - Next move🟡 GOLD – NEXT MOVE (Forecast)
This chart is screaming HTF correction vibe, lining up for a bigger rocket-launch leg once price finishes doing its clean-up job below. Let’s break it down 👇
🧱 1. Strong Resistance Above – The Big Ceiling
Price got smacked from that external BSL zone up top. That level is no joke — heavy sell orders sitting there, and the market reacted exactly as expected.
Think of that zone like the bouncer at the club:
➡️ “Not tonight bro.”
So yeah — rejection ✔️
🔻 2. Current Move = Sweepy Pullback Energy
Price is now dripping down in a corrective way.
Nothing impulsive.
Nothing aggressive.
Just a classic “let me grab liquidity before I send it” pullback.
We've already seen internal sell-side taken…
But the real bag sits lower. 👇
🧊 3. Strong Support Below – The Bounce Zone
That external SSL + demand block + trendline confluence zone is STACKED.
This is the place where market makers love to refill the engine before a major up-leg.
Expect price to:
✔️ Sweep liquidity
✔️ Tap the demand
✔️ Tag trendline
✔️ Rebalance the inefficiency
➡️ THEN send it 🚀
Basically…
“dip for the drip.”
📈 4. What’s Likely Next? (The Forecast)
Here’s the clean sequence:
🔻 Step 1 — Price dips into strong support
Red arrow on your chart nails the idea.
Expect that slow grind down, maybe a wick flush to catch late sellers.
🔄 Step 2 — Reversal formation
Small accumulation
Fake break
Wick trap
All the usual suspects.
🚀 Step 3 — Explosive rally back toward major resistance
Once demand holds, expect a fast, impulsive, and clean leg right back into the 4,300+ resistance zone.
This is where wave traders, SMC traders, and Elliott heads all agree:
BIG MOVE LOADING.
Wave (iii) also aligns perfectly with this.
🧭 5. Summary (Trader Friendly)
🔥 HTF = bullish (correction before continuation)
🧊 STF = bearish pullback into demand
🛒 Ideal Buy Zone = strong support + SSL
🎯 Target = 4,300 – 4,350
🚀 Bias = bullish after the sweep
⚠️ Avoid buying early — let the liquidity grab play out

DXY Is Very Bullish! Buy!
Here is our detailed technical review for DXY.
Time Frame: 1D
Current Trend: Bullish
Sentiment: Oversold (based on 7-period RSI)
Forecast: Bullish
The market is on a crucial zone of demand 99.274.
The oversold market condition in a combination with key structure gives us a relatively strong bullish signal with goal 101.270 level.
P.S
Overbought describes a period of time where there has been a significant and consistent upward move in price over a period of time without much pullback.
Like and subscribe and comment my ideas if you enjoy them!

GOLD Is Going Up! Long!
Take a look at our analysis for GOLD.
Time Frame: 4h
Current Trend: Bullish
Sentiment: Oversold (based on 7-period RSI)
Forecast: Bullish
The price is testing a key support 4,087.79.
Current market trend & oversold RSI makes me think that buyers will push the price. I will anticipate a bullish movement at least to 4,161.33 level.
P.S
We determine oversold/overbought condition with RSI indicator.
When it drops below 30 - the market is considered to be oversold.
When it bounces above 70 - the market is considered to be overbought.
Like and subscribe and comment my ideas if you enjoy them!

TMB (Tamilnadu merca bank) right to enter for swing ??no, this is not right time to enter swing . as per my anlysis ,choch happened, after choch it need to colloect poi. my entry at 455 and sl at 424 and my target at 796..
all my analysis for educational purpose only
