GBPAUD Will Go Up From Support! Buy!
Take a look at our analysis for GBPAUD.
Time Frame: 8h
Current Trend: Bullish
Sentiment: Oversold (based on 7-period RSI)
Forecast: Bullish
The market is approaching a key horizontal level 2.016.
Considering the today's price action, probabilities will be high to see a movement to 2.041.
P.S
The term oversold refers to a condition where an asset has traded lower in price and has the potential for a price bounce.
Overbought refers to market scenarios where the instrument is traded considerably higher than its fair value. Overvaluation is caused by market sentiments when there is positive news.
Like and subscribe and comment my ideas if you enjoy them!
Swing

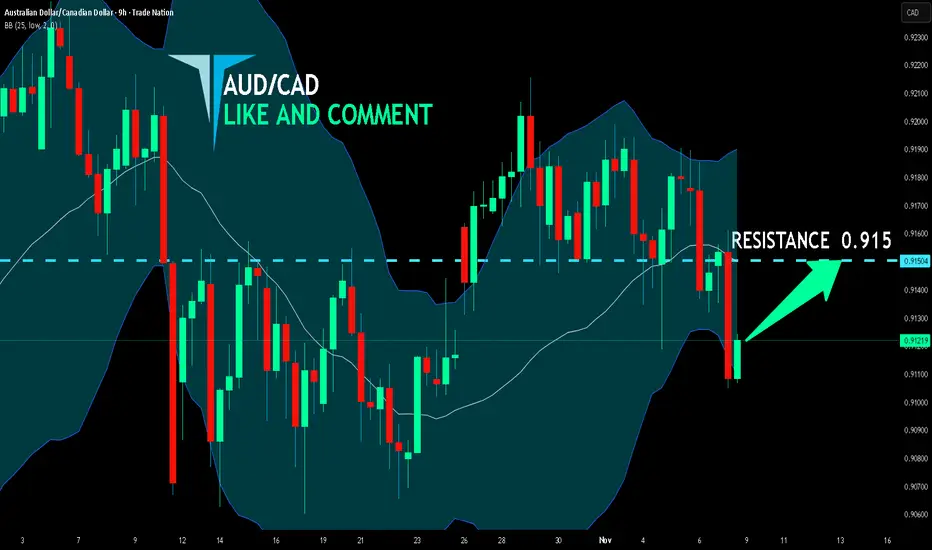
AUD/CAD SENDS CLEAR BULLISH SIGNALS|LONG
Hello, Friends!
We are targeting the 0.915 level area with our long trade on AUD/CAD which is based on the fact that the pair is oversold on the BB band scale and is also approaching a support line below thus going us a good entry option.
Disclosure: I am part of Trade Nation's Influencer program and receive a monthly fee for using their TradingView charts in my analysis.
✅LIKE AND COMMENT MY IDEAS✅
Bitcoin Playbook: Neutral‑Sell Below 106.5k, Buy Floors__________________________________________________________________________________
Market Overview
__________________________________________________________________________________
Price is compressing beneath overhead supply as a rebound from sub‑$100k meets the 2H/1D resistance shelf. Momentum is tactically capped unless 104.8k converts to support; dips into HTF floors remain the higher‑quality rotations.
Momentum: Cautiously bearish tilt (range‑within‑compression) as bounces probe 104.8k supply while 12H/6H trends point down.
Key levels:
- Resistances (2H/1D/HTF): 104,845 (2H pivot) • 106,460 (1D pivot high) • 111,577 (HTF band)
- Supports (1D/12H/4H–6H): 101,550–100,395 (near‑cluster) • 99,241–99,396 (tight 4H/6H cluster) • 98,243 (weekly pivot low)
Volumes: Normal overall; 12H shows moderate spikes only as an amplifier near key levels.
Multi-timeframe signals: 1D = Up vs 12H/6H/4H/2H = Down; structure favors fading 104.8k–106.5k unless 2H/1D acceptance prints. Longs are higher quality on 101.6k–100.4k reactions with ≥2H confirmation.
Harvest zones: 99,300 (Cluster A) / 96,800–97,300 (Cluster B). Ideal dip‑buy areas for inverse pyramiding with confirmation, using Cluster A as the initial anchor.
Risk On / Risk Off Indicator context: Neutral sell bias; this risk‑off tilt confirms the preference to sell rallies into resistance and be selective on dips.
__________________________________________________________________________________
Trading Playbook
__________________________________________________________________________________
The dominant stance is neutral‑sell while price sits under 104.8k–106.5k; lean short into supply and buy only confirmed HTF floors.
Global bias: Neutral‑sell below 106,460; upside bias resumes only on daily acceptance above 106,460.
Opportunities:
- Tactical sell: Fade 104,845 on rejection with 15m–2H confirmation; target 103,500 then 101,550–100,395.
- Tactical buy: Sweep/reclaim 101,550–100,395 with ≥2H bullish close; target 104,845 then 106,460.
- Breakout buy: Reclaim/hold above 104,845 on 1H–2H and buy the successful retest toward 106,460.
Risk zones / invalidations:
- Break and daily hold above 106,460 would invalidate near‑term shorts and unlock higher.
- Sustained closes below 100,395 would invalidate tactical longs and expose the 99.4k cluster or worse.
Macro catalysts (Twitter, Perplexity, news):
- Easier funding backdrop (lower SOFR/MOVE) supports risk but remains conditional.
- Potential US shutdown resolution and policy chatter on leveraged spot crypto trading = headline volatility risk.
- Fed cut with a hawkish tone keeps cross‑asset risk mixed; wait for confirmations at levels.
Harvest Plan (Inverse Pyramid):
- Palier 1 (12.5%): 99,300 (Cluster A) + reversal ≥2H → entry
- Palier 2 (+12.5%): 95,300–93,300 (-4/-6% below Palier 1)
- TP: 50% at +12–18% from PMP → recycle cash
- Runner: hold if break & hold first R HTF (104,845)
- Invalidation: < HTF Pivot Low or 96h no momentum
- Hedge (1x): Short first R HTF on rejection + bearish trend → neutralize below R
__________________________________________________________________________________
Multi-Timeframe Insights
__________________________________________________________________________________
Across TFs, growth impulses are capped by 104.8k–106.5k while high‑quality demand sits at 101.6k–100.4k and 99.4k.
1D: Uptrend attempt but still beneath 106,460; acceptance above that level would open room to unwind the HTF supply.
12H/6H/4H: Downtrend bias; current leg is a rally into 104,845 resistance. Failure here typically rotates price back into 101,550–100,395, with 99,241–99,396 as secondary demand.
2H/1H/30m/15m: Execution battleground at 104,845; LTF momentum can trap unless 104,845 flips to support. Look for wick rejections at resistance or strong reclaim signals at HTF floors.
Major divergence: 1D Up vs 12H Down keeps conviction muted; trade level‑to‑level with confirmation.
__________________________________________________________________________________
Macro & On-Chain Drivers
__________________________________________________________________________________
Macro is cautiously supportive via easier funding but headline‑driven; crypto policy chatter could catalyze volatility around range edges.
Macro events: Lower SOFR/MOVE ease financial conditions, but a potential US shutdown resolution and ongoing Fed communication keep risk skittish; volatility pockets likely around key data and policy headlines.
Bitcoin analysis: Price coiling in a ~$98k–$108k window; topside requires 104k+ acceptance, while loss of 98.5k would degrade structure. HTF floors align with the technical buy zones.
On-chain data: Mixed signals and sporadic supply awakenings; no decisive impulse, reinforcing the need to trade from well‑defined levels.
Expected impact: Macro/on‑chain are not overriding; they reinforce a neutral‑sell technical bias and level‑driven executions.
__________________________________________________________________________________
Key Takeaways
__________________________________________________________________________________
BTC is compressing under resistance with a risk‑off tilt; patience at levels remains the edge.
- Trend: Neutral with bearish lean until 104,845 flips and 106,460 holds.
- Best setup: Fade 104,845 rejections; buy only confirmed reactions at 101,550–100,395 and, if needed, 99,241–99,396.
- Macro: Easier funding helps, but policy headlines can quickly shift tone.
Stay disciplined: harvest volatility at the edges and let confirmation lead, not anticipation.

Wall Street Weekly Outlook – Week 46 2025 (Nov 10 – Nov 14)📊💥 Wall Street Weekly Outlook – Week 46 2025 💥📊
+ High Probability SMA/EMA Cross-Over Strategy! 💥
📅 November 10 – November 14, 2025
The new trading week is dominated by one crucial question:
Are we heading toward a larger year-end correction in equities, or does the market shift back into risk-on mode? 🚀📉📈
In this video, I break down the most important market drivers for the weeks ahead. 🎥📊
Lean back and get a structured overview of which levels matter now, how hedge funds are adjusting their exposures, and which setups look most attractive from a mean-reversion perspective. 🧠💼
💡 Bonus Lessons:
EMA/SMA cross-over strategy for equities, three key macro focus themes, and actionable mean-reversion setups. ⚡️
📘 Topics covered in this weekly outlook:
+ SMA/EMA Cross-Over Strategy 🧠💼
Best,
Meikel

EURUSD Will Go Up! Long!
Here is our detailed technical review for EURUSD.
Time Frame: 12h
Current Trend: Bullish
Sentiment: Oversold (based on 7-period RSI)
Forecast: Bullish
The market is on a crucial zone of demand 1.156.
The oversold market condition in a combination with key structure gives us a relatively strong bullish signal with goal 1.169 level.
P.S
Overbought describes a period of time where there has been a significant and consistent upward move in price over a period of time without much pullback.
Like and subscribe and comment my ideas if you enjoy them!

GBPUSD Is Bullish! Long!
Please, check our technical outlook for GBPUSD.
Time Frame: 9h
Current Trend: Bullish
Sentiment: Oversold (based on 7-period RSI)
Forecast: Bullish
The market is trading around a solid horizontal structure 1.316.
The above observations make me that the market will inevitably achieve 1.329 level.
P.S
The term oversold refers to a condition where an asset has traded lower in price and has the potential for a price bounce.
Overbought refers to market scenarios where the instrument is traded considerably higher than its fair value. Overvaluation is caused by market sentiments when there is positive news.
Like and subscribe and comment my ideas if you enjoy them!

USDCAD Is Very Bullish! Buy!
Here is our detailed technical review for USDCAD.
Time Frame: 1h
Current Trend: Bullish
Sentiment: Oversold (based on 7-period RSI)
Forecast: Bullish
The market is testing a major horizontal structure 1.404.
Taking into consideration the structure & trend analysis, I believe that the market will reach 1.407 level soon.
P.S
We determine oversold/overbought condition with RSI indicator.
When it drops below 30 - the market is considered to be oversold.
When it bounces above 70 - the market is considered to be overbought.
Like and subscribe and comment my ideas if you enjoy them!

USDJPY Will Fall! Sell!
Please, check our technical outlook for USDJPY.
Time Frame: 12h
Current Trend: Bearish
Sentiment: Overbought (based on 7-period RSI)
Forecast: Bearish
The market is approaching a significant resistance area 153.342.
Due to the fact that we see a positive bearish reaction from the underlined area, I strongly believe that sellers will manage to push the price all the way down to 151.544 level.
P.S
Please, note that an oversold/overbought condition can last for a long time, and therefore being oversold/overbought doesn't mean a price rally will come soon, or at all.
Like and subscribe and comment my ideas if you enjoy them!

AUDUSD Will Go Lower From Resistance! Short!
Here is our detailed technical review for AUDUSD.
Time Frame: 2h
Current Trend: Bearish
Sentiment: Overbought (based on 7-period RSI)
Forecast: Bearish
The market is on a crucial zone of supply 0.648.
The above-mentioned technicals clearly indicate the dominance of sellers on the market. I recommend shorting the instrument, aiming at 0.643 level.
P.S
The term oversold refers to a condition where an asset has traded lower in price and has the potential for a price bounce.
Overbought refers to market scenarios where the instrument is traded considerably higher than its fair value. Overvaluation is caused by market sentiments when there is positive news.
Like and subscribe and comment my ideas if you enjoy them!

EURCHF Will Go Up From Support! Buy!
Take a look at our analysis for EURCHF.
Time Frame: 6h
Current Trend: Bullish
Sentiment: Oversold (based on 7-period RSI)
Forecast: Bullish
The price is testing a key support 0.932.
Current market trend & oversold RSI makes me think that buyers will push the price. I will anticipate a bullish movement at least to 0.935 level.
P.S
We determine oversold/overbought condition with RSI indicator.
When it drops below 30 - the market is considered to be oversold.
When it bounces above 70 - the market is considered to be overbought.
Like and subscribe and comment my ideas if you enjoy them!

AUDUSD Will Fall! Sell!
Take a look at our analysis for AUDUSD.
Time Frame: 4h
Current Trend: Bearish
Sentiment: Overbought (based on 7-period RSI)
Forecast: Bearish
The price is testing a key resistance 0.654.
Taking into consideration the current market trend & overbought RSI, chances will be high to see a bearish movement to the downside at least to 0.650 level.
P.S
We determine oversold/overbought condition with RSI indicator.
When it drops below 30 - the market is considered to be oversold.
When it bounces above 70 - the market is considered to be overbought.
Like and subscribe and comment my ideas if you enjoy them!

EURJPY Will Move Lower! Short!
Here is our detailed technical review for EURJPY.
Time Frame: 12h
Current Trend: Bearish
Sentiment: Overbought (based on 7-period RSI)
Forecast: Bearish
The market is on a crucial zone of supply 178.721.
The above-mentioned technicals clearly indicate the dominance of sellers on the market. I recommend shorting the instrument, aiming at 176.803 level.
P.S
Overbought describes a period of time where there has been a significant and consistent upward move in price over a period of time without much pullback.
Like and subscribe and comment my ideas if you enjoy them!

USDJPY Is Going Down! Short!
Here is our detailed technical review for USDJPY.
Time Frame: 2h
Current Trend: Bearish
Sentiment: Overbought (based on 7-period RSI)
Forecast: Bearish
The market is on a crucial zone of supply 154.213.
The above-mentioned technicals clearly indicate the dominance of sellers on the market. I recommend shorting the instrument, aiming at 153.254 level.
P.S
The term oversold refers to a condition where an asset has traded lower in price and has the potential for a price bounce.
Overbought refers to market scenarios where the instrument is traded considerably higher than its fair value. Overvaluation is caused by market sentiments when there is positive news.
Like and subscribe and comment my ideas if you enjoy them!

Price Cycle, post correction. Based on Qullamaggie concepts.1. Price movement starts with bearish 50dma slope.
2. advancement to upsloping 10/20dma.
3. consolidation, price discovery and 50dma NORMALIZING.
4. upslope of 50dma. 🐂
5.consolidation. Before break-out.
6. Everything upsloping. 🐂
7. extension.
Now. Best returns during post-2 phase. Which is contrarian, with a falling 50dma.

AAPL speculative swings, based on Quallamagie's 10/20/50.Where-ever AAPL would have good technical momentum swings. Should coincide with speculative, risk on periods. Think BTC rallies, etc. And they do.

BITCOIN Will Go Lower! Sell!
Please, check our technical outlook for BITCOIN.
Time Frame: 5h
Current Trend: Bearish
Sentiment: Overbought (based on 7-period RSI)
Forecast: Bearish
The market is trading around a solid horizontal structure 102,798.30.
The above observations make me that the market will inevitably achieve 97,930.04 level.
P.S
Overbought describes a period of time where there has been a significant and consistent upward move in price over a period of time without much pullback.
Like and subscribe and comment my ideas if you enjoy them!

EURUSD Will Go Down! Short!
Here is our detailed technical review for EURUSD.
Time Frame: 1h
Current Trend: Bearish
Sentiment: Overbought (based on 7-period RSI)
Forecast: Bearish
The market is testing a major horizontal structure 1.151.
Taking into consideration the structure & trend analysis, I believe that the market will reach 1.149 level soon.
P.S
Please, note that an oversold/overbought condition can last for a long time, and therefore being oversold/overbought doesn't mean a price rally will come soon, or at all.
Like and subscribe and comment my ideas if you enjoy them!

GBPJPY Will Move Lower! Sell!
Take a look at our analysis for GBPJPY.
Time Frame: 1D
Current Trend: Bearish
Sentiment: Overbought (based on 7-period RSI)
Forecast: Bearish
The market is approaching a key horizontal level 201.166.
Considering the today's price action, probabilities will be high to see a movement to 197.887.
P.S
The term oversold refers to a condition where an asset has traded lower in price and has the potential for a price bounce.
Overbought refers to market scenarios where the instrument is traded considerably higher than its fair value. Overvaluation is caused by market sentiments when there is positive news.
Like and subscribe and comment my ideas if you enjoy them!

GBPCHF Is Bullish! Long!
Please, check our technical outlook for GBPCHF.
Time Frame: 1h
Current Trend: Bullish
Sentiment: Oversold (based on 7-period RSI)
Forecast: Bullish
The market is approaching a significant support area 1.058.
The underlined horizontal cluster clearly indicates a highly probable bullish movement with target 1.061 level.
P.S
We determine oversold/overbought condition with RSI indicator.
When it drops below 30 - the market is considered to be oversold.
When it bounces above 70 - the market is considered to be overbought.
Like and subscribe and comment my ideas if you enjoy them!

GOLD Is Very Bullish! Buy!
Here is our detailed technical review for GOLD.
Time Frame: 1h
Current Trend: Bullish
Sentiment: Oversold (based on 7-period RSI)
Forecast: Bullish
The market is on a crucial zone of demand 3,965.68.
The oversold market condition in a combination with key structure gives us a relatively strong bullish signal with goal 3,993.60 level.
P.S
Overbought describes a period of time where there has been a significant and consistent upward move in price over a period of time without much pullback.
Like and subscribe and comment my ideas if you enjoy them!

GBP/JPY - Multi-Timeframe Forecast💂♂️ GBP/JPY – 8H Forecast 💂♂️
Let’s get into the flow for this beast — it’s showing that classic smart money pullback setup 👇
🧠 Bias : Short-term bullish pullback → Medium-term bearish
Structure’s still heavy on the bearish side after a clear BOS (Break of Structure) at the top, but short-term we’re seeing a retracement forming before the next leg down.
📉 8H Breakdown
The pair printed a lower high followed by a break of structure under 202.000 — confirming downside control.
Price retraced roughly to the 71% fib zone (right inside a small 8H bearish order block / BM).
The 200 EMA is acting as resistance now — rejecting perfectly from the fib confluence area.
Expect one more liquidity grab into the $202.5 – $203 zone before the next impulse down.
Target zone sits near $198.000, which aligns with that 8H + Daily demand zone below.
🗓 Daily Context
Daily structure is still bullish overall, but price tapped into a weekly supply zone around 206.000 and is now retracing.
If that daily demand near 197.500 – 198.000 holds, we could see a rebound back into 204–206 for continuation of the larger trend.
This gives us a clean sell-then-buy sequence setup.
🎯 Game Plan
Short-Term Setup:
Look for short entries around 202.500 – 203.000 (71% retrace + BM zone).
Target 198.000 for the short.
Stop above 203.500 swing high.
Reversal Watch:
Once price sweeps that 198.000 liquidity zone, monitor for bullish CHoCH (Change of Character).
Potential long back toward 204.000 – 206.000 if daily demand reacts strong.
⚙️ Risk & Trade Management
Stay flexible — short bias first, but watch for reversal signs in the daily zone.
Partial profits near 198.500.
Flip bias to bullish only after daily confirmation candle closes above 202 again.
🧩 Summary
GBP/JPY is prepping a pullback-to-sell setup into the 71% zone, then likely dumps toward daily demand before a bigger rebound. Think of it as a dip before the reload — shorts first, then a rocket reload for later. 🚀

USDJPY Is Going Down! Short!
Take a look at our analysis for USDJPY.
Time Frame: 1D
Current Trend: Bearish
Sentiment: Overbought (based on 7-period RSI)
Forecast: Bearish
The price is testing a key resistance 153.489.
Taking into consideration the current market trend & overbought RSI, chances will be high to see a bearish movement to the downside at least to 149.764 level.
P.S
Please, note that an oversold/overbought condition can last for a long time, and therefore being oversold/overbought doesn't mean a price rally will come soon, or at all.
Like and subscribe and comment my ideas if you enjoy them!

GBPUSD Will Fall! Sell!
Please, check our technical outlook for GBPUSD.
Time Frame: 1D
Current Trend: Bearish
Sentiment: Overbought (based on 7-period RSI)
Forecast: Bearish
The market is trading around a solid horizontal structure 1.302.
The above observations make me that the market will inevitably achieve 1.280 level.
P.S
The term oversold refers to a condition where an asset has traded lower in price and has the potential for a price bounce.
Overbought refers to market scenarios where the instrument is traded considerably higher than its fair value. Overvaluation is caused by market sentiments when there is positive news.
Like and subscribe and comment my ideas if you enjoy them!
