Sahara has a good entry at 0.0937sahara has a good entry today.
enter if the price is within ±2% of 0.0937.
tp: 0.15.
nb: don’t put all your funds in one basket.
Swingtrading

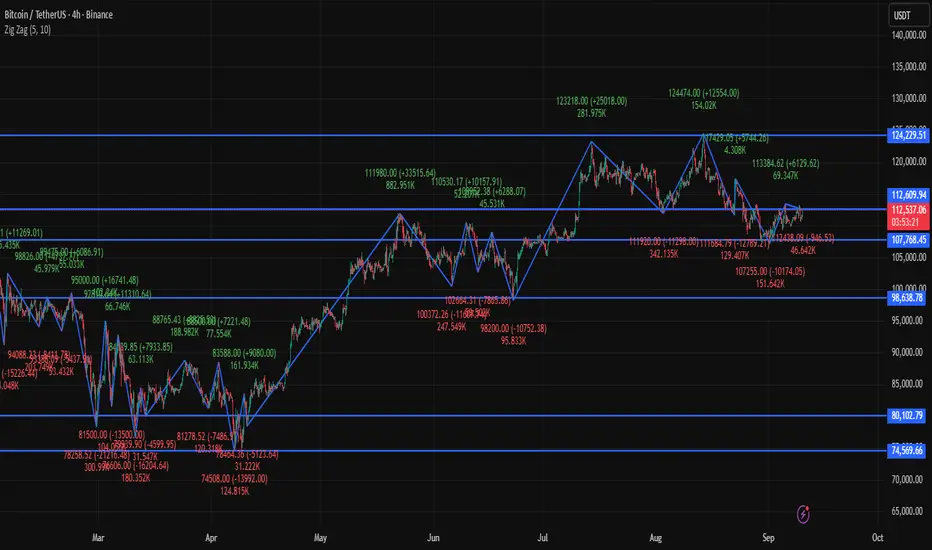
BTCUSDT 4Hour Time frame📊 BTC/USDT Snapshot
Current Price: ~$112,419
Range (Intraday): $110,812 – $113,138
Change: Around –0.5% from the last close
🔎 Key Levels (4-Hour Focus)
Support Zone: ~$106,000 (recent double-bottom area)
Current Pivot: ~$112,000 (key resistance and decision zone)
Next Resistance: ~$117,000 (if breakout holds)
📉 Technical Indicators (4-Hour Context)
RSI: In the mid-50s → showing moderate strength after bounce
MACD: Slightly positive → early bullish signal
Momentum: Neutral to bullish; recovery attempt underway
📌 4-Hour Outlook
Bullish Case: If BTC closes firmly above $112,000, it could push toward $117,000.
Bearish Case: If rejection happens at $112,000, price may slip back toward $110,000 → $106,000 support.
Bias: Consolidation with bullish potential, but resistance needs to be cleared.
✅ Conclusion: On the 4-hour chart, BTC/USDT is in a neutral-to-bullish phase, holding above its recent bottom. $112K is the key battleground — breakout could fuel upside momentum, while rejection risks another retest lower.
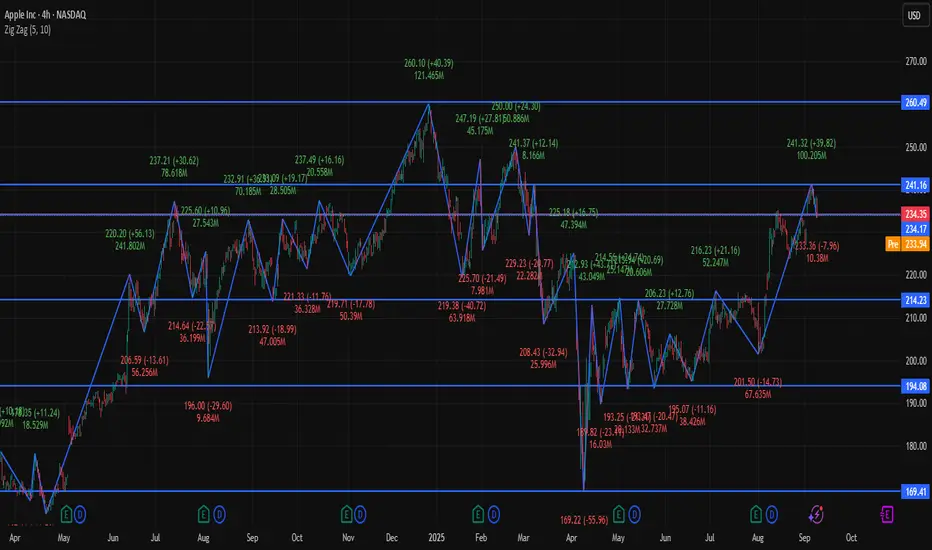
AAPL 4Hour Time frame📊 Apple (AAPL) Snapshot
Current Price: ~$234.35
Day Range: $233.01 – $238.66
Open Price: ~$236.73
Market Cap: ~$3.0 Trillion
P/E Ratio: ~30.3
EPS: ~6.59
🔎 Pivot Levels (Daily Basis → useful for 4H)
Pivot Point: ~$234.6
Resistance:
R1: ~$235.9
R2: ~$238.0
R3: ~$239.2
Support:
S1: ~$232.5
S2: ~$231.3
S3: ~$229.1
📉 Technical Indicators (4-Hour Insight)
RSI: ~40 → weak, leaning bearish.
MACD: Negative → bearish momentum.
Moving Averages: Short-term averages show Sell, long-term still supportive (Buy).
📌 4-Hour Frame Outlook
Momentum: Neutral-to-bearish; price is consolidating around the pivot zone ($234–235).
Bullish Scenario: If AAPL breaks above $238, short-term upside could open toward $239+.
Bearish Scenario: If price slips below $232, risk increases for a move toward $230.
✅ Conclusion: On the 4-hour chart, Apple is in a neutral to bearish phase, with weak momentum. Bulls need a breakout above $238 to take control, while bears may dominate if it breaks under $232.
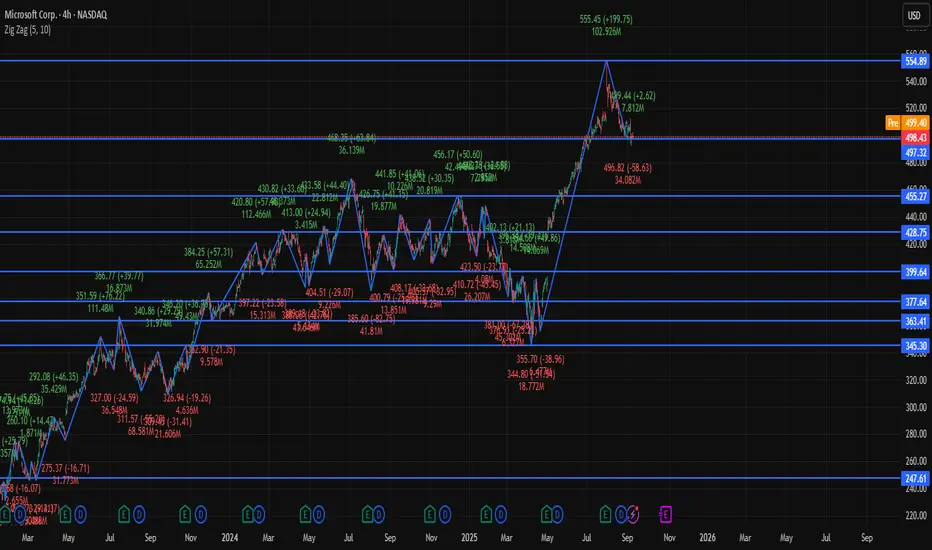
MSFT 4Hour Time frameMSFT Snapshot (as of latest session)
Current Price: Around $498.40
Day Range: $497.0 – $502.2
Open: ~$501.4
Market Cap: ~$2.79 Trillion
P/E Ratio: ~28.9
EPS: ~12.93
Pivot Levels (Daily basis, useful for 4-Hour analysis)
Pivot Point: ~$498.9
Resistance Levels:
R1: ~$499.5
R2: ~$500.0
R3: ~$500.6
Support Levels:
S1: ~$498.4
S2: ~$497.8
S3: ~$497.3
Technical View (4-Hour Frame)
Momentum: Price is consolidating near the pivot (~$498–499).
Indicators:
RSI around 45 → neutral to slightly bearish.
MACD negative → bearish bias.
Moving Averages (short and long) → leaning bearish.
Bias:
A breakout above $500 may open short-term upside toward ~$500.6 or higher.
If MSFT falls below $498, pullback risk increases toward $497.8 → $497.3.
✅ Conclusion: On the 4-hour timeframe, MSFT is in a neutral-to-bearish phase, stuck around its pivot. Buyers need a clear move above $500 to regain strength; otherwise, it risks drifting lower toward support.
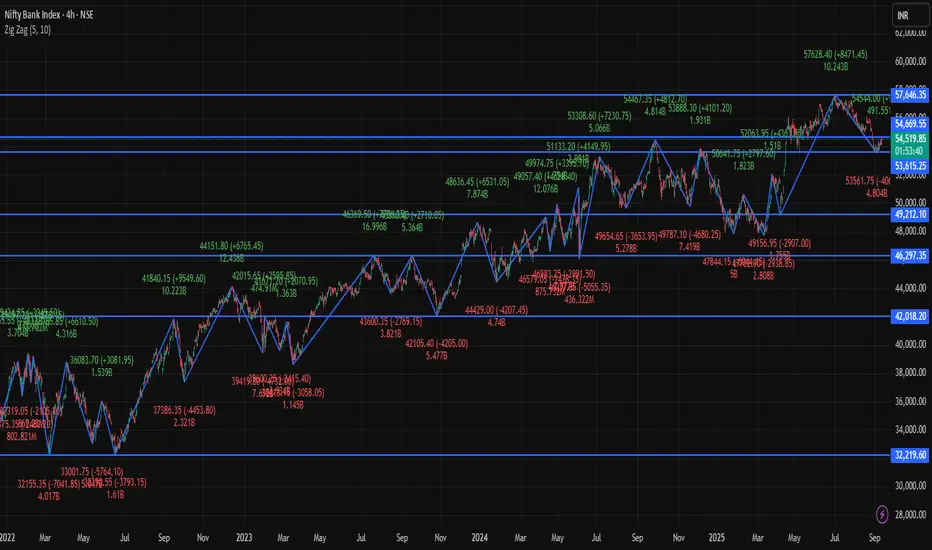
BANKNIFTY 4Hour Time frame Bank Nifty Snapshot (10 Sept 2025 – 4-Hour Chart)
Current Level: Around 54,550 – 54,650
Intraday Change: Up about +330 to +440 points (~+0.7%)
Trend: Bullish, price holding near highs
Key Pivot Levels (Daily Basis – useful on 4H)
Pivot Point: 54,352
Resistance Levels:
R1: 54,487
R2: 54,623
R3: 54,759
Support Levels:
S1: 54,215
S2: 54,080
S3: 53,944
Technical View (4-Hour Frame)
Momentum: Price is trading above R2 (54,623) → shows strong bullish bias.
Indicators: RSI near 65–70 (bullish), MACD positive, moving averages aligned upward.
Bias:
Sustaining above 54,623 → next upside toward 54,759 and beyond.
If it falls back below Pivot (54,352) → downside risk toward 54,215 or 54,080.
✅ Conclusion: On the 4-hour timeframe, Bank Nifty is bullish, trading above major resistance zones. If strength holds, higher levels are possible, but profit-booking can trigger quick pullbacks toward support.
NIFTY 4Hour Time frameNifty Snapshot (10 Sept 2025 – 4-Hour Chart)
Current Level: Around 24,990 – 25,000
Intraday Change: Up about +120 to +130 points (~+0.5%)
Trend: Bullish, with price sustaining near highs
Key Pivot Levels (Daily basis, useful for 4-Hour chart)
Pivot Point: 24,858
Resistance Levels:
R1: 24,902
R2: 24,936
R3: 24,980
Support Levels:
S1: 24,824
S2: 24,780
S3: 24,747
Technical View (4-Hour Frame)
Momentum: Nifty is trading above R3 (24,980), showing strong bullish momentum.
Indicators: RSI is in bullish territory (~65–70), MACD remains positive, and moving averages favor upside.
Bias:
Sustaining above 25,000 can lead to further upside, possibly extending gains.
If Nifty slips back below 24,980, it may retest R2 (24,936) or R1 (24,902).
✅ Conclusion: On the 4-hour timeframe, Nifty remains bullish, currently holding above its resistance zone. This suggests strong intraday and short-term strength, though some consolidation is possible around the 25,000 mark.
SENSEX 4Hour Time frameCurrent Level: Around 81,450 – 81,500
Intraday Change: Up about +350 to +400 points (~+0.5%)
Trend: Strong bullish momentum
Key Pivot Levels (for reference on 4-hour chart)
Pivot Point: 81,070
Resistance:
R1: 81,212
R2: 81,324
R3: 81,466
Support:
S1: 80,959
S2: 80,817
S3: 80,706
Technical View (4-Hour Frame)
Momentum: Trading near R3 (81,466) — showing strong buying strength.
Indicators: RSI is in bullish territory (~65), MACD is positive, and moving averages point upward.
Bias:
If Sensex sustains above R3, next upside targets can extend further beyond 81,500.
A pullback below Pivot (81,070) would shift bias toward supports around 80,960 – 80,820.
✅ Conclusion: Sensex on the 4-hour timeframe is bullish, trading near its resistance highs. Buyers are in control, though some profit-booking is possible if it struggles to stay above 81,466.
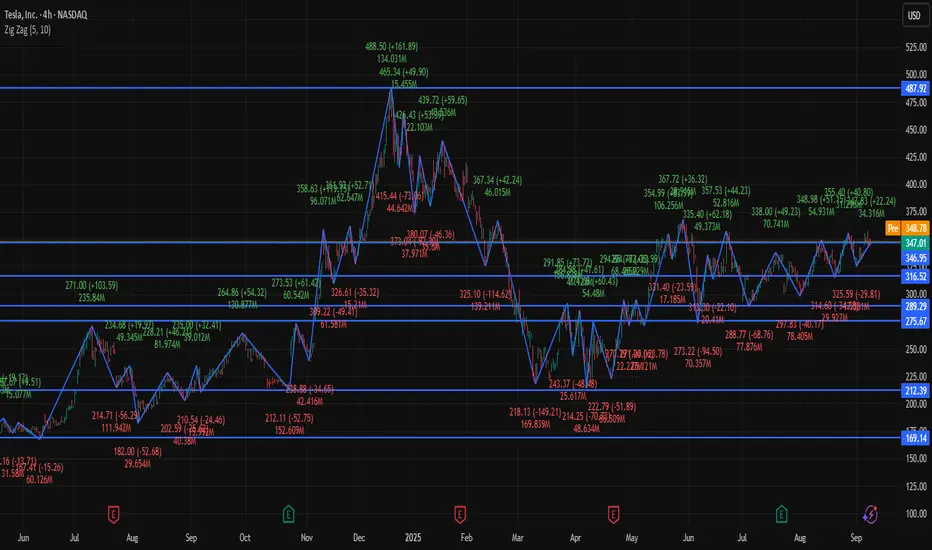
TSLA 4Hour Time frame 📊 Tesla (TSLA) Snapshot
Current Price: ~$346.97
Recent Range: ~$325 – $358
Intraday Change: Small gain (~+0.2%)
🔎 Key Levels (4H Focus)
Resistance: ~$347 – $351 (immediate ceiling)
Support: ~$325 – $330 (key downside buffer)
📉 Technical Indicators
RSI (14): ~57 → neutral with slight bullish bias
MACD: Positive → upward momentum
Moving Averages: Price trading above 20, 50, 200-period moving averages → bullish trend
Stochastics: Neutral → no overbought/oversold condition
📌 4-Hour Outlook
Bullish Scenario: Break above $347–348 could push price toward $358+.
Bearish Scenario: Drop below $330–332 could test support around $325.
Overall Bias: Moderately bullish; momentum positive but needs to clear resistance for acceleration.
✅ Conclusion: On the 4-hour chart, TSLA is in a moderate bullish phase, trading above key moving averages. The key battle zone is $347–351 for resistance, and $325–330 provides support in case of a pullback.
Energy Giant on Fire – GAIL Ready for TakeoffThis is the 4-hour timeframe chart of GAIL India Limited.
The stock is currently trading within a well-defined parallel channel and is positioned near its support zone at 165–171.
If this support level sustains, we may witness higher prices in GAIL, with potential targets in the 185–190 range.
Thank you.

EUR/USD - Critical Supply rejection for a deeper pull back📈 EUR/USD – Critical Supply Rejection or Deeper Pullback?
🕰 Weekly View
Price is moving between weekly demand (discount zone) and weekly supply.
Structure still bearish overall, but strong demand holds around 1.05–1.10.
Current swing is testing supply with imbalances below that still need filling.
📊 Daily Structure
We’ve tapped into weekly supply + daily supply overlap.
Buy-side liquidity has been swept, meaning stops above highs are cleared.
Two clear buy zones sit below:
~1.14–1.15 (daily demand + support confluence)
~1.08–1.10 (deep demand + swing range discount).
⏱ 8H Breakdown
BOS confirmed bullish push into supply, but now reacting bearishly.
Price is rejecting daily supply and likely pulling back toward daily demand at 1.15–1.16.
If that fails, we could sweep deeper into major daily support near 1.13 before continuing higher.
Bigger swing bias still favors upside after liquidity grabs — but retracements are needed first.
🎯 Trade Outlook
Scenario 1 (short-term bearish):
Supply rejection holds, price drops into 1.15–1.16 demand zone before finding support.
Scenario 2 (bullish continuation):
A deeper sweep into 1.13–1.14 demand before expansion higher.
If support holds, potential rally back into 1.18–1.19 (supply re-test).
⚡ Bias
Short-term bearish into demand → looking for a higher-low formation before the next leg up.
If demand zones fail, expect deeper retracement before bulls step back in.

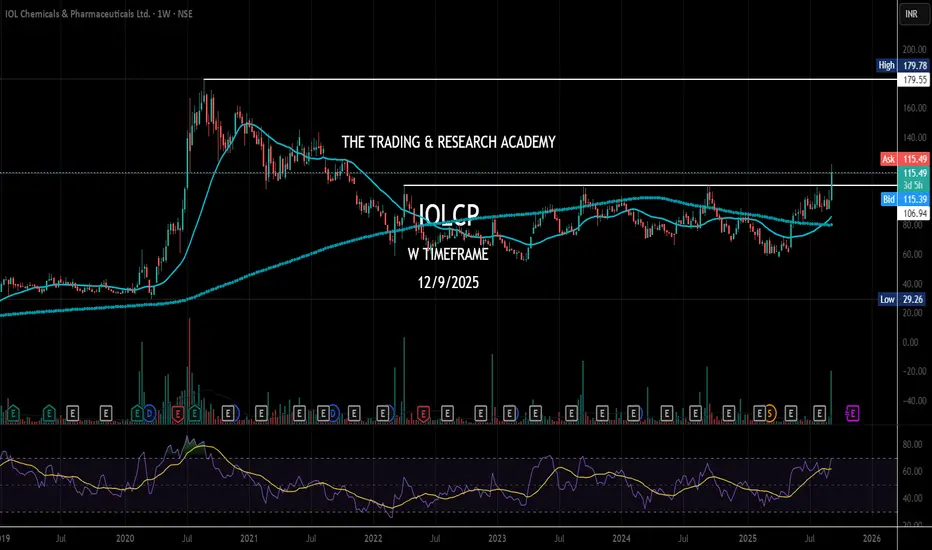
Stage Breakout - IOLCPStage Breakout - IOLCP
This counter had hit my SL in 2023 & 2024 B/o attempts. I am hopeful it would not disappoint me this time. B/o with volume seems it's getting ready.
Stage Breakout with interesting pattern. Let's see whether it reaches & crosses 180 level.
NVDA Support and Resistance Lines Valid from July 1 to 31st 2025Overview:
These purple lines act as Support and resistance lines when the price moves into these lines from the bottom or the top direction. Based on the direction of the price movement, one can take long or short entries.
Trading Timeframes
I usually use 30min candlesticks to swing trade options by holding 2-3 days max. Anyone can also use 3hr or 4hrs to do 2 weeks max swing trades for massive up or down movements.
I post these 1st week of every month and they are valid till the end of the month.

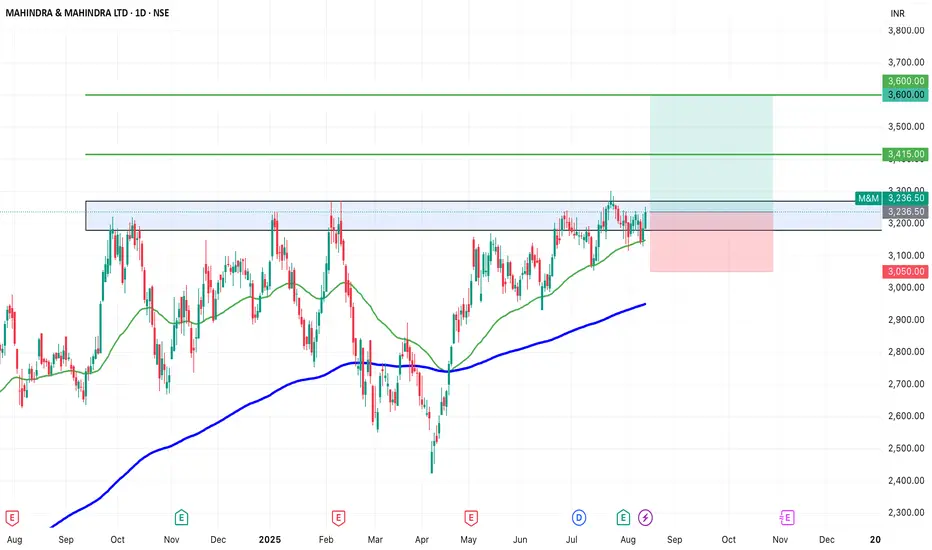
SWING IDEA - M&MM&M , a leading Indian automotive and farm equipment manufacturer, is showing signs of a potential breakout, making it a strong swing trading candidate.
Reasons are listed below :
3,200 resistance tested multiple times — now weakened and primed for a breakout
VCP (Volatility Contraction Pattern) forming, indicating accumulation
Trading above 50 & 200 EMA, confirming long-term trend strength
Inverse Head & Shoulders pattern forming, a bullish reversal setup
Target : 3415 // 3600
Stoploss : daily close below 3050
DISCLAIMER -
Decisions to buy, sell, hold or trade in securities, commodities and other investments involve risk and are best made based on the advice of qualified financial professionals. Any trading in securities or other investments involves a risk of substantial losses. The practice of "Day Trading" involves particularly high risks and can cause you to lose substantial sums of money. Before undertaking any trading program, you should consult a qualified financial professional. Please consider carefully whether such trading is suitable for you in light of your financial condition and ability to bear financial risks. Under no circumstances shall we be liable for any loss or damage you or anyone else incurs as a result of any trading or investment activity that you or anyone else engages in based on any information or material you receive through TradingView or our services.
@visionary.growth.insights
Tata Motors Inverted Head n ShoudlersTata motors is making an inverted Head n Shoulder on the daily timeframe. A long entry can be made in this scrip at the retest levels of around 704-706. Support can be 670 which is the right shoulder low for Swing traders and for intraday traders todays low can be the support.
Targets can be 740 750 for swing. Look at the chart for understanding how an Head n Shoulder works and follow for more such ideas.
Disclaimer- This is just for educational purpose.
Jai Shree Ram.

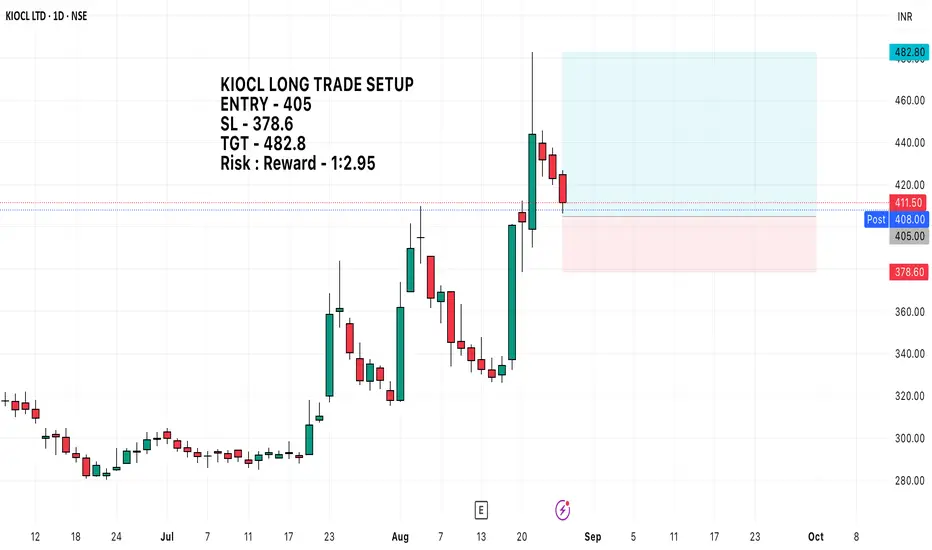
KIOCL Long setupKIOCL LONG TRADE SETUP
ENTRY - 405
SL - 378.6 (Max SL stretch to 375)
TGT - 482.8
Risk : Reward - 1:2.95
NZD/USD - Bearish Trade Setup followed by a Bullish movement📉 NZD/USD – Bearish Setup Building
🕰 Weekly View
Price is still locked inside a HTF bearish trend, with lower highs holding under the bearish trendline.
Strong demand reactions have appeared, but structure remains heavy, pointing toward continuation lower.
Market is ranging inside a swing range — liquidity building on both sides.
📊 Daily Structure
Clear CHOCH → BOS sequence confirming bearish order flow.
Price tapped into daily demand + IMB but failed to fully reverse.
Now trading back into the 8H BOS range, leaving sell-side liquidity exposed below.
0.618–0.71 fib zone aligns with bearish continuation confluence.
⏱ 8H Breakdown
Buy-side liquidity swept, stops cleaned above local highs.
Price has returned into supply, rejecting strongly.
Targeting the daily IMB & extreme demand zone around 0.5690 – 0.5720.
Major support sits just below, aligning with Fibonacci + previous swing lows.
🎯 Trade Plan
Entry: 0.5880 (confirmed rejection at supply)
Stop: 0.5933 (above recent liquidity sweep)
Target: 0.5690 zone (daily IMB / extreme demand)
RR: 3.5R setup
⚡ Bias
Bearish – looking for continuation into demand.
Only a break above 0.5935–0.5950 would invalidate this short-term short.

Buy Jones Lang LaSalleShort Term Trading Advice by Naranj Capital
Buy Jones Lang LaSalle
● Buy Range- 297 - 300
● Target- 312 - 316
● StopLoss- Below 285
● Potential Return- 4-5%
● Duration- 14-15 Trading Days

NCCi Observed these Levels based on Price Action and Demand & Supply which is my own Concept "PENDAM CONCEPTS"... Please don't take any trades based on this chart/post... Because this chart is for educational purpose only not for Buy or Sell Recommendation... Thank Q

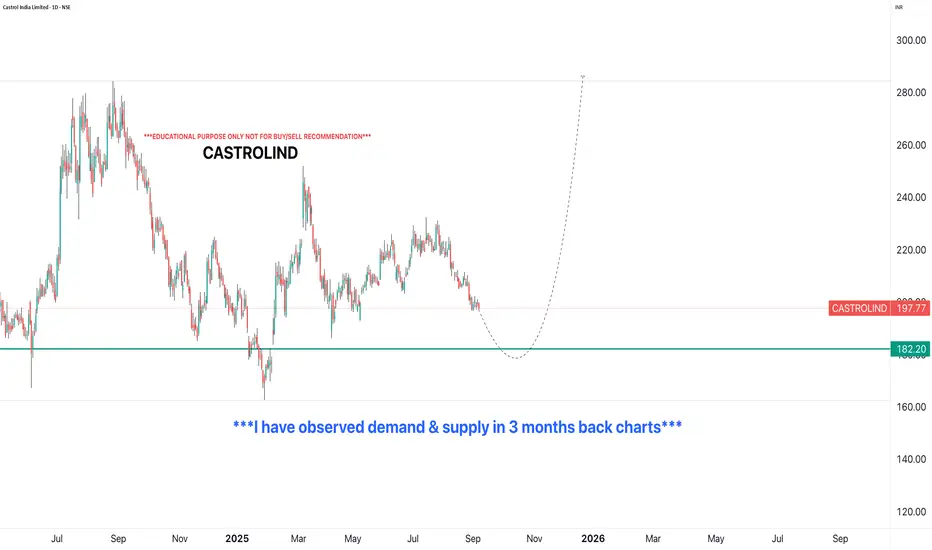
CASTROLINDi Observed these Levels based on Price Action and Demand & Supply which is my own Concept "PENDAM CONCEPTS"... Please don't take any trades based on this chart/post... Because this chart is for educational purpose only not for Buy or Sell Recommendation... Thank Q
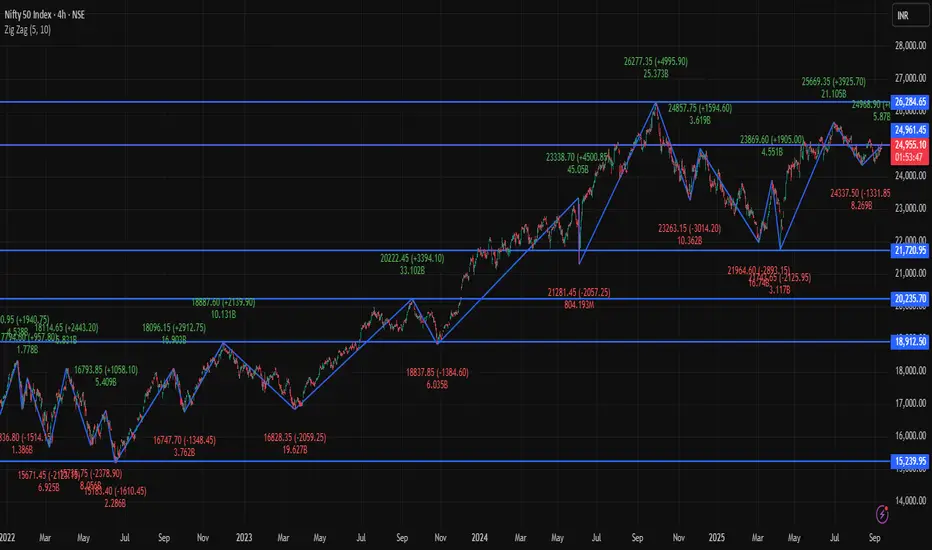
Nifty at a Crossroads – Will W Pattern Hold or Breakdown Ahead?Nifty closed the week at 24,741, up 315 points from the previous close. It touched a high of 24,980 and a low of 24,432, once again moving exactly within my projected range of 24,900 – 23,900.
This week, both Nifty and Bank Nifty formed an Inside Candle pattern, making this week’s low of 24,432 a crucial level to watch. A breakdown below it could drag Nifty toward 24,000/23,900.
Bullish Possibility – W Pattern on Weekly Chart
There’s an interesting W pattern developing on the weekly timeframe. If it plays out, we could see an early-week upside (Mon/Tue) toward 25,100/25,200. However, for a sustained rally, Nifty needs to hold above 25,200 – only then can it test 25,700, which for now looks challenging.
⚠️ My View
I’ve been warning about an impending downmove for 2 weeks, and I continue to prepare by hedging my portfolio and making a watchlist of strong stocks to accumulate when the correction comes. The question is – are you ready?
US Market Update – S&P500
The S&P500 closed at 6,481, up 21 points from last week, with a high of 6,532 and a low of 6,360. This index is approaching the key Fibonacci level of 6,568.
👉 For US investors: Move your trailing SL to 6,376 to lock in profits.
👉 Consecutive closes above 6,568 could open the doors to the next major level of 6,579 (around 7% higher from current levels).
👉 Until then, keep trailing positions as long as cracks aren’t visible.
For Indian investors – brace yourselves, because the road ahead could be volatile and bumpy.
Want me to review any index or cryptocurrency for you? Drop it in the comments, and I’ll cover it in my next update!

XRP — $2.5 Liquidity Zone Could Trigger the Next RallyAfter hitting a new all-time high (ATH) on 18th July, XRP failed to hold the previous ATH ($3.40) as support. This breakdown led to a –25% drop, finding support at the 0.5 Fib retracement of the $1.90 → $3.66 move, followed by a solid +24% bounce back to the pATH (200B MC at $3.36) and 0.702 Fib retracement → an ideal short opportunity.
Now XRP has been trending in a descending triangle pattern for 50 days, with $3 acting as the key resistance. This level is the Point of Control (POC) of the last 75-day trading range, adding weight to its importance. On top of that, the anchored VWAP (~$3.035) is currently reinforcing $3 as additional resistance.
🧩 Confluence Support Zone ($2.665–$2.45)
Liquidity cluster: many stop-losses reside here
Anchored VWAP (support): ~$2.62
Yearly anchored VWAP: $2.59 → strong support level
Golden Pocket (0.618–0.666): $2.5777–$2.4936
21 EMA ($2.665) / 21 SMA ($2.576) (weekly): dynamic HTF support
233 EMA ($2.44) / 233 SMA ($2.53) (daily): strong moving average cluster
Market Cap Support: $2.52 aligns with the $150B level
1.0 Trend-Based Fib Extension: $2.4498 → aligning perfectly with the $2.5 support zone as a reversal point
This creates a high-probability long entry zone between $2.665–$2.45, with multiple overlapping technical factors.
🟢 Long Trade Setup
Entry Zone: $2.665–$2.45
Stop-Loss: Below $2.25 for now, to be adjusted once price action confirms a reversal.
Potential Gain: up to +60% depending on execution
Technical Insight
After 50 days of correction, XRP is approaching a major liquidity and confluence zone.
The golden pocket, VWAP, EMA/SMA clusters, market cap support, and 1.0 Fib extension all stack together at around $2.5, making it a powerful reversal point.
Meanwhile, $3 remains the key resistance, reinforced by the POC of the last 75-day range and the anchored VWAP (~$3.035). Bulls must reclaim this level to confirm bullish continuation.
Key Levels to Watch
Support: $2.665–$2.45 (reversal zone)
Resistance: $3.00
🔍 Indicators used
Multi Timeframe 8x MA Support Resistance Zones → to identify support and resistance zones such as the weekly 21 EMA/SMA.
➡️ Available for free. You can find it on my profile under “Scripts” and apply it directly to your charts for extra confluence when planning your trades.
_________________________________
💬 If you found this helpful, drop a like and comment!

JPY "Call Butterfly" Update: Not Closed — But Sold
Yesterday’s CME data shows movement in the JPY futures call butterfly (centered at 0.00705):
The entire portfolio was re-sold — not closed.
(See arrow on chart: futures price at moment of transfer.)
🧠 What’s Going On?
Instead of unwinding the position during the dip, the market saw a transfer of ownership.
This suggests:
Another player stepped in to buy it cheaper
He believes JPY futures still has upside potential by expiry
Confidence remains — just in different hands
✅ Bottom Line:
The butterfly didn’t exit — it changed hands.
Likely moved to a more informed or confident trader.
Sentiment: moderately bullish (USDJPY - bearish), not fading.
However, from a technical standpoint, we can’t yet speak of bullish confirmation in JPY futures.
A key condition must be met first:
✅ A clear break USDJPY and close above the local low.
And in my methodology, "confirmation" means:
📌 Price must stay above (below) that level for at least 24 hours after the breakout (chart attached)

ZEC ANALYSIS📊 #ZEC Analysis
✅There is a formation of Falling Wedge Pattern on daily chart with a breakout and currently pullback around its major support zone🧐
Pattern signals potential bullish movement incoming after sustain above the major support zone.
👀Current Price: $40.36
🚀 Target Price: $54.41
⚡️What to do ?
👀Keep an eye on #ZEC price action and volume. We can trade according to the chart and make some profits⚡️⚡️
#ZEC #Cryptocurrency #TechnicalAnalysis #DYOR
