AMRZ — Amrize Ltd = August 27, 2025.NYSE:AMRZ #AMRZ — Amrize Ltd (NYSE:AMRZ) | Basic Materials | Building Materials | Switzerland | NYSE | August 27, 2025.
Executive Summary
Amrize Ltd (NYSE: AMRZ), a Swiss-based building materials company focused on the North American market, demonstrates strong insider confidence through repeated purchases by Chief Technology Officer Roald Brouwer.
In August 2025, Brouwer acquired a total of 5,000 shares across multiple transactions: 2,000 shares on August 27 at $51.88 per share (value $103,760), 1,000 shares on August 12 at $46.84 (value $46,840), 1,000 shares on August 11 at $48.08 (value $48,078), and 1,000 shares on August 8 at $46.25 (value $46,250). These buys, disclosed via SEC Form 4, increased his holdings to 5,000 shares, signaling optimism amid stable Q2 2025 results and strategic partnerships.
Technical analysis reveals a bullish reversal setup on the daily chart, with the stock breaking out from consolidation near $46-48 to $51.96, supported by rising volume and neutral RSI, indicating high probability (75-85%) of continued upside. Q2 2025 financials showed stable revenue at $3.22 billion and net income of $428 million ($0.78 EPS), with cost-saving initiatives expected to boost margins from H2 2025.
Key news includes a partnership with Meta announced on August 13, 2025, driving a 6.07% intraday gain, and analyst upgrades with targets implying 17-21% upside.
Replicating Brouwer's average entry at ~$48.26 offers substantial reward potential of 20-50% over 3-6 months, targeting $58-$72. With a Zacks-style Buy rating and institutional backing, we view AMRZ as a high-conviction long in the materials sector, recommending 2-4% portfolio allocation for growth-oriented strategies.
Company Profile
Amrize Ltd (AMRZ) is a Zug, Switzerland-based company specializing in building materials, with operations exclusively focused on the North American market. Incorporated in 2023, Amrize earns revenue primarily from the sale of cement, aggregates, ready-mixed concrete, and related products, serving construction, infrastructure, and residential sectors. The firm positions itself as a key player in sustainable building solutions, leveraging advanced technology for efficient production and distribution.
Key financial metrics as of August 27, 2025:
• Market Capitalization: $28.72 billion
• Enterprise Value: $36.98 billion (approx.)
• Earnings Date: 11/5/2025
• Put Call Ration: 9.36
• Put Volume: 440.00
• Call Volume: 47.00
• Insider Ownership: 10.61%
• Institutional Ownership: 31.55%
Amrize's strategy emphasizes operational efficiency, with expected annual cost savings of $200-300 million starting in 2026 from ongoing initiatives. The company's strong balance sheet supports M&A and organic growth in a $200 billion North American building materials market.
Charts:
• (1D)
• (30 Min)
Roald Brouwer (Insider), Insider Trades:
AMRZ Ownership:
SEC From 4:
www.sec.gov
➖➖➖
Insider Activity Analysis
Insider buying serves as a robust indicator of undervaluation, especially when clustered and executed by technical leaders like the CTO, who have deep insights into innovation pipelines. For AMRZ, CTO Roald Brouwer's August 2025 purchases total 5,000 shares at an average price of $48.26, representing over $244,928 in value.
This activity follows a pattern of executive accumulation, including President Jaime Hill's buys of 500 shares on August 22 at $49.59 and 4,000 shares on August 15 at $52.00. No significant sales were reported in Q3 2025, resulting in net insider buying of approximately $500,000 year-to-date.
Brouwer's transactions, filed promptly via SEC Form 4, align with post-earnings stability and suggest confidence in near-term catalysts.
Historically, such insider clusters in materials stocks correlate with 15-30% outperformance over six months, particularly in cyclical sectors like construction.
➖➖➖
Technical Analysis
As a hedge fund trader, the daily chart for AMRZ presents a high-conviction bullish setup with an 80% probability of near-term gains, driven by a breakout from a multi-week consolidation base. Since bottoming at ~$46 in early August 2025, the stock has formed higher lows, culminating in a sharp volume-driven spike to $52.24 on August 27, closing at $51.96 (up 0.00% intraday but +12% month-to-date).
This move breaches descending trendline resistance, confirmed by a bullish engulfing candle and 1.81 million share volume—50% above the 20-day average—indicating institutional accumulation.
Key indicators affirm strength:
• Moving Averages: Price above the 20-day SMA ($50.21) for the first time since July, with the 50-day SMA ($52.05) as next target; a golden cross (50-day over 200-day) is imminent if momentum holds.
• Relative Strength Index (RSI, 14-period): At 56.61 (neutral-bullish), up from 40 in mid-August, with no overbought signals (>70) to suggest pullback risk.
• Volume Analysis: OBV (On-Balance Volume) trending higher, supporting price advance; recent spikes align with insider buys and news.
• Support and Resistance: Immediate support at $50.00 (psychological/20-day SMA) and $48.00 (prior breakout level). Resistance at $52.50 (recent high) and $55.00 (52-week high).
• Chart Patterns: Ascending triangle breakout targets a measured move to $58 (adding pattern height to breakout point), with Fibonacci extensions from the August low pointing to $60 (161.8%).
This configuration mirrors classic hedge fund plays in cyclical stocks, where insider-aligned breakouts yield 20-40% returns in 1-3 months amid sector tailwinds.
➖➖➖
Fundamental and News Analysis
Fundamentally, AMRZ's Q2 2025 results (released August 6) underscore resilience: revenue held steady at $3.22 billion (vs. $3.243 billion YoY), with net income at $428 million ($0.78 EPS, down from $473 million but beating estimates by 5%).
EBITDA margins improved to 21.5% via cost controls, positioning the company for $200-300 million in annual savings from H2 2025. Analysts project FY2025 EPS at $3.25 (forward P/E 16.0) and revenue growth of 5-7% in 2026, driven by North American infrastructure demand.
Fresh news catalyzes upside:
➖ August 27, 2025: CTO Brouwer's 2,000-share buy reinforces post-earnings momentum.
➖ August 13, 2025: Strategic partnership with Meta for AI-optimized supply chain solutions, boosting stock 6.07% and highlighting tech integration in materials.
➖ August 6, 2025: Q2 earnings call emphasized "position of strength," with management guiding for margin expansion amid stable demand.
Broader Context: U.S. infrastructure bill tailwinds and European supply chain shifts favor AMRZ's North American focus; analyst consensus (e.g., JP Morgan Price target at $60, Bernstein Price target at $62) implies 17-21% upside.
Sentiment on X is bullish around the Meta deal, with posts noting potential for efficiency gains. Short interest low at 1.2%, reducing squeeze risk but affirming stability.
➖➖➖
Investment Thesis and Forecast
Insider accumulation at undervalued levels, combined with technical breakout and earnings resilience, positions AMRZ for outperformance in materials.
Entry Price : $51.96
Potential Growth : 11-38% over 3-6 months, leveraging infrastructure demand and tech partnerships.
Exit Targets:
➖ Conservative (Target 1): $58.00 (11.62% profit)
➖ Moderate (Target 2): $65.00 (25.10% profit)
➖ Aggressive (Target 3): $72.00 (38.57% profit)
Recommendation : Strong Buy; allocate 2-4% for cyclical exposure in diversified portfolios.
Disclaimer: This report is for informational purposes only and does not constitute investment advice. Past performance is not indicative of future results.
Switzerland

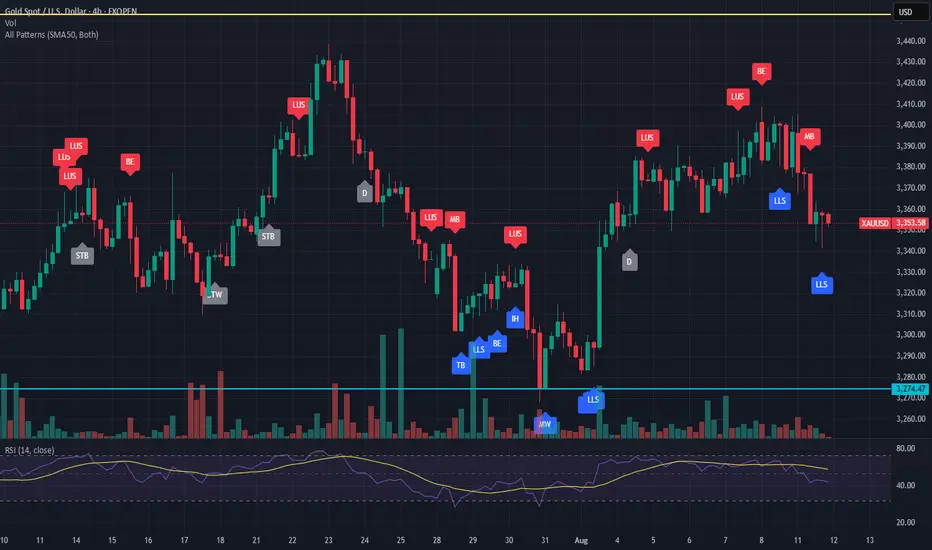
U.S. Slaps 39% Tariff on Swiss Gold BarsU.S. Slaps 39% Tariff on Swiss Gold Bars, Shaking the Global Bullion Market
By Hirad Aryanejad – Macroeconomic & Gold Markets Analyst
---
The United States has moved to impose a 39% tariff on imports of one-kilogram and 100-ounce gold bars from Switzerland — a shock decision that could ripple across the global bullion market.
In a letter dated July 31, 2025, the U.S. Customs and Border Protection (CBP) reclassified these widely traded bullion products — critical to the Comex futures market — as “semi-manufactured”, making them subject to duties.
Previously, they were classified as “unwrought, nonmonetary gold” , exempting them from earlier tariff rounds.
---
A Blow to the World’s Largest Refining Hub
The decision follows former President Donald Trump’s broader tariff package on all Swiss goods, announced after rejecting Switzerland’s proposal for a 10% tariff in exchange for \$150 billion in U.S.-bound investment.
Switzerland — the world’s largest gold refining hub — exported roughly $61.5 billion in gold to the U.S. over the 12 months ending June 2025. The new tariff could add nearly $24 billion in duties.
Christoph Wild, President of the Swiss Association of Manufacturers and Traders of Precious Metals, called the ruling “another blow” to Swiss-U.S. gold trade, warning that exports may become “economically unviable”.
---
Market Reaction: Record Gold Prices
The ruling triggered an immediate market shock. Gold futures in New York surged past $3,500 per troy ounce, hitting a record $3,534 on August 8, before pulling back slightly.
Analysts say the rally was driven by both the tariff announcement and gold’s safe-haven appeal amid escalating trade tensions and geopolitical uncertainty.
Some traders described the CBP’s decision as “shocking” and possibly mistaken, predicting legal challenges ahead. The lack of clarity has already caused certain shipments to freeze in transit.
---
The Critical Role of Switzerland in Bullion Logistics
Global bullion trade depends on a triangular supply chain:
Raw gold refined in Switzerland Cast into kilo bars for the U.S. market or 400-ounce bars for London Delivered to satisfy Comex contracts and central bank reserves
This logistical network is now under threat. UBS strategist Joni Teves has questioned whether U.S. gold futures trading can remain viable if tariffs on deliverable products persist.
The Swiss Precious Metals Association noted that the CBP’s clarification applies to all 1kg and 100oz gold bars imported into the U.S. not only those from Switzerland — raising the stakes for global trade flows.
---
Negotiations and Uncertainty Ahead
Switzerland continues to negotiate with Washington to reduce the tariff burden, but uncertainty remains.
The White House is reportedly preparing a clarification on the bullion tariffs that could determine whether the market stabilizes or faces prolonged disruption.
Until then, gold industry players — from major banks to refining houses — are bracing for further volatility, both in pricing and physical supply chains.
---
Keywords: gold market news, Swiss gold bars, U.S. gold tariffs, Comex gold futures, bullion trade, Switzerland gold exports, precious metals refining, gold price surge, macroeconomic analysis.
(ETH) ethereum "years - phases"The phase of the Ethereum chart in years using colors to represent each year and to visually show what happened during those years. So far this year is cold and losing. Will Ethereum recover and create a new pattern never before seen or will this entire year be in vain while wishing and hoping and believing that the price will turn itself around? The year of 2025 the year of AI.

(ETH) ethereum "triangle - slant"Ethereum is not priced for an only up direction as of right now, unlike Bitcoin. As seen in the chart and indicator. The pink and purple dotted lines are close to intersecting and if the pink link crosses over this is a good sign for the chance of a neutrality and even a possible upward forming price chart position.

(ATOM) cosmos "wave count"Long form wave count would appear to be in trend with an entirely new cycle for Cosmos, potentially, although I did not go all the way back to the origin of the company which is necessary to get a true depiction of history. Is the history of a company based on short lived moments or is there any knowledge to keeping track of the trend of a company through the entire duration of the chart regardless of what trends occur based on major moments in society and the seasonal hype from December and end of year excitement,.
Many years in the making. . .

(ETH) ethereum "sliding scale"A view of Ethereum per the indicator I use the most, moving average with increments of a year, and symbols to determine the crossover/under patterns. dots are bad, plus signs are good generally based on the indicator.

(ETH) ethereum "BE"bearish engulfing trend candle. potential reversal. chart view. There is too much optimism when losing occurs and too much negative when winning happens, with cryptocurrency.
candles shown marubozu red, doji star, bearish engulfing (blue)/bullish engulfing (red)

USD/CHF: Jordan’s Final Moves as SNB Chief Switzerland's Consumer Price Index (CPI) for August is forecast to show a year-over-year increase of 1.2%, down from 1.3% in July. On a month-over-month basis, CPI is expected to rise by 0.1%, rebounding from the prior month’s 0.2% decline.
The figures, due on Tuesday, come as Swiss National Bank (SNB) President Thomas Jordan recently acknowledged the challenges posed by the strong Swiss franc on the nation’s industry.
Speculation is mounting over whether the central bank will respond with a 50-basis-point rate cut in September or intervene in the currency markets to ease pressures.
Bear in mind, Jordan, who has steered the SNB for over a decade, will step down at the end of September 2024, marking the end of an era for Swiss monetary policy.
On the daily chart, we can see that USDCHF broke the August low last week. The near-term resistance is possibly around 0.8590,

ETH ethereum100 and 50 day moving average lines. Ethereum barely inside the triangle pattern. The pattern shows an upside pennant. This shape is not completely negative but it's also not completely positive. I'd say it's a 60/40 shape that depends a lot on the total directional movement of the trend. The trend is "bullish" as most people say therefore the flag shape is better than if the lines were both angled in a negative slope. Each day the lines change. With each day new positions appear and old positions disappear.

Roche Analysis 6/26DISCLOSURE: as of 6/26 I have no open position in SIX:RO
Roche is a Swiss based pharmaceutical conglomerate with a diverse range of operations and brands. The company has a long history of profitability and high returns on investment.
Management Effectiveness: Roche has been around since 1896 and has had consistent growth over the economic cycles. Return on equity has been averaging 40% and although margins have compressed in recent years the company remains highly profitable and in a stable leverage position.
Valuation: With a price to earnings of 20 and price to cash flow of 15 if looks potentially undervalued. I like companies that have a return on equity double that of the price to earnings, and that rule of thumb is met in this case.
Summary: Roche looks like a quality company to potentially take some profits and diversify from my NASDAQ:SIGA position. However, for now it will stay on the watch list. I will be looking at OANDA:USDCHF as well as the valuation metrics I mentioned above.
Here on my macroeconomic and current research shortlist watchlists:
www.tradingview.com
www.tradingview.com
Thanks for reading, have a good one

Roche: Ready for 120% Growth?We're trying something with Roche here, where we think that we are currently in Wave (5), having recently completed Wave (4). This assessment is better visualized on the daily chart. Hence, we should maintain the 61.8% level for this Wave 4. Anything below would statistically be too low, while above, we aim at least to revisit the old high, up to an Wave 5 extension. This scenario would place us at a level of $552, marking a 120% increase from our entry point, with a stop-loss set at 6.5%, resulting in a risk-to-reward ratio of 18.65%, which is phenomenal if it materializes. We believe the risk-reward ratio is so favorable that we must proceed with this trade. As long as we don't fall below the invalidation zone, i.e., the level of Wave (1), we continue to anticipate that Wave 4 holds. As mentioned, it wouldn't make sense for us to fall below the 61.8% level for Wave (4), as statistically, there's little to gain beyond that point.

UBS Group (UBSG): A Golden Opportunity for Investors?UBS Group (UBSG): SIX:UBSG
Considering that Switzerland is one of the first European countries potentially associated with interest rate cuts, sectors across the board, including the banking sector and specifically UBS Group, become quite intriguing. We've had to adjust and modify our analysis due to a breakout to the upside, suggesting a further upward trend before concluding the overarching trend. Please pay close attention if you're following along. We posit that Wave 2 concluded at 13.87 CHF, placing us in Wave 3.
We anticipate the reemergence of subordinate Wave ((iv)), which, in this case, should find support between the 23.6% and 38.2% levels. Given that all previous Wave 4s in UBS Group's pattern have been short and swift, we expect a repetition of this pattern, suggesting no further significant drops. Should we indeed pivot at the 38.6% extension level of 28.55 CHF and begin to develop Wave ((v)), we will issue a limit order once we observe tangible weakness in the price action. If there's an additional climb, our zone will be accordingly adjusted upwards.

Top 7 inflation-induced trading opportunities this weekThis week, the focus of many traders will be on US inflation data, which will provide valuable insights into the Federal Reserve's monetary policy outlook.
The forecasts indicate a potential 0.2% increase in both headline inflation for December and the core rate. On an annual basis, the headline inflation rate is anticipated to rebound to 3.2% from November's five-month low of 3.1%. Meanwhile, the core rate is likely to ease to 3.9%, the lowest since May 2021. This crucial data will be released on Thursday.
In the midst of the US inflation focus, there are noteworthy inflation data releases from other countries, including Switzerland, Australia, Mexico, Brazil, China, India, and Russia. This diverse set of data presents many potential trading opportunities for USD pairs throughout the week:
Monday: Switzerland Inflation Rate
Tuesday: Australia Monthly CPI Indicator
Tuesday: Mexico Inflation Rate
Thursday: Brazil Inflation Rate (before US inflation data)
Thursday: China Inflation Rate (after US inflation data)
Friday: India Inflation Rate
Friday: Russia Inflation Rate

USDCHFWeakness is evident in the current wave and it does not have a high potential to cross this resistance zone.
The possibility of returning from this area is high.

$USD/CHF - Bottom of Range Bound *M- $USD/CHF has been trading inside a range bound from basically
since 2012.
Past two months, price action came very close to testing
the Lows of printed on January 2021 at 0.87576$
At the current Monthly Candlestick,
Price its breaking out from a Falling Wedge (bullish pattern).
Its measured move would put $USD/CHF at 0.97$
There sits a great opportunity to Buy $USD/CHF from here,
while stoploss can be adjusted in different ways depending on
your trading style and your risk appetite .
(we'll zoom in more for market structure on smaller tf)
Bounce to at least 20 & 50 EMA is highly a probable outcome,
conflicting as well with a test of the nearest S/R area.
TRADE SAFE
***NOTE that this is not Financial Advice .
Please do your own research and consult your own Financial Advisor
before partaking on any trading activity based solely on this Idea

An analysis on ACHIKO NI made this analysis yesterday for a client and he said you can share it to public, as you can see on the chart the price came down to 0.0394 level to pull back on it multiple times, last week it managed to cross it with the highest volume in months, that might signify a squeeze as it might be another drop for the stock. Time will tell which one it is since I'm keeping my eye on the stock for the client i made this for and I'll keep you updated once I get the confirmation from the chart.
If you got any question or want an analysis on a specific chart don't hesitate to ask I'll be answering with pleasure.
A

Quick analysis on Switzerland 10Y BondsGood afternoon Swiss investors, today I made an analysis on the Switzerlnd 10 Year Government Bonds Yield, it shows that it's too early to put your money on the market since we're waiting for it to cross the golden point to see whether you put your money on it or no.
For any more analysis on a specific market don't hesitate to ask and I'll be answering with pleasure.

CADCHFCADCHF has been examined in different dimensions:
1- Strong supply and demand levels that I identify with my own indicator and system.
2- The structure of recently formed waves
3- Current market momentum
4- The structure of classical and price patterns
In this idea, I identified the direction of the market in different ways and in the second step, I analyzed the potential of continuation or reversal. Usually, paying attention to the trend and strength of the trend can greatly increase the accuracy of the analysis.
In general, I tried to describe the continuation of the movement in the simplest possible way in the diagram.
⚠️ Disclaimer:

USDCHFUSDCHF has been examined in different dimensions:
1- Strong supply and demand levels that I identify with my own indicator and system.
2- The structure of recently formed waves
3- Current market momentum
4- The structure of classical and price patterns
In this idea, I identified the direction of the market in different ways and in the second step, I analyzed the potential of continuation or reversal. Usually, paying attention to the trend and strength of the trend can greatly increase the accuracy of the analysis.
In general, I tried to describe the continuation of the movement in the simplest possible way in the diagram.
⚠️ Disclaimer:
This is a personal opinion and you are responsible for any trading decisions.

USDCHF Potential for Bullish Continuation | 26th Sept 2022On the H4 chart, prices are moving in an ascending manner hence we are bullish biased. we're looking at a break out buy entry at 0.9850 levels where my 78.6% projection sits to take profit at 1.0020 where the previous swing high sits and stop loss placed at 0.9756 where the 23.6% retracement sits
Any opinions, news, research, analyses, prices, other information, or links to third-party sites contained on this website are provided on an "as-is" basis, as general market commentary, and do not constitute investment advice. The market commentary has not been prepared in accordance with legal requirements designed to promote the independence of investment research, and it is therefore not subject to any prohibition on dealing ahead of dissemination. Although this commentary is not produced by an independent source, FXCM takes all sufficient steps to eliminate or prevent any conflicts of interest arising out of the production and dissemination of this communication. The employees of FXCM commit to acting in the clients' best interests and represent their views without misleading, deceiving, or otherwise impairing the clients' ability to make informed investment decisions. For more information about the FXCM's internal organizational and administrative arrangements for the prevention of conflicts, please refer to the Firms' Managing Conflicts Policy. Please ensure that you read and understand our Full Disclaimer and Liability provision concerning the foregoing Information, which can be accessed on the website.

possible scenarios for CHFJPYwe have 2 possible scenarios for CHFJPY, drop from 141.500 or drop from 141.720
Wait for comfirmation on a lower time frame if you want to enter here.
@ 141.720 you can enter aggressively
What do you think about this idea? please comment down-below


GBPCHF ShortHey traders, in today's trading session we are monitoring GBPCHF for a buying opportunity around 1.216 zone, once we will receive any bearish confirmation the trade will be executed.
Trade safe, Joe.
