Big pattern alert on Varun Beverages Ltd.Eyes on the move..Varun Beverages Ltd (VBL) – Technical Update
On the daily chart, VBL is trading within a well-defined parallel channel, with a strong support zone around ₹425–437.
The stock is also forming a Symmetrical Triangle Pattern, with immediate support in the ₹450–460 zone.
If these levels hold and sustain, we may witness higher price levels in the coming sessions.
Chart structure indicates strength – keep this stock on your watchlist.
Thank you!
Symmertricaltriangle

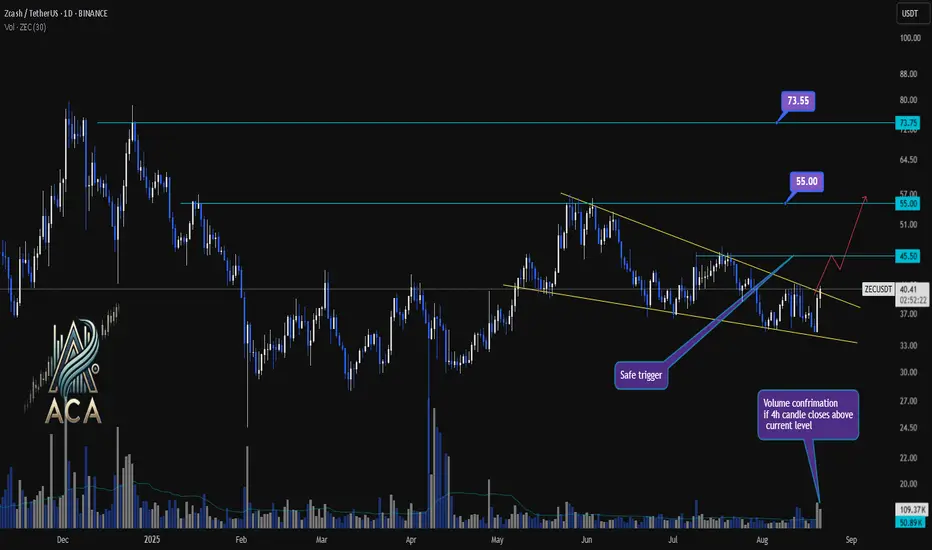
ZECUSDT Daily Chart Analysis | Symmetrical Triangle BO WatchZECUSDT Daily Chart Analysis | Symmetrical Triangle Breakout Watch
🔍 Let’s dissect the ZEC/USDT daily chart, where price action is nearing a pivotal breakout from a symmetrical triangle—often a precursor to major moves when combined with rising volume.
⏳ Daily Chart Overview
Zcash has been consolidating over recent weeks, forming a clear symmetrical triangle pattern bounded by converging trendlines. This pattern, characterized by lower highs and higher lows, signals that volatility is being compressed and a decisive breakout may be imminent.
🔺 Long Setup:
A daily close above the $45.50 resistance, especially with strong volume, will act as a “safe trigger” and confirm breakout validity. If bulls take charge here, the next upside objectives are $55.00 followed by $73.55. Watch for volume confirmation, ideally on a 4H candle close above resistance, to further add confidence to the breakout.
📊 Key Highlights:
- Symmetrical triangle pattern shows growing pressure for a directional move.
- Recent price tested triangle resistance; a close above $45.50 is the bullish trigger.
- Upside targets post-breakout are $55.00 and $73.55, provided volume supports the move.
- Volume spike serves as crucial confirmation—don’t chase without it.
🚨 Conclusion:
ZEC is coiling within a symmetrical triangle, setting the stage for potential breakout action. Bulls are watching $45.50 for a clean breakout trigger, eyeing $55 and $73.55 as next targets. Always wait for strong volume and confirmed closes before acting—symmetrical triangles can break both ways if conviction is lacking.
VEDL - Is the Stock Ready for 2 YR Breakout?VEDL - Symmetrical triangle Observed on VEDL at 2 YR high zone.
1. RSI > 50 In Daily
2. RS daily Improving
Consider entering once Breakout of Symmetrical triangle.

BTC: STILL HOLDING SUPPORT! HOPE FOR A BOUNCE!!Hello everyone, if you like the idea, do not forget to support with a like and follow.
Welcome to this BTC update. As we told you in our previous update that it might be a fake-out and told you to put SL in all your long positions. Hope you listened and save your money.
Now, BTC again came back inside the triangle. The good thing is that it's still holding the support level so far and as long as it's holding the support we can expect a bounce and if BTC again breaks the triangle then this time surely it would be a clear breakout.
You can open a long position of BTC here with the SL of $28,400
Let's see how things go.
If you like this idea then do support it with like and follow.
Also, share your views in the comment section.
Thank You!

GOLD Symmetrical Triangle At Play?Hi Traders,
Hope you are all doing well.
As we know, last week was a very intense week for the world and we still have crazy volatility this week.
I choose not to trade during times like this, although market volatility is what we need as traders to make money.
However, I would rather be more certain on a position when I see a setup, rather than be unsure because of geopolitical events.
Having said this, let’s have a quick squiz at GOLD.
We were waiting for that daily resistance to be flipped at support.
Sure enough, it happened. Fundamentals dropped the price down to flip that daily resistance as support.
I saw no reason to go long once we retested that support on the daily; it’s just a giant wick.
On the 1-Hour, we have a symmetrical triangle forming and I see a possible break to the upside on the near horizon. If this pattern breaks to the upside, I will then begin to start looking for possible long positions again.
The MACD is showing us bulls are returning and sellers are weakening. However, this is not enough confluence for me to jump in. World events can move prices around like a hurricane and I would rather wait to see a little more stability
before I start to get involved.
But, we can always learn and continue to learn we shall!
Keep safe and I will see you all on the next one.
Vortex

Trx analysisHere's a quick look at TRX 1D chart . As we can see, the price has been showing a trend line support and moving in the symmetrical triangle .We can see a breakout done nicely .Wait for retest and buy it surely.
Definitely one to keep an eye on .
The best entry at 0.1058$ and below support level .
Targets
1 0.116$
2 0.12134$
3 0.13215$
4 0.14205$
IF YOU LIKE THIS SHOW SOME LIKE AND FOLLOW THAT WILL ENCOURAGE ME
THANK YOU

Crypto Alert - Moonriver USDT⚠️Hello ladies and gentleman, I have discovered a new trading opportunity. As you can see, Moonriver is forming a symmetrical triangle. It broke out to the upside, but now it's retesting the resistance level of the triangle. If BTC isn't gonna be the annoying currency like we know it sometimes, then there's a good chance that Moonriver can increase 86%.
First target will be around $584.1400 - 46%
Second target will be around $757.4925 - 86%
If you think my analysis is valuable or you discovered something new, give it a like. 👍
See ya✌️

Bitcoin symmetrical triangle break will decide market futureBitcoin forming a symmetrical triangle / bull flag. Very important to see which way this triangle breaks. Especially since it will line up with the horizontal support and resistance zones that we laid out.


AUDNZD possible scenarios 🦐AUDNZD is on a bullish trend and market on the daily chart in a consolidation move at the top of the trend near a weekly resistance.
The market on the 4h chart is creating a symmetrical triangle that could make us at a continuation of the trend.
IF the market will break above the weekly structure we can set a nice long order according with Plancton's strategy.
On the other scenario IF the market will break below the 4h support structure we can look for a short order till the daily structure below.
–––––
Follow the Shrimp 🦐
Here is the Plancton0618 technical analysis, please comment below if you have any question.
The ENTRY in the market will be taken only if the condition of Plancton0618 strategy will trigger.

SNGLS/BTC | LONG
SNGLSBTC just broke out of a symmetric triangle.
Stochastic RSI bottomed out and reversed indicating exhaustion in the bears.
Daily MA shows a golden cross indicating bullishness ahead.
Please leave a like and follow if you like my charts. Thank you!

DASHUSDT | Impending Breakout | Apex | Symmetrical Triangle Todays Analysis – DASHUSDT – Consolidating in a symmetrical triangle, nearing its apex where a breakout is probable.
Points to consider:
Multi-confluence resistance cluster
Support and resistance converging (Apex)
Declining volume
RSI showing weakness
DASHUSDT has been in a multi-week no trend scenario, trading within a contracting range where resistance is being held by the 200 EMA and .5 Fibonacci retracement.
Volume has also been on a steady decline, indication of an influx being imminent, possibly coinciding with the breakout.
RSI is also below 50 showing weakness in the market.
Overall, in my opinion, a break in either direction is impending. The break needs to be backed with increasing volume to solidify legitimacy and avoid any fake outs.

Aeternity Bull Flag / Symmetrical Triangle on Daily ChartRSI not overbought or oversold
Looking for breakout.
