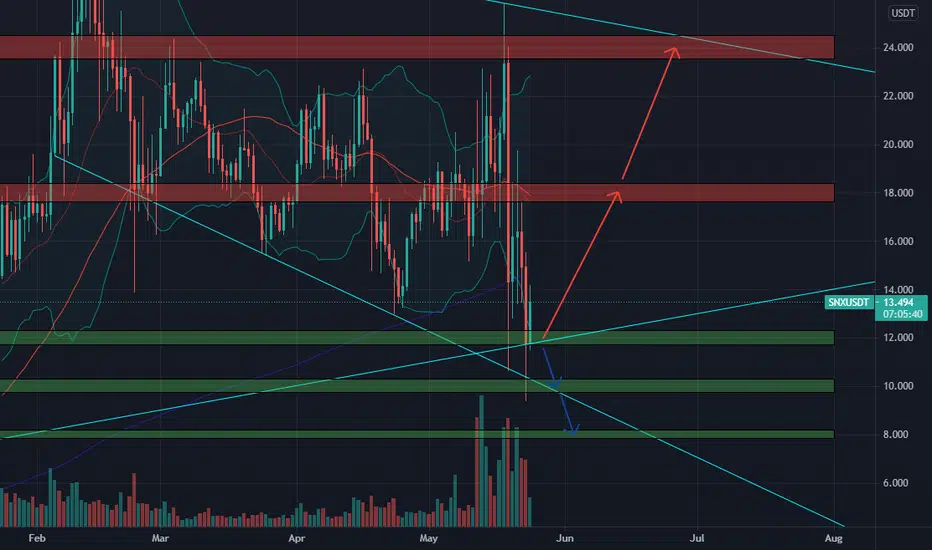
SNXUSDT - Breaking outHello everyone!
SNX on the watch as it's trying to break the downtrend channel
Synthetix

🆓Synthetix (SNX) May-24 #SNX $SNXSNX is recovering from the 12$ zone, and is heading to 18$ and 24$ zone in June. But if it loses this 12$ zone again, it will have a big fall to 10$ or 8$ in early June
📈BUY
-Buy: 11.7-12.3$. SL if B
📉SELL
-Sell: 17.6-18.4$. SL if A
-Sell: 23.5-24.5$. SL if A
♻️BACK-UP
-Sell: 11.7-12.3$ if B. SL if A
-Buy: 9.7-10.3$ if A. SL if B
-Buy: 7.8-8.2$ if A. SL if B
❓Details
🕯Timeframe : 1 Day
📈Red Arrow : Main Direction as BUY and SELL section
📉Blue Arrow : Back-Up Direction as BACK-UP section
🟩Green zone : Support zone as BUY section
🟥Red zone : Resistance zone as SELL section
🅰️A : The Close price of candlestick is Above the zone
🅱️B : The Close price of candlestick is Below the zone


BullishAscending triangle, continuation pattern setting up.
Confirmation at a sustained break of $4.90
Looking for another leg up.

$SNXUSDT - Elliott wave analysisHello everyone!
It seems that Synthetix found a strong lasting support at $13, which should act as a booster of the SNX.
Synthetix according to the EW has completed the 4th wave, as usually 4th wave is 0.618 of the 3rd wave.
Although I highly recommend you to go long upon the breakout of the dynamic resistance.
Expect volatility today, remember the BTC futures settlement.

SYNTHETICS WILL BLAST a huge triangle formation in the snx/btc chart , breaking upside is more likely ,leading to a huge breakout , with a 3x from its current price

Synthetix (SNX) Resting Under TrendlineSNX is resting under its trendline (log view). Full disclosure, I entered a small position in SNX based on this. Not financial advice.

SYNTHETIX $SNX 60 MIN CHART. W FORMATION/DOUBLE BOTTOM $32 TGTLOOKS GOOD, WHAT DO YOU THINK.. WILLING TO TAKE A PUNT?

$SNX/USDT 1h (Binance Fut.) Symmetrical triangle break & retestSynthetix Network looks ready for bullish continuation after that last pull-back!
Current Price= 21.346
Buy Entry = 20.949 - 20.949
Take Profit= 22.077 | 23.081 | 24.146
Stop Loss= 19.873
Risk/Reward= 1:1.5 | 1:2.63 | 1:3.84
Expected Profit= +25.44% | +44.80% | +65.32%
Possible Loss= -17.00%
Fib. Retracement= 0.786 | 1.272 | 1.764
Margin Leverage= 4x
Estimated Gain-time= 1 week

SNX to the MOON !Stop loss under the support.
Please like the idea for Support & Subscribe for More ideas like this and share your ideas and charts in Comments Section..!!
Thanks for Your Love & Support..!!

SNX to go for a solid run to $37-$38 levels during AltseasonWith a cup and handle formation and a triangle breakout on SNX we could see a run to $38 this altseason based on the fib retracement.

SNX (Y21.P2.E1).Stalking a breakout tradeHi Traders,
Hopefully you see this in time.
Gartley Harmonics
Cheers,
S.Sari

New Altcoin I went long on at breakout $SNX Synthetix Added another cryptocurrency to my long-term portfolio.
SNX is a cryptocurrency that powers the Synthetix protocol. Synthetix protocol enables trading synthetic assets on Ethereum. Synths are tokens that provide exposure to assets such as gold, Bitcoin, U.S. Dollars, TESLA, and AAPL within the Ethereum blockchain.
RSI and MACD are showing signs that bulls are back in control.
Today we are breaking out of this bull flag.
stop-loss - $16.
Short term price target - New All-time high

SNX/USDT BreakoutSynthetix (SNX) - Daily Log Chart
A Protocol For Trading Synthetic Assets On Ethereum.
Synthetix is an Ethereum-based protocol for issuing and trading synthetic assets, including cryptocurrencies, leveraged tokens, equities, and other real-world assets.
We are not registered or licensed in any jurisdiction whatsoever to provide investing advice or anything of an advisory or consultancy nature.
and are therefore are unqualified to give investment recommendations.
Always do your own research and consult with a licensed investment professional before investing.
This communication is never to be used as the basis of making investment decisions, and it is for entertainment purposes only.

Bet on Synthetix against BTCTrying to outperform the main Crypto during the bull run is very risky. Unless it is with another Cryptocurrency with solid fundamentals near huge demand zone.

SNX (Synthetix) Token Analysis 24/03/2021 Updatedas we can see the price has fallen to the trend line and has some good chances of getting bounced from the Retracement and support zones
targets are the same as the past analysis

Synthetix Network Token (SNX) - March 24Hello?
Dear traders, nice to meet you.
By "following" you can always get new information quickly.
Please also click "Like".
Have a good day.
-------------------------------------------------- -----
We have to see if we can get support and climb at 16.809.
As such, we need to see if there is any movement to move sideways at 16.809 or break off the downtrend line.
If you go down at 16.809, you can touch 13.222, so you need a Stop Loss to preserve profit or loss.
In order to turn to the uptrend line, it must rise to the 20.397-21.592 section and receive support.
As the OBV on the volume indicator increases green, it remains to be seen if the center line can rise.
It remains to be seen if the CCI line can rise above 100 on the CCI-RC indicator.
---------------------------------------
(SNXBTC 1D chart)
We need to see if it can rise along the uptrend line (1).
In particular, it remains to be seen if the volatility around March 26 could increase more than 3280 Satoshi.
In order to turn to an uptrend, you must get off the downtrend line.
-------------------------------------------------- -------------------------------------------
** All indicators are lagging indicators.
So, it's important to be aware that the indicator moves accordingly with the movement of price and volume.
Just for the sake of convenience, we are talking upside down for interpretation of the indicators.
** The wRSI_SR indicator is an indicator created by adding settings and options from the existing Stochastic RSI indicator.
Therefore, the interpretation is the same as the conventional stochastic RSI indicator. (K, D line -> R, S line)
** The OBV indicator was re-created by applying a formula to the DepthHouse Trading indicator, an indicator that oh92 disclosed. (Thank you for this.)
** Check support, resistance, and abbreviation points.
** Support or resistance is based on the closing price of the 1D chart.
** All explanations are for reference only and do not guarantee profit or loss on investment.
Explanation of abbreviations displayed on the chart
R: A point or section of resistance that requires a response to preserve profits
S-L: Stop Loss point or section
S: A point or segment that can be bought for profit generation as a support point or segment
(Short-term Stop Loss can be said to be a point where profits and losses can be preserved or additionally entered through installment transactions. It is a short-term investment perspective.)
GAP refers to the difference in prices that occurred when the stock market, CME, and BAKKT exchanges were closed because they do not trade 24 hours a day.
G1: Closing price when closed
G2: Cigar at the time of opening
(Example) Gap (G1-G2)

Synthetix Network Token (SNX) - March 18Hello?
Dear traders, nice to meet you.
By "following" you can always get new information quickly.
Please also click "Like".
Have a good day.
-------------------------------------------------- -----
You should watch for any movement that deviates from the 16.809-20.397 section.
It remains to be seen if the volatility around March 23rd (March 22-24) increases above 20.397 points and breaks the downtrend line.
If you go down at 16.809, you can touch 13.222, so you need a Stop Loss to preserve profit or loss.
In order to turn to an uptrend, it needs to be supported in the 20.397-21.592 range.
-----------------------------------------
(SNXBTC 1D chart)
You should see if you can climb along the uptrend line (1) and climb above the 0.0003403 point.
In particular, it remains to be seen if it can deviate from the downtrend lines (3) and (4).
-------------------------------------------------- -------------------------------------------
** All indicators are lagging indicators.
So, it's important to know that the indicator moves accordingly with the movement of price and volume.
Just for the sake of convenience, we are talking upside down for interpretation of the indicators.
** The wRSI_SR indicator is an indicator created by adding settings and options from the existing Stochastic RSI indicator.
Therefore, the interpretation is the same as the conventional stochastic RSI indicator. (K, D line -> R, S line)
** The OBV indicator was re-created by applying a formula to the DepthHouse Trading indicator, an indicator that oh92 disclosed. (Thank you for this.)
** Check support, resistance, and abbreviation points.
** Support or resistance is based on the closing price of the 1D chart.
** All explanations are for reference only and do not guarantee profit or loss on investment.
Explanation of abbreviations displayed on the chart
R: A point or section of resistance that requires a response to preserve profits
S-L: Stop Loss point or section
S: A point or segment that can be bought for profit generation as a support point or segment
(Short-term Stop Loss can be said to be a point where profits and losses can be preserved or additionally entered through installment transactions. It is a short-term investment perspective.)
GAP refers to the difference in prices that occurred when the stock market, CME, and BAKKT exchanges were closed because they do not trade 24 hours a day.
G1: Closing price when closed
G2: Cigar at the time of opening
(Example) Gap (G1-G2)

DeFi Perp vs BTCWe are on support for DeFi perpetual futures vs Bitcoin. We could either see Bitcoin enter a further sideways consolidation/correction, or DeFi is going to appreciate even faster than BTC vs. the $. Either way, it is time to accumulate your favourite DeFi projects.
1. Enter your favourite DeFi projects along this support zone
2. As long as BTC is stable, and with the current negative sentiment, I foresee DeFi outperforming BTC in the near future. Buy and HODL for much higher prices. Target is the moon.
3. Invalidation below the orderblock (blue zone)

SNX UpdateHello Traders,
In reviewing my Analysis of SNX, I realized that there in a confluence of the MM Series Long and the ATWHWB long. In my trading style, I always prefer to use the ATWHWB given that price triggers the entries.
I'll link the previous chart so hopefully some of you will see the difference.
Happy Trading, always manage risk.
Quality in trading is the ability to react to one's own psyche

SNX still holding strongJust updating from previous SNX post
The low was broken but the setup remains valid. The Correction Channel also looks good.
Check chart for key levels.
Happy trading, always manage risk.
Quality in trading is the ability to react to one's own psyche

Oh man, SNX looks READY. TO. PUMP.Hello Traders!
SNX looks so ready to pop with how price action has been forming! If this Micro Long ends up holding, this thing could turn into a beast of a move, but I'll always let price do the talking.
Of course, we always need to be aware of the Opposing setups that could send us lower. If the Micro Long reaches target, that Short will obviously be taken out.
Happy Trading, always manage risk.
Quality in trading is the ability to react to one's own psyche
