XRPUSD: Bullish Setup AheadAs I prepare to share my bullish trade idea for XRPUSD on TradingView, several key global fundamentals align with my positive outlook. Here are a few significant factors to consider:
1. Regulatory Clarity: Recent developments in cryptocurrency regulation, particularly favorable rulings for Ripple Labs, have boosted market confidence. This clarity is essential for institutional investment and long-term growth in the crypto space.
2. Market Sentiment: The overall sentiment in the cryptocurrency market has shifted positively, with many traders anticipating a bullish trend. Indicators such as the MACD and Stochastic Oscillator suggest potential upward momentum, reflecting a growing interest in XRP as a viable investment option.
3. Technical Analysis: Current technical indicators show that XRP is poised for significant moves. The Relative Strength Index (RSI) is in a neutral to slightly bullish zone, indicating room for further upside before reaching overbought conditions.
In my trading strategy, I will utilize probabilities to position myself for long trades in XRPUSD.
Share Your Thoughts in the Comments Below!
12M:
2W:
4H:
Systematictrading

AUDCAD: Leveraging Probabilities for Strategic Long PositionsKey Fundamentals Supporting Bullish Bias:
- Recent strength in commodity prices, particularly iron ore, benefiting Australia's export-driven economy
- Expectations of a less hawkish stance from the Reserve Bank of Australia, potentially supporting economic growth
- Relative weakness in the Canadian dollar due to concerns over the housing market and oil price volatility
By utilizing probabilities in chart analysis, I can identify optimal entry points for AUDCAD longs while managing risk effectively. This approach allows for a more systematic trading strategy, aligning with the current bullish bias in the AUDCAD pair.
12M:
2W:
HOURLY TF:

61.69% Probability for Bullish USOIL TP!Key Fundamentals Supporting a Bullish Outlook:
- OPEC+ Production Cuts: OPEC+ has implemented production cuts to stabilize oil prices, which can lead to a tighter supply and potentially higher prices for crude oil.
- Geopolitical Tensions: Ongoing geopolitical issues, particularly in oil-producing regions, can disrupt supply chains, leading to increased prices as markets react to potential shortages.
- Economic Recovery Signals: As global economies continue to recover from the pandemic, demand for oil is expected to rise, further supporting bullish sentiment in the market.
By combining a bullish bias with a probabilistic approach to trading, I aim to position myself advantageously in the market while managing risks effectively.
Feel free to share your thoughts in the comments below!
2W:
2H:

NVIDIA (NVDA) - Bullish Momentum Fueled by AI RevolutionKey Fundamentals Supporting Bullish Bias:
1. Surging demand for AI chips driving record-breaking revenue growth
2. Launch of next-gen Blackwell architecture expected to outperform current offerings
3. Expanding market share in data center and cloud computing sectors
4. Strong cash flow and $50 billion share buyback program announced
Utilizing Probabilities for Long Positions:
As a trader, I'm leveraging probabilistic analysis to optimize my long entries on NVIDIA.
By combining fundamental analysis with probabilistic technical analysis, I aim to capitalize on NVIDIA's bullish potential while managing risk effectively.
12M:
2W:
1H:
What's your take on using probabilities in trading? Share your thoughts and experiences in the comments below! Let's discuss how this approach can enhance our trading strategies.
Have a perfect trading week! 🚀

Bearish on TONUSD: 58% to 97% Probability of Hitting TP1!Toncoin (TON) is currently facing several bearish pressures in the market:
Key Fundamentals
- Declining trading volume indicates waning investor interest
- Price action below key EMA levels (20-day, 50-day, and 100-day) reinforces bearish sentiment
- Recent completion of a Death Cross on the daily timeframe, the first since May 2023, suggests potential for further downside
- Broader cryptocurrency market uncertainty and regulatory concerns are affecting altcoins like TON
I'm employing probability-based analysis on my charts to strategically enter short positions on TONUSD.
3D:
Hourly timeframes:
Please feel free to share your ideas and thoughts!

AUDUSD: Bearish Breakout Ahead! 55.06% Chance to Hit My Target!The Australian Dollar faces several headwinds that support a bearish bias against the US Dollar:
1. China's economic slowdown is hurting demand for Australian exports.
2. The RBA has paused rate hikes while the Fed maintains a hawkish stance, potentially widening the interest rate gap.
3. Global economic uncertainties favor the safe-haven USD over the risk-sensitive AUD.
I'm using probability analysis on my charts to find good short entry points for AUD/USD.
6M:
2W:
1H:
Feel free to comment below with your thoughts or questions!

Unlocking Profits: Utilizing Probabilities for CADJPY LongsThe Canadian Dollar to Japanese Yen (CADJPY) pair is showing promising bullish potential, supported by several key fundamental factors:
Global Economic Recovery: As the world continues to rebound from recent economic challenges, risk appetite is increasing. This trend typically favors the Canadian Dollar over the safe-haven Japanese Yen.
Commodity Prices: With Canada being a major exporter of commodities, the recent surge in oil prices is likely to bolster the Canadian economy and, by extension, its currency.
Bank of Canada's Stance: The Bank of Canada's relatively hawkish monetary policy compared to the Bank of Japan's ultra-loose policy is creating a favorable interest rate differential for the Canadian Dollar.
Utilizing Probabilities for Long Positions
In this trade idea, I'm employing a probabilistic approach to enter long positions on CADJPY. By combining fundamental analysis with a probabilistic approach to chart reading, I aim to capitalize on the potential upside in CADJPY while maintaining a disciplined and systematic trading strategy.
12M:
2W:
1H:

AUDJPY Short Setup: Leveraging Probabilities for Better TradesKey Fundamentals
China's Economic Slowdown: Australia relies heavily on trade with China. If China’s economy weakens, it can hurt Australia’s economy and the Australian Dollar.
Safe-Haven Demand: In uncertain times, investors often turn to safe-haven currencies like the Japanese Yen, which could lead to a drop in AUD/JPY.
Different Central Bank Policies: The Bank of Japan is keeping interest rates low, while the Reserve Bank of Australia may consider rate hikes. This difference can strengthen the Yen against the Australian Dollar.
Using Probabilities for Short Trades
By combining these fundamentals with a probability-based strategy, I aim to effectively trade AUD/JPY.
12M:
2W:
2H:
On this timeframe I can get positioned into shorts based on probabilities.

Why TSLA Could Be Set to Rise: Key News and a Great Entry SetupTesla (TSLA) is in the spotlight right now, and several factors suggest a potential bullish trend in the stock next week:
Strong Delivery Numbers: Tesla recently reported its Q2 2024 delivery figures, which exceeded many analysts' expectations. While the numbers were lower than last year's, they still indicate solid performance in a competitive EV market, with other automakers also experiencing growth.
Upcoming Earnings Report: Tesla is scheduled to announce its Q2 2024 earnings on Tuesday. Analysts are forecasting revenue slightly above last year’s figures, with net income expected around $1.72 billion. Investors will be particularly interested in updates about Tesla's robotaxi plans, which have been postponed to October. This anticipation could drive excitement and boost the stock price.
Market Recovery: Recently, TSLA experienced a drop of about 12.4% due to a global market sell-off. However, the stock has started to recover, and this volatility may present a buying opportunity, especially if the market stabilizes.
High Probability Setup: According to technical analysis, there is a high probability setup that has already formed, indicating a favorable entry point for bullish trades. This technical signal, combined with the positive news and upcoming events, enhances the likelihood of a price increase.
With these factors in play, including strong delivery numbers, an important earnings report, and a favorable technical setup, TSLA could see a bullish trend in the coming week. As always, be sure to conduct your own analysis and manage your risks before entering any trades.
6M:
3M:
1M:
2W:
1W:
3D:
2H: Entry

58.55% Probability of USOIL Bullish Continuation This Week!Based on a mechanical top-down structural analysis from higher to lower timeframes, there's a strong probability (58.55%) of a bullish continuation in USOIL this week.
This analysis, combined with hourly timeframe probabilities , suggests a favorable outlook for price movement.
Follow me with the detailed top-down analyses linked below to see the key factors contributing to this bullish projection on FX:USOIL
12M:
6M:
3M:
1M:
2W:
1H:
2H - Entry:
Take a look at these analyses to see the details behind this trade idea.
If you have any questions or want to discuss further, feel free to ask.
Let's make this a great trading week!

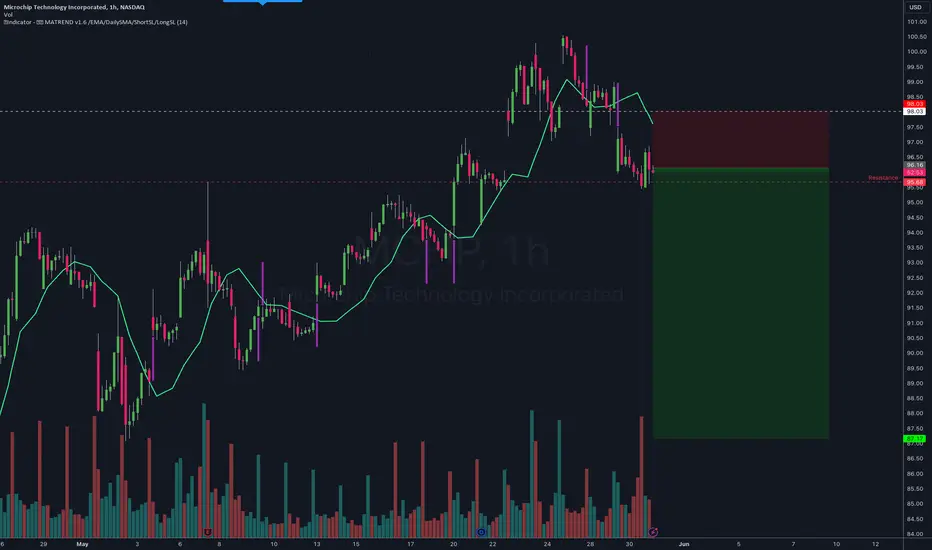
MCHP - May 24 (MATREND v1.6)Entered Short MCHP based on the 29 May signal. This is a good exploration probe because if price breaks the resistance we should see some good downward movement.
Regime Indicator: Bearish
v1.6
Exit rule tweaked to Daily 10SMA
Calibrated entry specs, to slightly loosen up the Stoploss
atr_x = 2.5
entry_atr_xfactor = 3.7
-----
This is a simple systematic Trend strategy where entry is based on two conditions
1. Price crossing over the EMA
2. The present ATR is less than an ATR multiple
The ATR condition allows us to enter trades that has not gapped too much as that usually results in a price pullback
Risk
Fixed & tight SL based on ATR multiples closes trades fast
Closing of the trades is a simple price cross over the daily SMA
This strategy only has a 34.38% win rate. So most trades will end up as losers until we hit a strong upswing.
TER - - May 24 (MATREND v1.6)Larger bullish movement. There was a pull back and the signal seems to be aligned for a potential bullish continuation
v1.6
Exit rule tweaked to Daily 10SMA
Calibrated entry specs, to slightly loosen up the Stoploss
atr_x = 2.5
entry_atr_xfactor = 3.7
-----
This is a simple systematic Trend strategy where entry is based on two conditions
1. Price crossing over the EMA
2. The present ATR is less than an ATR multiple
The ATR condition allows us to enter trades that has not gapped too much as that usually results in a price pullback
Risk
Fixed & tight SL based on ATR multiples closes trades fast
Closing of the trades is a simple price cross over the daily SMA
This strategy only has a 34.38% win rate. So most trades will end up as losers until we hit a strong upswing.

VECO - May 24 (MATREND v1.6)There seems to be a larger bullish movement
Price seems to have stalled here so there is a good chance this breakout can continue. SL position is good also.
v1.6
Exit rule tweaked to Daily 10SMA
Calibrated entry specs, to slightly loosen up the Stoploss
atr_x = 2.5
entry_atr_xfactor = 3.7
-----
This is a simple systematic Trend strategy where entry is based on two conditions
1. Price crossing over the EMA
2. The present ATR is less than an ATR multiple
The ATR condition allows us to enter trades that has not gapped too much as that usually results in a price pullback
Risk
Fixed & tight SL based on ATR multiples closes trades fast
Closing of the trades is a simple price cross over the daily SMA
This strategy only has a 34.38% win rate. So most trades will end up as losers until we hit a strong upswing.

ITRI - May 24 (MATREND v1.6)Similar to VECO
Bullish price movement seems to have stalled here so there is a good chance this breakout can continue. SL position is good also
v1.6
Exit rule tweaked to Daily 10SMA
Calibrated entry specs, to slightly loosen up the Stoploss
atr_x = 2.5
entry_atr_xfactor = 3.7
-----
This is a simple systematic Trend strategy where entry is based on two conditions
1. Price crossing over the EMA
2. The present ATR is less than an ATR multiple
The ATR condition allows us to enter trades that has not gapped too much as that usually results in a price pullback
Risk
Fixed & tight SL based on ATR multiples closes trades fast
Closing of the trades is a simple price cross over the daily SMA
This strategy only has a 34.38% win rate. So most trades will end up as losers until we hit a strong upswing.

TER - May 24 (MATREND v1.6)Price does not seem to be able to break upwards especially with the previous bullish signal. So a bearish signal should result in a downwards break. This is aligned to a previous successful bearish setup we saw with SRE
v1.6
Exit rule tweaked to Daily 10SMA
Calibrated entry specs, to slightly loosen up the Stoploss
atr_x = 2.5
entry_atr_xfactor = 3.7
-----
This is a simple systematic Trend strategy where entry is based on two conditions
1. Price crossing over the EMA
2. The present ATR is less than an ATR multiple
The ATR condition allows us to enter trades that has not gapped too much as that usually results in a price pullback
Risk
Fixed & tight SL based on ATR multiples closes trades fast
Closing of the trades is a simple price cross over the daily SMA
This strategy only has a 34.38% win rate. So most trades will end up as losers until we hit a strong upswing.

SteadyCompound #1 Newsletter: Week 23.10.23 - 29.10.23Welcome to SteadyCompound 1st Newsletter,
A few notes about my approach to nowadays trading
- I am a retired trader (2008-2018). I day-traded high frequency time-frame across Stock (2008), Bond Futures (2010), Forex / Gold (2012), Commodity e.g. Brent, Gas (2015) and Crypto (2017)
- I turned start-up cofounder (2020) and recently gained financial freedom (2023), which define my approach to now "trading as a hobby": refrain from over-trade and opt for high probability trade only with high R/R, clear indicators and peace of mind
- My goal is to steadily compound wealth and accumulate Bitcoin long-term
Trade Ideas for Week 23.10.23 - 29.10.23
1. Range has been stable for 6 months within 25K - 31K territory so we can exit our long at high 30k - low 31K
2. Taking Short Position at high 31K e.g 31600 is our SC "SteadyCompound" trade:
- short into the down trend / RSI oversold +75 / year-high 31K resistant / low volume spike for 2.7 R/R ratio, targeting above 27K
- hard-stop of 5% at right above 33K e.g 33113 (there is another resistant range at 31K - 33K formed during 2021-2022 which possibly allow us to scratch / take small loss on our short position)
#steadycompound #financialfreedom #tradingstrategy #systematic #bitcoin
p/s repost for Binance Exchange

Short SugarWe are short sugar at 20. TP at 18 and SL at 20.5. A 3.8 risk to reward ratio. This setup is 50% profitable.

AUDNZD ShortWe are short AUDNZD based on our monthly trading signal of 80% profitability. Take profit at 1.035.

Nasdaq Bullish ScenarioAfter a good discharge of points and stoplosses on Nasdaq Index, an automated algo of mine entered long at the open of the session on NQ futures recently, it will stay on trade for 2 days. Cause it is a mean reversion algorithm the risk reward is set to 1:1 as shown on the graph.

The Reasons We Follow An Algorithmic-Systematic Approach To All We have been trading and investing in markets for decades since the early 1980s. Experienced and successful traders and market participants tend to remember their losses and mistakes instead of victories. Profits feed the ego; losses are teachers for those who realize that valuable lessons come from adversity instead of triumph.
Everyone has an opinion- The only objective measure is the current price
The trend is your only friend- News, experts, and all other information are subjective
Trading and investing can be stressful
A plan and discipline are the building blocks for success
You have to be in to win- Drawdowns are a part of any trading or investing system
A batting average of .300 is good enough to get a professional baseball player into the Hall of Fame in Cooperstown, New York. Each time a future hall of Famer steps up to the plate, a success rate of below 30% is good enough for infamy. Trading and investing are similar. No one is correct in their market calls all of the time. When approaching any market, there are always three potential outcomes, a profit, a loss, or a breakeven. The success rate of calling a market correctly takes a back seat to other factors. We have seen market participants who have had the foresight to call the market correctly 75% of the time and still wind up losing money. Conversely, a seasoned trader can be right 20% of the time and still make an overall profit.
I usually write about specific markets on Trading View, but it is essential to look at the methodology, mindset, and path to growing capital over time this week. We follow an algorithmic-systematic approach to trading and investing. Our models come from decades of experience and the knowledge gained from mistakes that led to losses. We all have the same goal; to make money and grow our capital. The route to achieving the goal is what separates the winners from the losers.
Everyone has an opinion- The only objective measure is the current price
I am sure we have all heard an “expert” or pundit tell us that the current price of an asset is wrong. They may provide many compelling and convincing reasons, but they are 100% wrong when challenging a price level.
An asset price at any moment in time is always the correct price for one objective reason. It is the level where buyers and sellers meet in a transparent environment, the market. The “experts” and pundits take a subjective leap of faith when using the terms expensive or cheap. Too many variables establish a price. The only accurate measure of value is the current price itself.
The trend is your only friend- News, experts, and all other information are subjective
Prices are snapshots. Trends are the living and breathing extension of price action. Many market participants become junkies, watching each news event, “expert” forecast, and other exogenous events that could push asset prices higher or lower. They make investment or trading decisions based on what they hear and see. The approach is flawed for three significant reasons:
Trading off what one sees and hears is stale before it reaches our ears and eyes. Others have seen the news or forecast before us, and some had seen it before it appeared on a medium for all to see.
The translation of an event, forecast, or news item is purely subjective as it assumes, we will make a correct analysis. The expression “buy the rumor and sell the news” or the converse runs counter to even the most complete analytical decision-making approach.
Finally, reacting to any stimulus involves a primary human response, emotion. Emotions are a trader or investor’s worst enemy. They trigger responses and decisions based on fear and greed, a deadly duo that increases the chances of mistakes, miscalculations, and irrational behavior.
A market’s trend is purely objective as it reflects the path of least resistance of a price based on market consensus and sentiment. Prices tend to move to levels on the upside and downside that can defy logic, run counter to reason and are not rational. Trend following blocks out logic, reason, and rational thought and favors one of the leading theories of physics. Newton’s first law states that a body at rest will remain at rest unless an outside force acts on it, and a body in motion at a constant velocity will remain in motion in a straight line unless acted upon by an external force. Trend following embodies Newton’s first law of physics. Asset prices reflect the market’s sentiment, which is the inertia that drives those prices. If Sir Isaac Newton were a modern-day trader or investor, his mantra would be the trend is your only friend as it is compatible with his first law. The physical sciences are objective.
Trading and investing can be stressful
We have found that decision-making creates stress. When we buy or sell an asset based on anything but the market’s trend, we make a subjective judgment. The attempt to buy at the bottom or sell at the top is a value judgment that runs counter to logic as it implies the sentiment and current prices are incorrect, a fatal flaw. Sometimes some market participants get lucky, but that only reinforces a strategy that leads to future mistakes. Picking tops or bottoms in a market is a strategy that rewards the ego as it gratifies that one called the market correctly. However, ego and vanity lead us down a dangerous path. In the 1997 film, The Devil’s Advocate, Al Pacino, the actor who played Satan, said, “Vanity-definitely my favorite sin.”
Reducing stress comes from following the path of least resistance. We use an algorithmic, systematic approach to trading based on models that remain long during a bullish trend and short during a bearish one. We never miss a significant trend as we are constantly long or short the assets in our portfolio. We do not adjust our risk positions on an intra-day basis. We only reverse risk positions based on closing prices at the end of a session and execute the position at the start of the next session. Our proprietary models come from decades of trading and investing experience in a wide range of markets across all asset classes. We never look to sell tops or buy bottoms. We are long at the top and short at the bottom. However, we tend to capture significant trends, taking the filet mignon out of price trends. We have found that our mechanical approach, with a better than even-money win rate, reduces stress as it takes any decision-making out of the equation. The only job is to follow the rules, always remaining in the markets on the long or short side and reversing positions based on the model’s instructions.
A plan and discipline are the building blocks for success
Emotions lead to impulsive behavior. Acting on impulse leaves little or no time for planning and throws discipline out of the window. Albert Einstein said that the definition of insanity is doing the same thing repeatedly and expecting a different result. Impulsive decision-making is the root of Einstein’s insanity definition.
Any risk position in any market must have a plan, which is simply balancing the financial risk versus the potential reward. Before pressing the buy or sell button, we must establish risk parameters for trades or investments when not following an algorithmic approach.
The discipline is following the plan. Many market participants run into problems when a risk position goes against them, and they have no plan for risk and reward, or they modify it to allow them to stick with a wrong decision. Turning a short-term trade into a long-term investment is a common mistake. The mistake comes from a subjective call that the market price is incorrect.
A way to prevent this is to remind yourself that the market price is always the correct price. We are often wrong; the market is never wrong.
You have to be in to win- Drawdowns are a part of any trading or investing system
We are constantly long or short the highly liquid assets in our investment portfolio because we never know when a significant trend will begin. Being in a risk position that follows trends is the only way to catch the bulk of a bullish or bearish trend.
Drawdowns or losses are a part of life and any trading or investment approach. A choppy market near the high or low end of a trend will result in short-term losses. However, that is the price for capturing the long-term trend. There is no free lunch in life, and the same goes for trading and investing. The goal is always the same for every market participant, to make money over time and build wealth and our nest eggs. The strategy is what separates winners from losers. We take a long-term systematic approach and do not veer from the path. We know that drawdowns are a part of any investment or trading approach. We are in it to win it on a long-term basis.
Join us for the Monday Night Call each week - all you have to do is use the link below. There's also a link to sign up for early access to these articles as well.
Trading advice given in this communication, if any, is based on information taken from trades and statistical services and other sources that we believe are reliable. The author does not guarantee that such information is accurate or complete and it should not be relied upon as such. Trading advice reflects the author’s good faith judgment at a specific time and is subject to change without notice. There is no guarantee that the advice the author provides will result in profitable trades. There is risk of loss in all futures and options trading. Any investment involves substantial risks, including, but not limited to, pricing volatility, inadequate liquidity, and the potential complete loss of principal. This article does not in any way constitute an offer or solicitation of an offer to buy or sell any investment, security, or commodity discussed herein, or any security in any jurisdiction in which such an offer would be unlawful under the securities laws of such jurisdiction.

Morning Daily Candlestick Analyses for H1BO: December 8, 2020.Let's look at some opportunities today.


Review of yesterdays trading on H1BO. December 3, 2020Review of yesterdays trading for the H1BO system. -1R at the close of play.
