XAU/USD BULLISH ANALYSIS – PROFESSIONAL TRADE MANAGEMENTThis trade was not luck — it was structure, liquidity, and patience.
🧠 MARKET CONTEXT
Price was coming from a distribution phase, where the market:
• Took buy-side liquidity
• Trapped late buyers
• Prepared the real move
Then we had:
✅ Sell-side liquidity sweep
✅ CHOCH (Change of Character)
✅ BOS (Break of Structure)
This confirmed a clear shift to a bullish bias.
🎯 ENTRY
📍 Buy POI (15M): 4,328
After:
• Fakeout
• Liquidity sweep
• Structural confirmation
🎯 Risk / Reward: 1:3
🟢 TRADE MANAGEMENT
✔️ TP1 mitigated: 4,390
✔️ TP2 mitigated: 4,458
🔒 Stop moved to BE at 4,345
➡️ Capital protected, risk-free trade.
⏳ CURRENT SCENARIO
📌 Price is consolidating above TP2, showing bullish strength.
🎯 Waiting for TP3: 4,521
Area of buy-side liquidity / previous HH.
As long as structure holds:
➡️ Bullish bias remains intact.
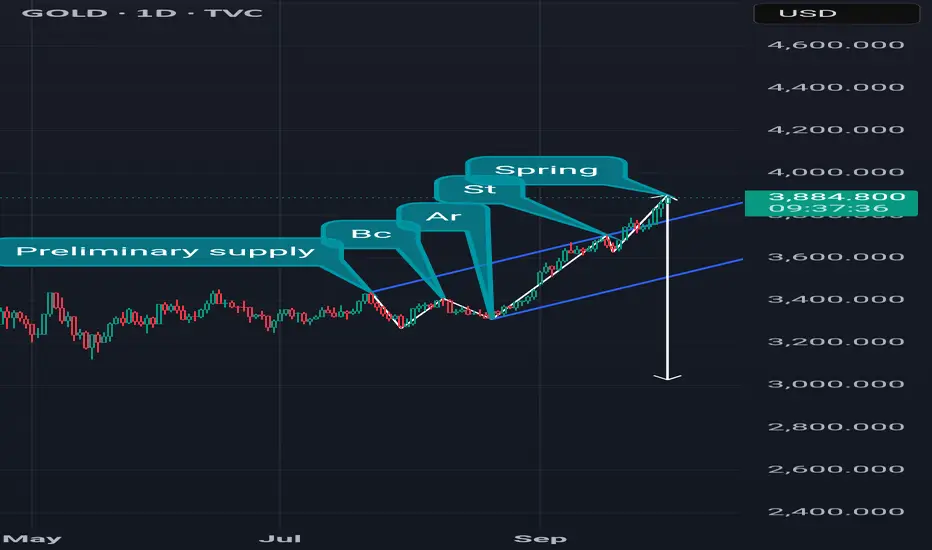
T-distribution

XAUUSD – Gold, 4HThis chart shows Gold (XAUUSD) on the 4-hour timeframe after a strong bullish rally that transitioned into a potential distribution phase. Price previously respected an ascending structure, forming higher lows and breaking upward with strong momentum. However, after reaching the upper resistance zone near the recent highs, bullish strength appears to be weakening.
The marked “distribution type” area suggests smart money selling into strength, where buyers become exhausted near resistance. The sharp push up is followed by choppy price action, indicating uncertainty and possible topping behavior.
The projected black path illustrates a bearish corrective scenario, where price may first retrace to the 1st target (previous structure support), then continue lower toward the 2nd target, aligning with a major demand/support zone around 4,017. This area previously acted as strong support and could attract buyers again.
Overall, the chart highlights a shift from uptrend to potential reversal, favoring sell-the-rallies or corrective moves unless price reclaims and holds above the key resistance levels. Traders should watch for confirmation such as lower highs, rejection wicks, or volume weakness before continuation lower.
Follow for more.
Trade base on your own understanding.
this is not a financial advice.

SOLUSD - December Distribution Structure
Executive Summary
COINBASE:SOLUSD has declined approximately 52 percent from its November 2024 all-time high of 264 USD to current levels around 126 USD. This analysis examines the technical structure, on-chain metrics, and fundamental catalysts to determine high-probability trade zones. The evidence suggests further downside toward the 100-115 USD accumulation zone before a sustainable recovery can begin.
Technical Structure Analysis
Price Action Overview
Solana is currently trading within a descending channel that formed after the November 2024 peak. The structure shows:
Lower highs at 264, 220, 180, and 145 USD forming clear descending resistance
Lower lows indicating sustained selling pressure
Current price testing the 125-130 USD zone which previously acted as resistance in October 2024
Volume declining on bounces and increasing on selloffs - classic distribution signature
Key Support and Resistance Levels
Resistance Zones:
140-145 USD - Recent swing high rejection zone
160-165 USD - Previous support turned resistance
180-185 USD - Major structural resistance
Support Zones:
115-120 USD - Minor support, likely to break
100-105 USD - Major support, November 2024 breakout origin
85-90 USD - Secondary support if macro deteriorates
Moving Average Analysis
Price is trading below the 20, 50, and 200 period moving averages on the daily timeframe
The 20 MA has crossed below the 50 MA, confirming short-term bearish momentum
The 200 MA is flattening and beginning to slope downward
Moving averages are fanning out in bearish alignment
RSI and Momentum
Daily RSI is currently in the 35-40 range, approaching oversold but not yet at extreme levels
RSI has been making lower highs alongside price, confirming the downtrend
No bullish divergence present yet - divergence at the 100-115 zone would be a strong buy signal
Weekly RSI has room to decline further before reaching oversold extremes seen at previous bottoms
Volume Profile
High volume node exists at the 100-115 USD zone from the November 2024 accumulation period
Current price zone shows relatively low volume, suggesting lack of strong buyer interest
Volume has been declining during recent bounce attempts - weak demand
A volume spike at the 100-115 zone would confirm institutional accumulation
Fibonacci Retracement
Measuring from the September 2024 low of 120 USD to the November 2024 high of 264 USD:
0.382 retracement: 209 USD - Already broken
0.5 retracement: 192 USD - Already broken
0.618 retracement: 175 USD - Already broken
0.786 retracement: 151 USD - Already broken
Full retracement: 120 USD - Currently testing
The breakdown through the 0.786 level suggests the move is corrective in nature and a full retracement to the 100-120 USD origin zone is probable.
On-Chain and Fundamental Analysis
Network Activity Metrics
Solana network statistics show mixed signals:
Daily active addresses have declined from peak levels during the meme coin mania
Transaction counts remain elevated compared to other Layer 1 networks
Total Value Locked in Solana DeFi protocols has decreased from highs
NFT trading volume on Solana marketplaces has cooled significantly
Supply Distribution
Large holder concentration remains high with significant whale wallet activity
Exchange inflows have increased in recent weeks, indicating selling pressure
Staking participation remains strong, reducing liquid supply
FTX bankruptcy estate continues systematic liquidation of SOL holdings
Macro Factors Affecting Solana
Bearish Catalysts:
Federal Reserve December 2025 meeting maintained hawkish stance with fewer rate cuts projected for 2026
Risk-off sentiment affecting high-beta assets disproportionately
BITSTAMP:BTCUSD dominance rising, indicating capital rotation from altcoins to Bitcoin
Regulatory uncertainty regarding Solana ETF approval timeline
FTX estate selling pressure creating persistent supply overhang
Meme coin speculation that drove the 2024 rally has cooled substantially
Bullish Catalysts:
Solana network upgrades improving transaction throughput and reliability
Growing institutional interest in Solana ecosystem projects
Potential Solana ETF approval could drive significant inflows
Strong developer activity and ecosystem growth metrics
Firedancer client development progressing, promising improved network performance
Solana remains the preferred chain for new DeFi and consumer applications
Competitive Positioning
Solana maintains advantages over competing Layer 1 networks:
Transaction costs remain significantly lower than BITSTAMP:ETHUSD mainnet
Transaction speed and finality superior to most competitors
Developer ecosystem continues expanding despite price decline
Institutional partnerships and integrations increasing
However, challenges persist:
Network outages and congestion issues have damaged reputation
Centralization concerns regarding validator distribution
Competition from Ethereum Layer 2 solutions intensifying
Regulatory classification uncertainty in United States
Whale and Institutional Activity
Recent on-chain data indicates:
Large wallets have been net sellers over the past 30 days
Exchange deposits from whale addresses have increased
Institutional funds have reduced Solana allocation according to fund flow data
However, accumulation signals are appearing at lower price levels
The pattern suggests distribution at current levels with potential accumulation beginning at the 100-115 USD zone.
Trade Framework
Primary Scenario - Bearish Continuation (Higher Probability)
The weight of evidence supports further downside before a sustainable bottom forms:
Technical structure remains bearish with lower highs and lower lows
Price below all major moving averages
Macro environment unfavorable for risk assets
On-chain metrics showing distribution
No bullish divergence on momentum indicators yet
Short Setup:
Entry Zone: 130-140 USD on relief bounces
Stop Loss: Above 148 USD
Target 1: 115-118 USD
Target 2: 105-108 USD
Target 3: 95-100 USD
Secondary Scenario - Accumulation at Support
The 100-115 USD zone represents a high-conviction long opportunity if confirmation signals appear:
This zone was the origin of the November 2024 rally
High volume node from previous accumulation period
Full Fibonacci retracement level
Psychological round number support at 100 USD
Long Setup:
Entry Zone: 100-115 USD
Stop Loss: Below 92 USD
Target 1: 130-135 USD
Target 2: 150-160 USD
Target 3: 180-200 USD
Confirmation Signals Required for Long Entry:
Bullish RSI divergence on daily timeframe
Volume spike on bullish candle at support
Price reclaiming the 20 period moving average
Higher low formation on 4-hour timeframe
Decrease in exchange inflows from whale wallets
Risk Management
Position sizing should not exceed 2-3 percent of portfolio for short setups
Long setups at the 100-115 zone warrant 3-5 percent allocation due to higher conviction
Scale into positions using 3 tranches rather than single entry
Move stop loss to breakeven after first target achieved
Avoid trading the 120-130 USD range without clear directional confirmation
Monitor BITSTAMP:BTCUSD price action as correlation remains high
Invalidation Levels
Bearish thesis invalidated if:
Daily close above 150 USD with increasing volume
Price reclaims 50 and 200 moving averages
RSI breaks above 60 with momentum
Bullish thesis invalidated if:
Daily close below 92 USD
Volume spike on breakdown below 100 USD
Bitcoin breaks below 75000 USD triggering broader market selloff
Timeline Expectations
Short-term (1-4 weeks): Expect continued weakness toward 100-115 USD support zone
Medium-term (1-3 months): Potential basing pattern formation if support holds
Long-term (3-6 months): Recovery rally possible if macro conditions improve and Solana-specific catalysts materialize
Conclusion
COINBASE:SOLUSD is in a clear distribution phase following the November 2024 peak. The technical structure, on-chain metrics, and macro environment all point to further downside before a sustainable bottom forms.
The 100-115 USD zone represents the highest probability accumulation area based on:
Historical significance as the November 2024 breakout origin
Fibonacci full retracement level
High volume node from previous accumulation
Psychological support at 100 USD round number
The recommended approach is patience. Avoid buying at current levels where distribution is occurring. Wait for price to reach the 100-115 USD zone and confirm with bullish divergence and volume signals before establishing long positions.
For traders seeking short exposure, relief bounces to the 130-140 USD zone offer favorable risk-reward entries with defined stops above 148 USD.
This is not financial advice. Always conduct independent research and manage risk appropriately.

Market Phases Explained: Accumulation, Expansion, Distribution🔵 Market Phases Explained: Accumulation, Expansion, Distribution, Reset
Difficulty: 🐳🐳🐳🐳🐋 (Advanced)
Markets do not move randomly. They rotate through repeatable phases driven by liquidity, psychology, and participation. Understanding market phases helps traders stop forcing strategies and start trading in alignment with the current environment.
🔵 WHY MARKET PHASES MATTER
Most traders struggle not because their strategy is bad, but because they apply it in the wrong market phase.
Breakout strategies fail in accumulation
Mean-reversion fails during expansion
Trend-following fails in distribution
Reversal trading fails before reset is complete
Market phases explain when a strategy works, not just how .
Price action, indicators, and volume behave differently in each phase.
🔵 THE FOUR MARKET PHASES
Markets move in a repeating cycle:
Accumulation
Expansion
Distribution
Reset
Each phase has unique characteristics, risks, and opportunities.
🔵 1. ACCUMULATION (QUIET POSITIONING)
Accumulation occurs after a decline or prolonged sideways movement.
This is where smart money builds positions quietly.
Key characteristics:
Price moves sideways in a range
Volatility is low
Breakouts frequently fail
Volume is stable or slightly rising
What is really happening:
Large players accumulate positions without moving price too much. Liquidity is absorbed.
Indicator behavior:
RSI oscillates between 40 and 60
MACD hovers near the zero line
Volume spikes are quickly absorbed
Best strategies:
Range trading
Mean reversion
Patience and preparation
🔵 2. EXPANSION (TREND DEVELOPMENT)
Expansion begins when price breaks out of accumulation with conviction.
This is where trends are born.
Key characteristics:
Strong directional movement
Increasing volatility
Pullbacks are shallow
Breakouts follow through
What is really happening:
Accumulated positions are now leveraged. Momentum attracts participation.
Indicator behavior:
RSI holds trend zones (40–80 or 20–60)
MACD expands away from zero
Volume increases during impulse moves
Best strategies:
Trend-following
Pullback entries
Breakout continuation
🔵 3. DISTRIBUTION (QUIET EXITING)
Distribution occurs after an extended trend.
Price may still rise, but momentum starts to weaken.
Key characteristics:
Higher highs with weaker follow-through
Increased wicks and failed breakouts
Volatility becomes unstable
Late buyers get trapped
What is really happening:
Smart money distributes positions to late participants while maintaining the illusion of strength.
Indicator behavior:
RSI diverges or fails to make new highs
MACD histogram shows lower highs above zero
Volume spikes near highs
Best strategies:
Profit protection
Reduced position size
Waiting for confirmation of weakness
🔵 4. RESET (LIQUIDITY CLEARING)
Reset is when the previous trend fully unwinds.
This phase clears excess leverage and weak hands.
Key characteristics:
Sharp moves against prior trend
Stop-loss cascades
Emotional price action
High volatility without clear direction
What is really happening:
Leverage is flushed. Weak positions are forced out.
Indicator behavior:
RSI reaches extreme levels
MACD crosses zero decisively
Volume spikes dramatically
Best strategies:
Capital preservation
Waiting for stabilization
Avoiding prediction
🔵 HOW TO IDENTIFY THE CURRENT PHASE
Ask these questions:
Is price trending or ranging?
Are breakouts succeeding or failing?
Is momentum expanding or contracting?
Are indicators confirming or diverging?
No indicator works in all phases. Phase identification is the real edge.
🔵 COMMON MISTAKES
Forcing trend strategies during accumulation
Chasing breakouts during distribution
Trading reversals before reset completes
Ignoring momentum deterioration
Most losses come from being right about direction but wrong about phase.
🔵 CONCLUSION
Markets move in cycles because human behavior and liquidity move in cycles.
Accumulation builds positions
Expansion rewards patience
Distribution traps late entries
Reset clears the board
When you learn to identify market phases, you stop fighting the market and start working with it.
Which market phase do you find hardest to trade? Accumulation, expansion, distribution, or reset? Share your thoughts below.

BTC + POWER OF THREE (XAMD)BTC + POWER OF THREE (XAMD)
X + Accumulation + Manipulation + Distribution
X: Reversal or Continuation

Market Update - RUT | BTCThis video looks at the underperformance of RUT compared to the rest of the markets including CRYPTOCAP:BTC where we could see a 50% drop as I compare it to 2021 fractals
We first need to see a pump around $88k and then go from there
TVC:RUT is clearly going through a Distribution phase that will Contract, and this is where we can see the rest of the markets follow through similar to Jan. 2025, and 2021 - 2022 fractal.
Expect stocks like NASDAQ:NVDA to retrace back to the downside, but will see it holdup pretty well
NASDAQ:TSLA on the other hand may see price fall back to its major Demand lvl as it has a few times already.

HOW-TO: Analyze Support, Resistance & Short-Term DirectionHOW-TO: Analyze Support, Resistance & Short-Term Direction Using Volume Scope Pro (1H Example)
Introduction
This HOW-TO explains how to use the Volume Scope Pro — Order Flow Volume Analysis indicator to identify support and resistance, interpret order-flow signals such as absorption and distribution, evaluate buyer/seller strength, and determine a short-term market bias on the 1-hour timeframe.
1 — Chart Settings & Data Inputs
• Main timeframe: 1H
• LTF (Low-Timeframe data): 15-second volume blocks
• LTF coverage: ~115 bars
• Instrument: MES1! (CME Micro E-mini S&P 500)
This setup provides a high-resolution view of order flow behind each hourly candle by aggregating ultra-low timeframe volume behavior.
2 — Buy & Sell Volume Behavior
BUY Side:
• Buy Current Amount ≈ 18.539K
• 20-period Buy Average ≈ 54.044K
→ Buyers are significantly below their normal activity level.
→ Interpretation: Buyers are NOT supporting current price levels.
SELL Side:
• Sell Current Amount ≈ 17.073K
• 20-period Sell Average ≈ 50.857K
→ Sellers are also below average, but buyer weakness is far more pronounced.
Summary:
In higher timeframes like 1H, lack of buyer activity is often more important than strong selling. Here, buyers are too weak to create a sustained bottom.
3 — Trend Angle Convergence & Divergence (Trend θ)
BUY:
• Price vs Buy Volume (3 and 20 periods) = Divergent
→ Price attempts to hold or bounce are NOT backed by buyer aggression.
SELL:
• Price vs Sell Volume (3-period) = Convergent
→ Short-term movement is driven by sellers, strengthening the bearish bias.
4 — Delta Analysis
• Current Delta ≈ +1.46K
• Global Delta (100 candles):
– Positive Δ Sum ≈ 273.812K
– Negative Δ Sum ≈ 225.671K
Interpretation:
Although short-term delta is positive and long-term delta slightly favors buyers, the price structure does NOT reflect bullish dominance.
This type of delta behavior often indicates absorption rather than a trend shift — meaning buyers are active but ineffective at moving price.
5 — Support & Resistance Zones (SR Engine)
Volume Scope Pro identifies two main zones:
• Resistance Zone: 6880.75 ~ 6885.25
• Support Zone: 6707.75 ~ 6766.75
Current Position:
Price is holding inside the upper boundary of the Support Zone.
There was a minor bounce, but the reaction lacked strength and failed to break structural highs.
6 — Order-Flow Overlay Signals (OB / Distribution / Absorption)
• Multiple OB and Distribution labels appear near upper structure → clear signs of supply, selling pressure, and exhaustion at highs.
• OS and ABS signals at support did not result in meaningful continuation → weak follow-through from buyers.
Combined with weak buy volume, the market shows bearish intent.
7 — Short-Term Projection
Given:
✓ Weak buy volume compared to averages
✓ Sellers showing short-term dominance
✓ Converging sell-side angles
✓ Price reacting weakly to support
✓ Strong supply clusters above
✓ Delta showing ineffective buying
→ Short-term bearish continuation is the more probable scenario.
As shown on the chart, the Short Position tool highlights:
• Entry around the upper support boundary
• Stop above the minor pullback high
• Target near the lower support boundary
This forms a clear, structured bearish setup with defined R:R.
Disclaimer
This publication is for educational purposes only. Volume Scope Pro does not guarantee profit or certainty of market direction. Traders must perform independent risk management and verification at all times.

NDQ100 (15M) Bullish Analysis. (SMC)🧩 Market Context
After a strong bearish move marked by a 1H Fair Value Gap (FVG), the market started to show institutional accumulation.
A Change of Character (ChoCh) and a Break of Structure (BOS) confirm a shift to bullish momentum.
The identified Order Block (OB) acts as a key mitigation point supported by a well-defined support zone.
💥 Entry Idea
• Buy: 25,124
• Stop-Loss: 24,979
• Take-Profit: 25,530
• Risk/Reward: 1 : 2.6
After a Fake Out (bearish liquidity trap), price shows strong bullish reaction, indicating institutional intention to mitigate the OB and reach the Buy-Side Liquidity above.
📊 Technical Confirmations
• The SMA starts to act as a dynamic support.
• Rejection from the OB validates structure change.
• The target (25,530) aligns with a distribution zone and liquidity pool, perfect for partial or full take-profit exits.
🧭 Conclusion
Clean structure, strong institutional logic, and confluences in harmony.
This setup illustrates the accumulation → mitigation → distribution sequence, where the market sweeps liquidity before expanding upward.
A perfect example of professional market reading. 🚀
GOOD LUCK TRADERS 🦾🤓✌🏻

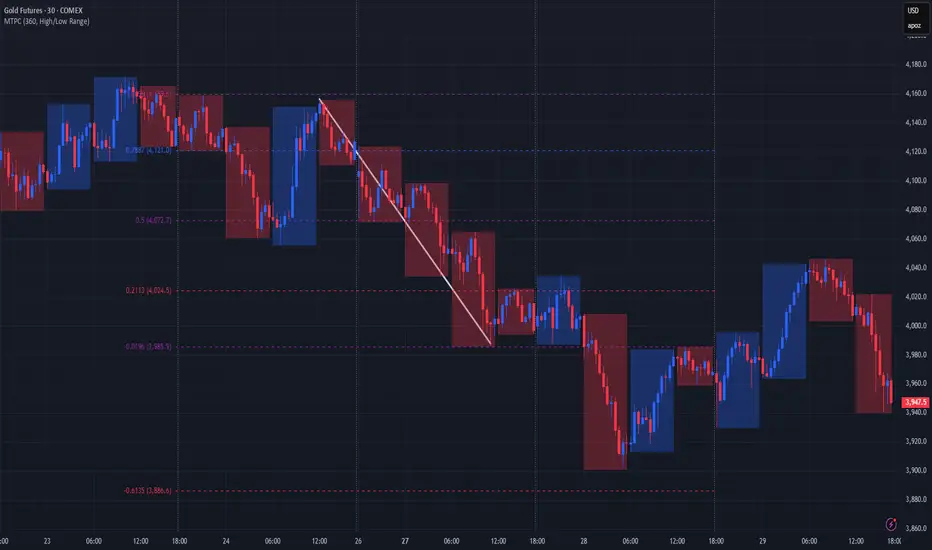
A better alternative to Fibonacci grid🙏🏻 Fibonacci based grid is a great inspiration from the Universe, but imo ain’t the final product, and here it is:
For traders
Use these values above and put em into grid tool here, and you’ll end up with uniform distribution based grid:
1.6134612334371357
1.0196152422706632
0.7886751345948129
0.5
0.21132486540518708
-0.019615242270663247
-0.6134612334371357
Then about how to apply it, you can divide trading activity by analytical units, these are in turn are based on:
^^ by price
^^ by time
^^ by signed volume waves/volume delta
Explanation
If you’ve followed my latest work you know I’ve identified a way to combine higher order moments to construct natural data driven estimates of data’s extremums and “ever possible” values (I still got no idea how no1 Ever posted it anywhere over the last centuries).
Now imagine you got only 2 input values: actual max and min (just like in Fibo grid, it ain’t knows nothing else). Given only these 2 values we can model stuff with uniform distribution that has precisely known values of standardized moments, so we end up with (and remember that uniform distro is symmetric around its mid, so all odd moments are zero):
dev = 1 / math.sqrt(12) //standard deviation
kurt = 1.8 //kurtosis (not excess ofc, the raw one)
hkurt = 27 / 7 //hyperkurtosis, 6th moment, raw af as well
0.5 + dev * hkurt
0.5 + dev * kurt
0.5 + dev
0.5
0.5 - dev
0.5 - dev * kurt
0.5 - dev * hkurt
And the resulting output of it u seen at the beginning of the post, notice how the edges *almost* match your lovely golden ratio.
For wanderers:
Now for the wanderers, creators etc etc etc
We might have a new math constant in our hands.
This can’t be a coincidence that limit levels (the ones at the edges) almost match the golden ratio . What if we find some kind of ‘almost’ uniform distro, where the limit levels would ‘exactly’ match the golden ratio? No problem - Beta distribution with parameters alpha = beta = (smth just a bit greater than 1).
I solved it numerically in python with mpmath library (necessary for high precision stuff, default packages are gonna truncate too much and we work with gamma functions there, high powers, huge numbers).
The following constant used as both parameters for Beta distribution provides us an almost uniform beautiful distro, with a minimal necessary deviation from uniform distro if u pls, just with a lil bit gently smoothed corners, and all connected to fibonacci sequence and golden ratio:
1.013156499304251804283836146883597463164059088989506487984660881392552993230097518061037104047261922219476043198153474114525730243848097530913517155085537693517359999905511951459927003624291626547046737804828112785002512650…
… and it goes on and on. I called it Sagitta constant, because visually it creates that beautiful almost flat shape, the minimal natural curvature. And now if we put this as c in Beta(c, c) following the same levels construction method from before we get these levels:
std = 0.28741741
K = 1.80628205
Hk = 3.88993123
0.5 + std * hk = 1.61803398
0.5 + std * k = 1.01915692
0.5 + std = 0.78741741
0.5 = 0.5
0.5 - std = 0.21258258
0.5 - std * k = -0.01915692
0.5 - std * hk = -0.61803398
Visuals, plots, graphics
^^ here you can see how our resulting distro & derivatives look like, kinda cute aye?
Beta(c, c), where c is our constant Sagitta, actually might be a natural prior for Bayesian stuff, almost a boxcar windowing function for DSP so u gonna tame that famous spectral leakage, or a kernel for KDE, like u name it, every case when u need a uniform shape yet with slightly relaxed endpoints, you can use it in design and architecture.
Go for it bros, test it in your R&D. Maybe some1 gonna use it to prove Riemann assumption conjecture , if u get dat milli send me 25% ima find a good use for it.
∞
Global E-Online | GLBE | Long at $34.55Global-e Online NASDAQ:GLBE provides a direct-to-consumer, cross-border e-commerce platform. It enables merchants to sell internationally and shoppers to buy globally, handling localization, payments, shipping, and logistics for worldwide transactions. Some companies NASDAQ:GLBE handles transactions for include Bath & Body Works, Victoria's Secret, SKIMS, Forever 21, and many more.
Technical Analysis
NASDAQ:GLBE is currently in a consolidation / "share accumulation" phase (i.e. trading sideways, overall), and the price is riding within my selected historical simple moving average. Often, the price will bounce along this area until momentum picks up and then it's off to the races to fill all the open price gaps above on the daily chart. The only concern I have is there is an open price gap on the daily chart near $21 that will likely get filled at some point. However, the earnings and revenue projections, if accurate, may delay this area from being filled for some time.
Revenue and Earnings Growth into 2028
538% earnings-per-share growth expected between 2025 ($0.34) and 2028 ($2.17).
98% revenue growth projected between 2025 ($946 million) and 2028 ($1.87 billion).
www.tradingview.com
Health
Extremely healthy, financially.
Debt-to-Equity: 0x (can't beat that)
Quick Ratio / Ability to Pay Today's Bills: 2.5x (no issues)
Altman's Z-Score/Bankruptcy Risk: 11.6 (extremely low risk)
Action
The projected growth of NASDAQ:GLBE makes sense if there is continued rapid on-boarding of blue-chip clients. There is always the chance other companies, like Shopify, will partner, too. The company is also extremely financially healthy. It should be able to weather the storm in the near-term if there is a financial downturn. That is the only major risk I see here. If the economy flips globally, such companies, regardless of their performance, will get hit hard. However, if the growth is accurate, this is a no-brainer value/growth play. Time will tell.... thus, at $34.55, NASDAQ:GLBE is in a personal buy zone with near-term risks of a drop to $21 or below if the world economy flips.
Targets into 2028
$50.00 (+44.7%)
$60.00 (+73.7%)

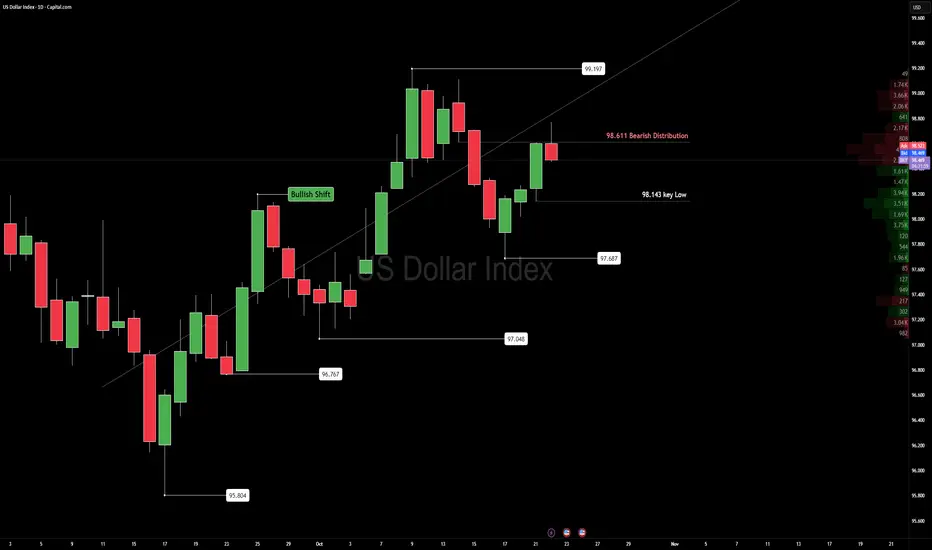
DXY UpdateDXY — Reaction at 98.611 Distribution Zone
The U.S. Dollar Index met firm resistance near 98.611, the same Bearish distribution area that capped momentum last week.
Price remains inside a wide daily range but shows the first sign of cooling after a strong stretch higher.
Below sits 98.143, the line that that changes chart bearish. Until then We are still good.
Acceptance under that level would confirm a structure shift and open space for continued rotation lower.
Upcoming jobless claims and Fed remarks may decide which side gains conviction.
For now, this is a market balancing inventory — not trending, just redistributing.
Trade confirmation, not anticipation.
Key levels:
98.611 — Distribution cap
98.143 — Structural pivot
— Institutional Logic. Modern Technology. Real Freedom.
S&P500 | Mild CrashRisk assets looking to sell off as the stock market tops out around $6,800.
Current price action is only pulling back to test sellers again and we should see a continuation in selling until mid November and hopefully to see a Christmas rally to end the year off.
Since price action awfully looks similar to '24 - '25 Fractal we could say the SPX will look to top next year February/March also considering we're on correction 4 in the Elliott Wave Theory.
Would like to see the S&P bottom out around April - July months of next year at $5,600 if we can continue the bullish parallel trend.

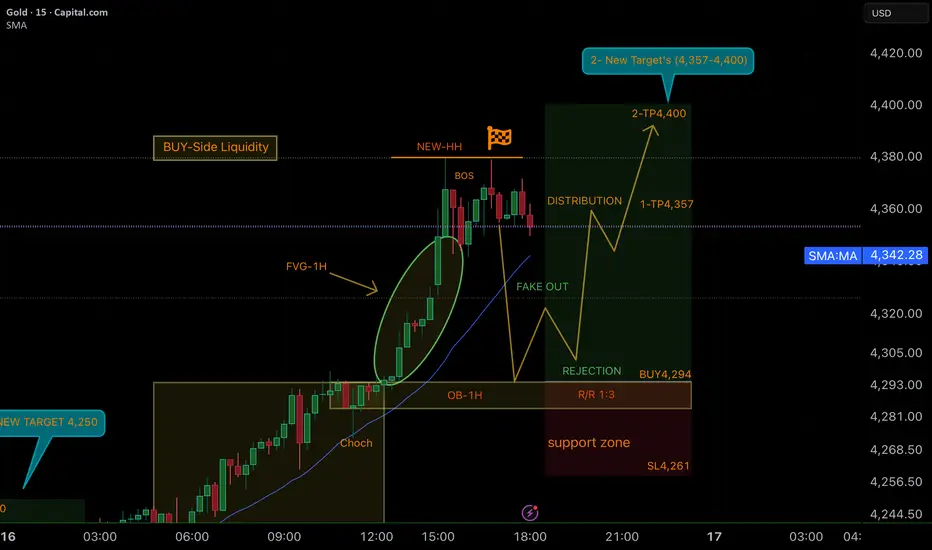
SMART MONEY CONCEPT (SMC)📊 Bullish Analysis XAU/USD (15M)
The market has shown a Change of Character (CHoCH) and respected the 1H Order Block (OB), creating a strong bullish impulse after mitigating the 1H Fair Value Gap (FVG).
Following this move, a Break of Structure (BOS) has occurred, forming a New Higher High (HH), which confirms institutional intention to drive price higher and capture liquidity.
🔑 Projected Scenario
• A possible Fake Out + Rejection around the 4,294 support zone.
• Entry at 4,294 with Stop Loss at 4,261 (Risk/Reward ratio: 1:3).
• First target (TP1) at 4,357.
• Second target (TP2) at 4,400.
📌 Key Takeaways
• Institutions are likely to manipulate liquidity before continuation.
• Patience is required for confirmation at the rejection zone.
• Scaling out profits at TP1 and TP2 gives both security and flexibility in trade management.
✨ Motivational Note
Smart trading is not about predicting; it’s about preparing. Patience and discipline are the strongest weapons of a professional trader. 🚀. GOOD LUCK TRADERS ;)
Oil Crash | $33Price action making another leg down after retesting the breakout ~($68) from the descending triangle
Would like to see a move to $56 then another retest towards the breakout before any major selling.
Overall target for long term swing $33.

ETHFIUSDT → Correction to support consolidation. Rally?BINANCE:ETHFIUSDT is correcting after updating its local maximum to 1.9382. The breakout of the 1.6775 zone is an attempt to start distribution after a long consolidation. Will the bulls hold this zone?
Bitcoin is correcting after a false breakout of resistance. Against this backdrop, the entire cryptocurrency market is declining. However, the trend is bullish and the fundamental background is positive. The end of the correction may resume growth in the market.
ETHFI on the daily timeframe is trying to move into a distribution phase after 5-6 months of consolidation. The trend is upward, and after breaking through resistance, a correction to the liquidity zone of 1.6775 is forming. A false breakdown, a change in market imbalance, and consolidation above 1.6780 could increase buyer interest, which in turn could lead to growth.
Resistance levels: 1.8980, 1.9382
Support levels: 1.6775, 1.5343
The chart shows two key levels - 1.6775 and 1.5343. If the bulls hold their ground above the nearest level of 1.6775, this could lead to a rebound and growth, which in turn would confirm the continuation of the distribution phase. Otherwise, the market may test the POC zone at 1.5343, and liquidity capture may in turn trigger growth.
Best regards, R. Linda!

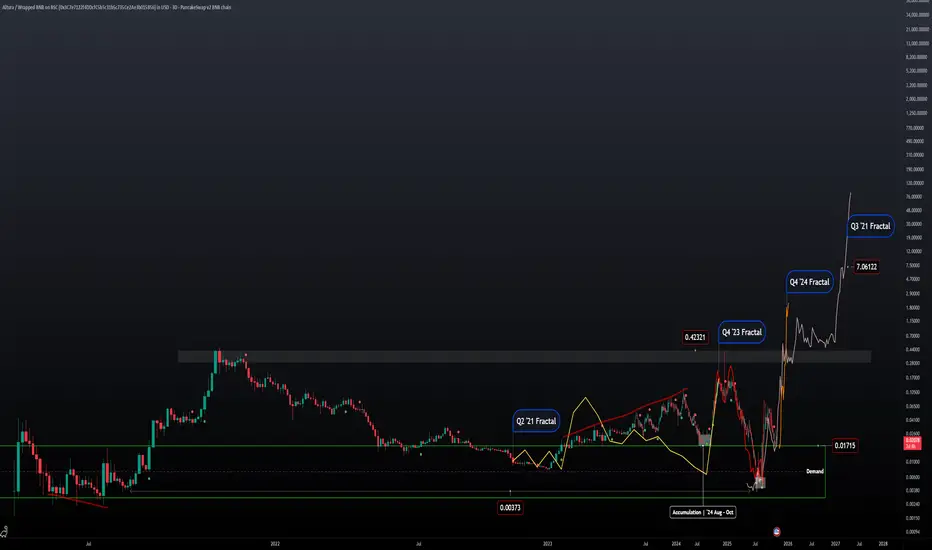
ALU | '21 Fractals | Price Projection Four different fractals with similar results. Q2 '21 price was in convergence and took off in July similarly to price action in '23 -'24. Except price was in divergence and stopped selling off in July and took off in November leaving the middle months for accumulation.
After the expansion phase of the market in '24 price action got tossed into the distribution phase and price was bound to fall to these lows today.
Looking at Q4 '23 Fractal it fits perfectly with what we saw early this year when price was distributing.
Regardless what the news and fundamentals where saying price was able to repeat the same fractal by using the lows of '21.
Q4 '24 Fractal is the most recent pattern that we can reference with todays price action to get a projected estimate.
Current price action has also stopped selling in July and has been accumulating since then
Would like to see price action close at ATHs going into the next year and into the next distribution phase.
Wyckoff Distribution in gold?This count is based on my assumptions so anything can happen not a trading or financial advice just for educational purposes only kindly do your own ta thanks trade with care good luck.
CCO | Distribution Pattern | FractalsLooking ahead we can see the next phase of price action falling into a distribution pattern
Since correction wave 4 buyers took off but seem to be running out of steam. Eventually sellers will have to show what they can do after this trend breaks on a lower timeframe.
Ideal move going forward would focus on short positions only with a local swing target of ~$96 since that was the last area of support
Entries would be somewhere at the Head if using textbook patterns (HnS) or SMR
A confirmation entry to be on the safe side would be after the Breakout Bar indicating a change in trend, and then waiting for the Distribution phase to kick in for more shorting opportunities.
To add confluence to this trade idea we can look back at historical price action and find similar fractals that matches with current price movement
At least two fractals are spotted with the same patterns that are building the same price structure we're in
Elliott Impulse Wave, HnS Pattern, and Distribution Phases.
If buyers are not interested in the local support lvl then liquidity at $76 will be next zone.

GOLD → Consolidation before continued growth FX:XAUUSD is undergoing a correction amid revised unemployment data, but this has not disrupted the overall technical situation. The market is still anticipating an aggressive reduction in interest rates...
The price resumed its growth on Wednesday amid escalating geopolitical tensions and a weakening dollar ahead of the release of US inflation data (PPI). The price is correcting after a record high of $3675, but retains the potential for further growth.
The escalation of the situation in Eastern Europe and the Middle East is increasing demand for safe assets. Expectations of Fed policy easing and a revision of employment data are weighing on the USD.
PPI inflation data: Today's release may temporarily support the USD if the figures exceed forecasts, but the overall trend remains bearish for the dollar.
PPI data is ahead, which may cause short-term volatility, but the long-term bullish trend remains intact.
Support levels: 3640, 3628
Resistance levels: 3657, 3675
Technically, I expect to see a correction from local resistance to the 3645-3640 area, from which growth may continue. A breakout of 3657 could trigger a continuation of the momentum.
Best regards, R. Linda!

UPS: From Delivering Packages to Delivering ValueAs you probably know by now, my strategy consists of finding cheap, deep-value, beaten-up, underdog stocks. This is the strategy I've been using for the last 5 years and that allows me to consistently outperform the S&P 500 by 2x to 3x every year.
This does not guarantee that all my analyses are correct. But if I'm correct 6 or 7 times out of 10, then I'm a rich man!
Now back to UPS!
Over the last 3 years, the stock lost 64% of its value. But... did sales or income decline by the same account? Did margins decline? Did the company decrease its fleet by 60%?
The answer to all these questions is NO, and this is why I think the stock is undervalued.
Yeah, the tariff war and Amazon's slowing of the UPS agreement hurt sales, but these are transient.
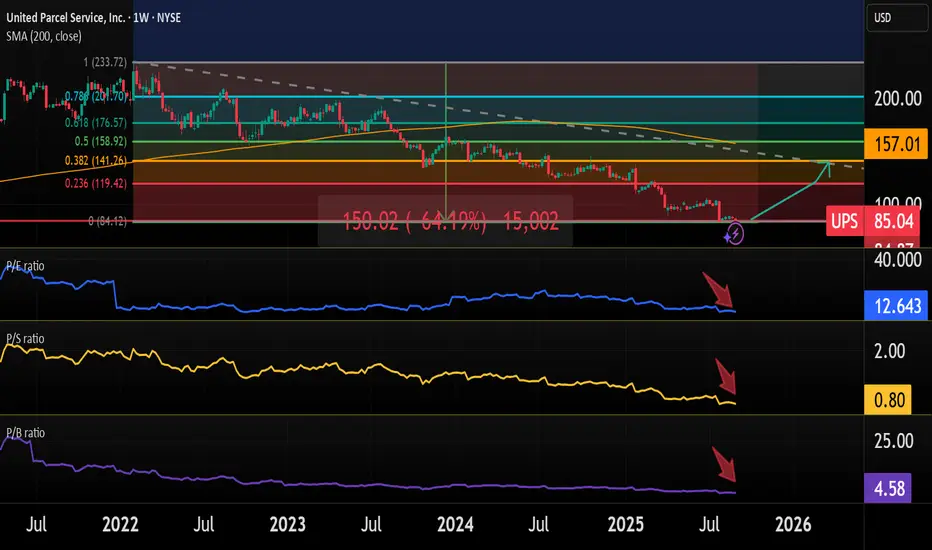
Overview
UPS stock is down 64% since its ATH in 2022.
P/S ratio is at 0.8, the lowest since 2009.
P/E ratio is at 12.6, the lowest in the history of the stock
The P/B ratio is at 4.58, the lowest since 2006.
Dividend yield is at 7.8%.
The CEO recently bought $1 million worth of UPS stock.
This data gives us some clues. The stock is obviously underpriced, despite the fact that UPS is still one of the market leaders and the sales are stable.
Financial performance
Revenue: TTM $90.69 billion (+1.3% YoY); Revenue is improving, but still 10% down since the $100 billion in 2022.
Profitability: Operating margin 9.4% (TTM), net margin 6.4%;
EPS is now at $7.70, which is a similar level to what it was in 2020 and 2021, when the stock price was at $120. However, now the stock price is at $85.
Balance Sheet: Debt $26 billion, debt-to-equity 1.45x, which is totally fine.
Growth prospects
UPS is cutting costs and jobs, targeting $3.5 billion in savings by 2026 via automation/AI (5-7% annual cost reduction).
E-commerce will sustain long-term growth.
The company is innovating with AI-improved routes, self-driving trucks, and drones.
Technical Analysis
The stock price is right above the $85 resistance level, which has been a support/resistance level since 2005.
My target
Considering the prospects, estimates, etc, I can see UPS going to $110 to $130 range in mid-2026, providing an upside of 30% to 40%. This level also aligns with the Fibonacci 0.236 level.
If the stock continues to drop, I will simply average down. I don't think it can drop much more from here, and it will definitely not go bankrupt.
I'm gonna invest approximately 1% of my wealth into this stock.
Remember, I'm just sharing my journey and this is not financial advice! 😎
Seller Strength Evident as Volume Peaks Fail to Propel Price HigAnalysis
Context – This 1D chart uses the ATAI Volume Pressure Analyzer to study the A→B→C structure over the last 11 trading sessions. Segment C→B captures the advance (blue), while B→A captures the subsequent decline (red). Each bar’s up‑ and down‑volume is measured on a lower timeframe to detect buying and selling pressure.
Volume ranking – Within this 11‑bar window, the indicator identifies the three largest buying (B1–B3) and selling (S1–S3) bars. Although the B1 bar shows the highest buying volume (~10.29 M units), its selling volume (~12.52 M) exceeds buying, resulting in a negative delta of ‑2.23 M. B2 is the only buyer bar with a positive delta (+1.87 M), while B3 again shows sellers in control (‑0.90 M). The seller bars S1–S3 all display net negative deltas, with S3 registering the heaviest selling (‑4.03 M). This pattern shows that peaks in buying volume are not producing higher closes and that sellers are consistently overwhelming buyers.
Segment behaviour – The C→B segment (the rally) totals approximately +28.9 M up‑volume versus +36.7 M down‑volume, a net deficit of about ‑7.74 M. The subsequent decline (B→A) is even more one‑sided: +26.9 M up‑volume versus +41.4 M down‑volume, yielding a ‑14.5 M delta. The slopes of the segment trend lines reinforce this narrative: the rise from C to B has a shallow positive slope (~ 5° on the upper line), whereas the decline from B to A has a steeper negative slope (‑12° on the upper line). Sellers are pushing the price lower more aggressively than buyers previously pushed it higher.
Price structure – Price currently trades near TRY 3.45,where resistance resides near the recent pivot highs around TRY 3.65 and TRY 3.73 (where B1 and S1 occur). As long as the price remains below these levels and buying peaks fail to translate into higher highs, the bearish bias remains. The red dashed line is not a fixed support; it dynamically connects the lows of the current C→A leg and updates with each new candle’s low. Its red colour confirms the bearish slope of this segment. As long as this guide remains red and slopes downward, the downtrend is intact. A meaningful sign of shifting momentum would be a flattening or reversal of this guide (e.g., changing colour) accompanied by a new B‑ranked bar that shows a positive delta.
Risk management – This analysis is provided for educational purposes and does not constitute investment advice. Always consider your own risk tolerance and trading plan before entering a position.

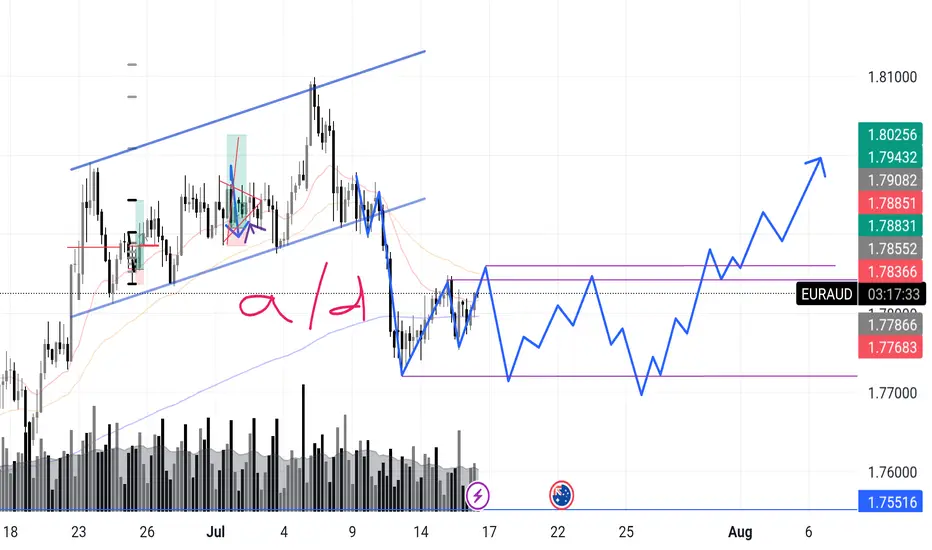
EURAUD – Incoming Upthrust? Accumulation or Distribution? Chart Context:
EURAUD recently completed a sharp markdown after a textbook rising channel break. What’s interesting now is that price has entered what looks like a potential box range between 1.7768 and 1.7885.
I'm anticipating a possible upthrust move into the 1.788x zone — and what follows will reveal the true intent.
Here’s the internal debate:
Are we looking at reaccumulation — smart money trapping shorts before driving higher in line with broader money flow?
Or is this a distribution — where the market builds a false sense of support before deeper downside?
🔍 What tips the scale for now is this:
>The overall money flow direction (via volume patterns + structure) has leaned bullish, so I’m favoring accumulation with a shakeout scenario.
Signs I’m watching:
✅ Absorption volume near the bottom of the range
✅ Higher lows inside the zone
✅ Fake breakout / upthrust into prior structure
❌ Failure to hold above 1.7855 could flip the bias short-term
📉 Expecting one more dip to test demand, followed by range tightening, and if buyers show up strong — the breakout can get explosive.
What’s your take?
Are we prepping for a markup or will this fakeout and roll over?
"I go long or short as close as I can to the danger point, and if the danger becomes real, I close out and take a small loss"
July 15 2025 -Sell Limit ActivatedGood day, folks!
Just sharing another learning from my ideas here:
EURUSD has been in a bearish structure since July 14, 2025 (1H Intraday). As you know, I always look for clear supply or demand validation before placing a sell or buy limit order. On the chart, you can see a valid supply zone that was generated on Monday. After that, I waited for a clear move during the Tuesday London and New York sessions, with the CPI news release acting as a catalyst for more volatility. The trade came to fruition during the New York session on Tuesday. (See chart for the complete breakdown of the movement and entry.)
RR: 1:3
Another Wyckoff schematics and structure analysis.
