Al Rajhi Bank Weekly Technical Analysis: Bullish Setup in PlayTADAWUL:1120 (Al Rajhi Bank) — Weekly Technical Setup
Price is moving in ascending channel and currently reacting at the 0.786 retracement area. It is holding above the 55 Fibonacci EMA on the weekly timeframe, which has historically acted as dynamic support. Buy 2 is set near channel support and the rising trendline for a better average if price dips first.
RSI is fully in sync — no red flags there. Seasonality also leans bullish for December historically. The conservative stop is placed below major horizontal support that previously acted as resistance, while the aggressive stop sits below the trendline zone.
TP1 is aligned with recent major resistance. Further targets are based on the AB=CD harmonic projection and potential continuation if price eventually breaks the channel top. Fundamentally, this is one of the strongest banks in Saudi, showing steady earnings and solid financial performance over time.
Recommended Levels:
• Buy 1: 96.00 (CMP)
• Buy 2: 92.90
• Stop Loss: Closing below 88.00
• Take Profit 1: 108
• Take Profit 2: 116
• Take Profit 3: 124 / Ride the trend with a trailing stop
Potential remains strong as long as price sustains above the major horizontal zone.
Tadawul

8060 Weekly Technical Analysis: Bullish Setup in Play8060 (Walaa Cooperative Insurance Co.)
Price reacted strongly from a major weekly support, accompanied by a clear bullish divergence on the weekly RSI. Price has also given a downward trendline breakout, improving the short- to medium-term structure.
A bullish harmonic AB=CD pattern is in play, adding pattern confluence at the support zone. Buy 2 is placed lower to allow for a healthier average in case of a pullback, while risk is clearly defined on a closing basis below the key support.
Recommended Levels:
Buy 1: 11.60 (CMP)
Buy 2: 11.20
Stop Loss: Closing below 9.80
Take Profit 1: 13.00
Take Profit 2: 16.00
Take Profit 3: 22.20 / Ride the trend with a trailing stop
Potential remains intact as long as price sustains above the weekly support.

BUY 4162One of the trades among the 7 trades I shared to my clients is on 4162 which you also can take.
The price gave us a reversal and a confirmation, so you can now ride in the current price and target 61.90.
Follow for more trades in the future days!

TASI IS BACKAs you all have read recently about the changes made in tadawul, the price now started to get back to its normal course.
And for that we decided to take so many trades we've been waiting for for the past years!
Follow for more!

2380 Technical Analysis: Bullish Setup in Play2380 (Rabigh Refining & Petrochemical Co.)
Price is sitting at a major monthly support. A bullish harmonic Bat has formed near this zone, and price has given a falling wedge breakout, creating strong pattern confluence. RSI shows bullish divergence, adding momentum confirmation.
Buy 2 is placed lower to average in on a healthy dip. Stop loss is defined on a closing basis below 6.30 to manage risk.
Recommended Levels:
Buy 1: 6.84 (CMP)
Buy 2: 6.65
Stop Loss: Closing below 6.30
Take Profit 1: 7.50
Take Profit 2: 8.00
Take Profit 3: Ride the trend with a trailing stop
Potential remains as long as price sustains above the monthly support. Happy trading!

2020 IS ABOUT TO TEACH EVERYONE A LESSON HERE2020 has just started its bearish movement, so if you think you will recover by buying more shares YOU ARE WRONG, YOU ARE JUST PUTTING YOURSELF IN MORE LOSSES YOU CAN'T AFFORD.
As you see on the chart, the price grabbed the LQ and gave us a clean revesal in the level where I placed the circle, and now it is pushing down to grab the LQ at 112.6 to continue pushing lower.
So before you get stuck in more losses you sell everything and you wait for the price to give you a clear entry to take.
If you got any questions, don't hesitate to ask!
Follow for more so you don't miss any updates I'm posting!

2222 IS STILL PUNISHING YOUAs you can notice on the chart, 2222 is still pushing lower, and you might be holding some shares on it while you're reading this.
As you can see on the chart, the price made a reversal at the point I placed a circle on after catching LQ and filling the gaps, now it is still pushing lower to reach 23.18 at least before coming higher again.
So for now YOU CANT BUY ARAMCO, and if you're holding any shares, you'd better sell while you're not in larger losses and wait for the price to give you a new entry point.
For any questions, don't hesitate to ask!
Follow for more.

1120 STOCK IS TAKING TAKING YOU TO BANKRUPCYAs you can see on the chart, the price is still pushing lower after the massive gap it made that caught everyone's eyes to buy.
NOW WHAT? YOU ARE IN LOSSES AND YOU WANT TO RECOVER!
YEs that's the case with all the traders who have bought on 1120, and I want to tell you that it's still crashing lower and lower to reach at least 90.15 before deciding what the next move is.
If you got any questions, don't hesitate to ask!
Follow for more.

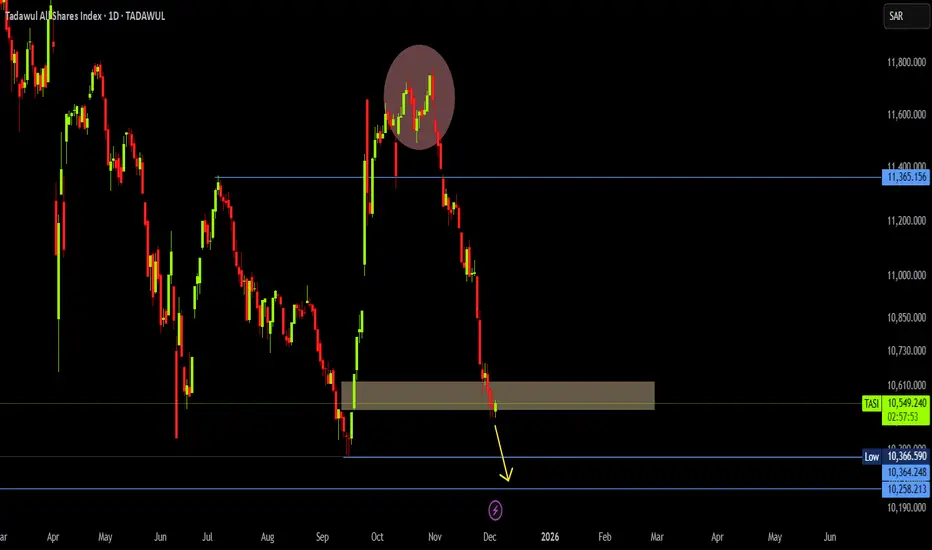
TASI IS STILL FALLING DOWNDear Saudi Traders,
Been a long time since I last posted about saudi market, now I'm back with the lates updates on the markets since I seen some people saying to buy some particular stocks.
First of all TASI is falling down, so there's nothing to do, and it will keep falling for the next following monts, we'll expect it to start rising in the 2nd Q of 2026. But for now there's nothing to make on the market, every position you take will end up in losses.
As you can see on the chart, the price will drop to 10,258.213 at least before reversing to come higher.
So for now hold your funds, and don't buy. Once I see something positive on the market I'll be the first to post about it.
Follow so you won't miss any updates!
2084 (Miahona Co.) – Technical OutlookPrice is moving sideways between two key zones:
• Resistance at 26.40–25.80
• Support at 22.20–21.60
It is currently sitting right on the horizontal support.
For any short-term buy, the first condition is a clean break of the downward trendline. Only then does the upside open back toward the 25.80–26.40 resistance zone. Until that break happens, the overall structure remains sideways.
A confirmed bullish trend requires a strong close above 26 with solid volume. Anything inside the box is just consolidation and range trading.
A bullish harmonic XABCD is also present, and price can still drift down toward the upward trendline, which may complete the D point. As long as the downward trendline holds, the bias leans bearish. Even if it breaks, the upside remains short-term capped at the top of the range.
Price has historically respected the FIB EMA 21 and EMA 20, and it is currently trading below both, adding more bearish weight. RSI is neutral — no divergence observed.
Fundamentally, the stock remains weak — negative EPS, gross profit, operating income, net profits, and cash flows in the previous quarter.

Update on 2382 Technical Analysis
TADAWUL:2382 Stop loss trailed to 15 (closing basis). Price action confirms a new higher high and higher low, marking the start of a potential bullish trend. Structure remains intact within the ascending channel, and a recent golden cross further strengthens the setup.
There’s mild bearish divergence on RSI, but it hasn’t translated into any real weakness yet. Bias stays bullish as long as price holds above the previous higher low — a close below it would be the first sign of short-term change in structure.

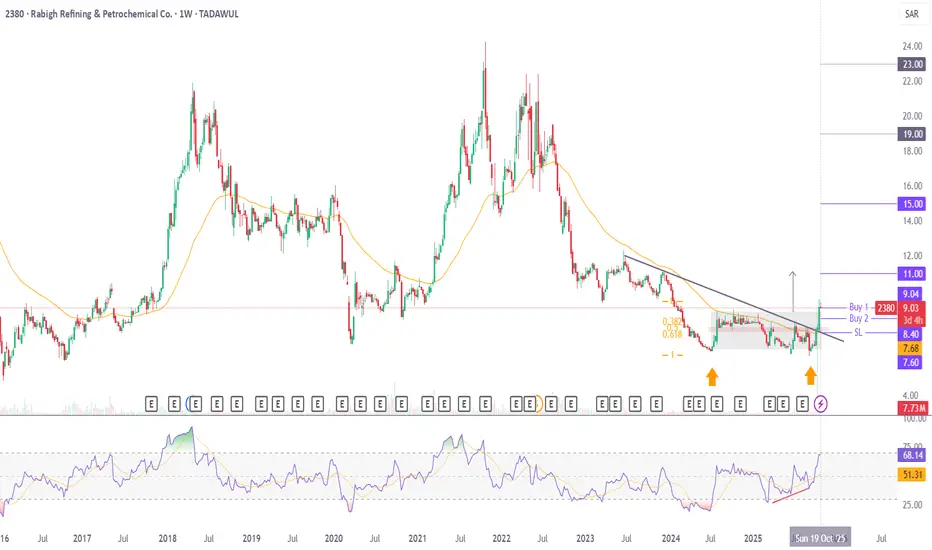
2380 Technical Analysis: Weekly Bullish Breakout in Play2380 (Rabigh Refining & Petrochemical Co.)
Price has broken out of a bullish rectangle pattern on the weekly timeframe, supported by bullish divergence and strong volume. On the monthly chart, it has formed a double bottom and hidden bullish divergence, while continuing to move within a long-term range between 26 and 6 since 2009.
Price is trading above the 55 Fibonacci EMA on the weekly chart — a level it has historically respected as dynamic support and resistance. It has also given a breakout from the daily trendline, further strengthening the bullish structure.
Buy 2 is positioned lower in case of a healthy pullback for a stronger average. TP1 aligns with the rectangle projection, while sustained momentum could open room for price to extend toward 15, 19 and 23.
Recommended Levels:
Buy 1: 9.04 (CMP)
Buy 2: 8.40
Stop Loss: Closing below 7.60
Take Profit 1: 11.00
Take Profit 2: 15.00
Take Profit 3: Ride the trend with a trailing stop
Financially, the stock isn’t too strong — only free cash flow from operating activities and overall FCF remain positive on a quarterly basis.
Potential remains strong technically as long as price sustains above the 55 EMA. Happy trading!
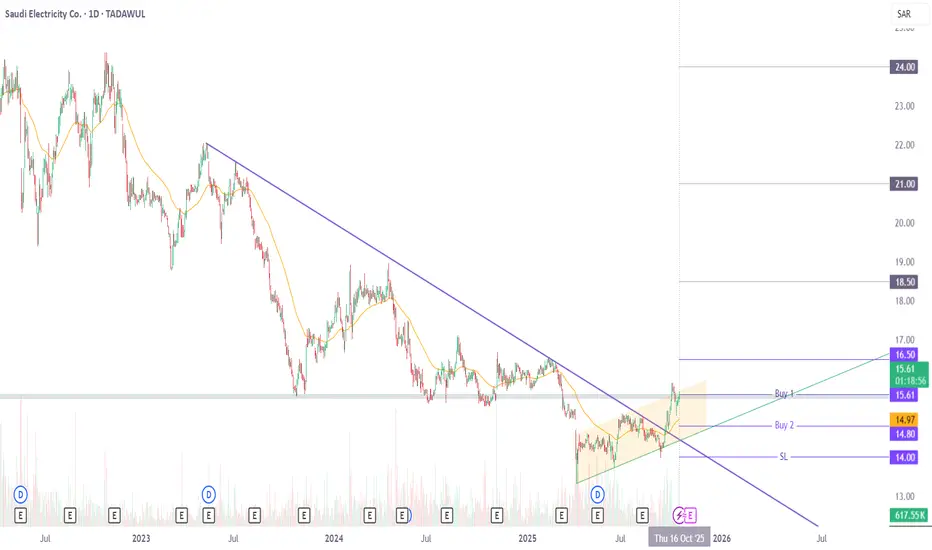
5110 Technical Analysis: Bullish Setup in Play5110 (Saudi Electricity Co.)
Price is trading above the 55 Fib EMA on the daily timeframe, a level it has historically respected as dynamic support and resistance. It is also trading above a rising trendline and has broken out from a long-term falling trendline, moving now within an ascending channel. Recently, price gave a strong close above a key horizontal support zone, reinforcing the bullish structure. RSI is also in sync with the setup.
On the fundamental side, the stock has shown positive growth in revenue, gross profit, operating income, net income, and EPS over past quarters, supporting the bullish technical outlook.
Buy 2 is positioned lower in case of a healthy pullback for a stronger average. TP1 and TP2 are aligned with near-term resistances, while sustained momentum beyond TP1 opens room for price to extend toward 18.5, 21, and 24. Stop loss is set below 14.00 on a closing basis to define risk.
Recommended Levels:
Buy 1: 15.61 (CMP)
Buy 2: 14.80
Stop Loss: Closing below 14.00
Take Profit 1: 16.50
Take Profit 2: 18.50
Take Profit 3: Ride the trend with a trailing stop
Potential upside remains as long as price sustains above the rising trendline, and 55 Fib EMA. Happy trading!
2083 Technical Analysis: Breakout with Bullish ABCD Formation2083 (Power and Water Utility Company for Jubail and Yanbu – Marafiq)
Price has given a breakout from a long-term downward trendline with strong volume and a solid candle close above it, confirming the breakout strength. It has also formed a falling wedge and a bullish ABCD pattern near the breakout level. Price is trading above the 50 EMA and the 89 Fibonacci EMA(which has historically acted as dynamic support and resistance).
Buy 2 is positioned lower in case of a healthy pullback for a stronger average. Targets are aligned with recent resistance levels. If price sustains momentum and closes beyond TP2 with strong volume, potential upside could extend toward 64, 74, and ultimately 86 near the all-time high. A trailing stop is recommended to protect gains.
Recommended Levels:
Buy 1: 44.50 (CMP)
Buy 2: 40.00
Stop Loss: Closing below 36.00
Take Profit 1: 50.00
Take Profit 2: 56.00
Take Profit 3: Ride the trend with a trailing stop
Potential remains strong as long as price sustains above the breakout zone and the 89 EMA. Happy trading!

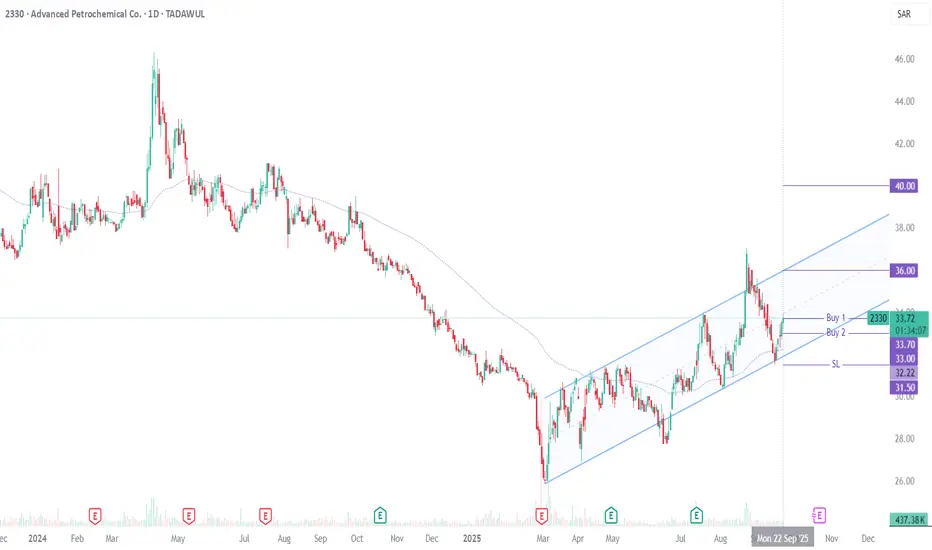
2330 Technical & Fundamental Analysis: Bullish Setup in Play2330 (Advanced Petrochemical Co.)
Technically, the stock is trading within an ascending channel and recently bounced from it support, offering an attractive risk-to-reward opportunity. The structure favors continuation toward the channel resistance at 36–37, which also aligns with the previous higher high. Price is also trading above the 89 EMA, a level it has historically respected, with RSI in sync to support the bullish momentum.
On the fundamental side, Advanced Petrochemical has delivered strong results over the past two quarters — showing growth in gross profit, operating income, and net margin, while maintaining a healthy free cash flow. This reinforces the bullish technical picture.
Recommended Levels:
Buy 1: 33.70 (CMP)
Buy 2: 33.00
Stop Loss: Closing below 31.50
Take Profit 1: 36.00–37.00 (channel resistance / previous HH)
Take Profit 2: 40.00
Take Profit 3: Ride the trend with a trailing stop
As long as price respects the ascending channel and fundamentals continue to support momentum, upside potential remains intact.
4040 Technical Analysis: Double Bottom + weekly divergence4040 (Saudi Public Transport Co.)
Price has bounced from a key weekly support zone, forming a double bottom with strong bullish divergence on the weekly timeframe. On the daily chart, it has broken out of a downward trendline and successfully retested it, reinforcing the bullish outlook.
The first buy is at CMP, with Buy 2 positioned lower to average in case of a pullback. TP1 and TP2 are aligned with near-term resistances, while sustained momentum beyond TP2 opens room to ride the trend with a trailing stop. Stop loss is placed below 12.00 on a closing basis to define risk.
Recommended Levels:
Buy 1: 13.35 (CMP)
Buy 2: 13.00
Stop Loss: Closing below 12.00
Take Profit 1: 14.90
Take Profit 2: 16.90
Take Profit 3: Ride the trend with a trailing stop
Potential upside remains as long as price sustains above the weekly support. Happy trading!

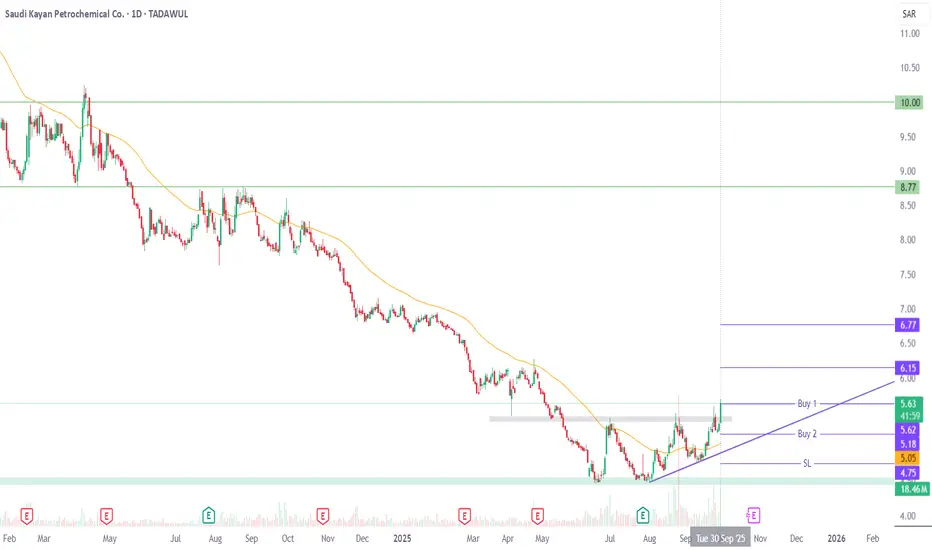
2350 Technical Analysis: Breakout with Weekly Bullish Signals2350 (Saudi Kayan Petrochemical Co.)
Price has broken out above the previous high, which had also been a major resistance level since May. It is trading above the 55 Fibonacci EMA, a level that has historically served as dynamic support.
On the weekly timeframe, price has broken out of a falling wedge, confirmed a double bottom, and printed bullish divergence — all of which strengthen the bullish outlook.
The first buy is at CMP, with Buy 2 positioned lower to average in on a pullback. TP1 and TP2 are aligned with near-term resistances, while sustained momentum beyond TP2 opens room for price to extend toward 8.77 and even 10. Stop loss is set below 4.75 on a closing basis to define risk.
Recommended Levels:
Buy 1: 5.62 (CMP)
Buy 2: 5.18
Stop Loss: Closing below 4.75
Take Profit 1: 6.15
Take Profit 2: 6.77
Take Profit 3: Ride the trend with a trailing stop
Potential upside remains as long as momentum sustains above the breakout zone and 55 EMA. Happy trading!
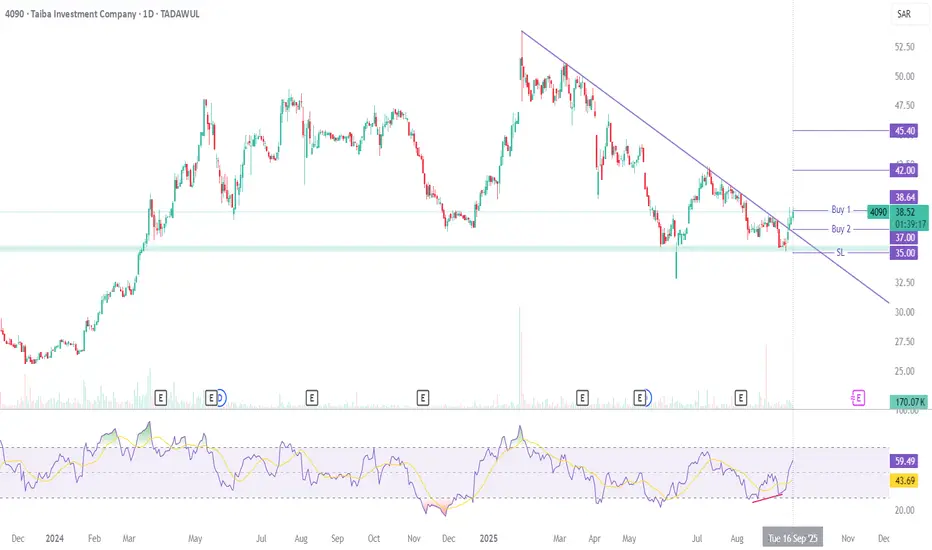
4090 Technical Analysis: Bullish Setup in Play4090 (Taiba Investment Company)
Price bounced from strong weekly support, followed by a breakout from the downward trendline. A bullish divergence on RSI, along with a classic “Three White Soldiers” pattern, reinforces the bullish outlook.
The first buy is positioned at CMP, with Buy 2 placed in case of a healthy dip to secure a stronger average. Risk is managed with a stop below weekly support at 35, while profit targets aim to capture the next leg of upside momentum.
Recommended Levels:
Buy 1: 38.64 (CMP)
Buy 2: 37.00
Stop Loss: Closing below 35
Take Profit 1: 42.00
Take Profit 2: 45.40
Potential upside remains as long as weekly support holds. Happy trading!
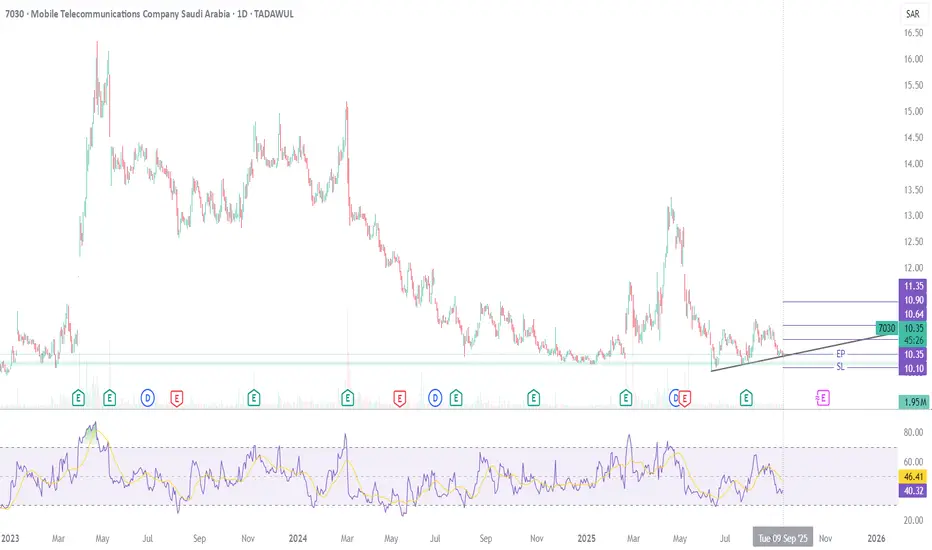
7030 Technical Analysis: Bullish Setup in Play7030 (Mobile Telecommunications Company Saudi Arabia) — Technical Take
Price is currently trading at the rising trendline and holding firmly above the horizontal weekly support. This structure keeps the bullish bias intact. The stop loss is set below this support as well as the last higher low, ensuring that the trade remains valid only if the trend structure holds.
Recommended Levels:
Entry Point: 10.35 (CMP)
Stop Loss: Closing below 10.10
Take Profit 1: 10.64
Take Profit 2: 10.90
Take Profit 3: 11.35 (if strong closing above 10.90)
Potential upside remains if support continues to hold. Happy trading!
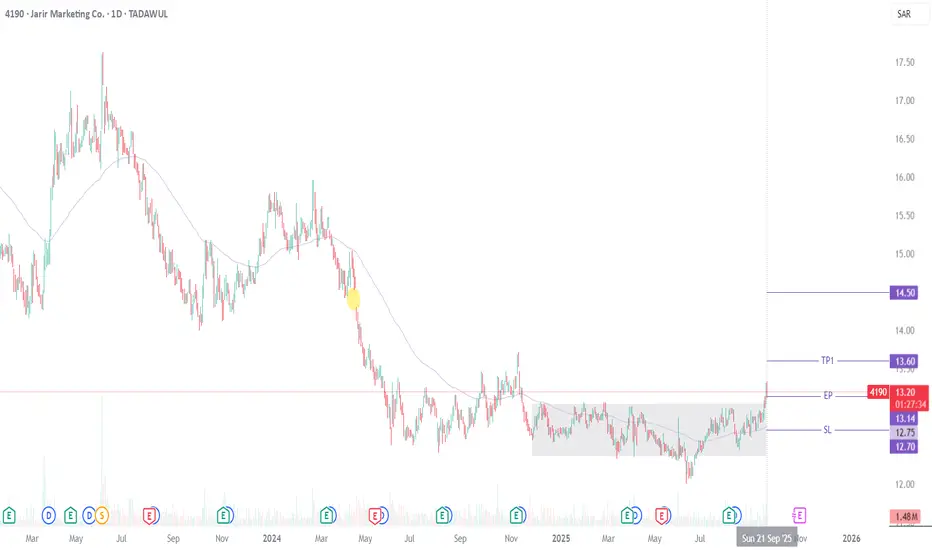
4190 Technical Analysis: Breakout with Gap-Fill Potential4190 (Jarir Marketing Co.)
Price has broken out of a consolidation range that extended from December 2024. It is trading above the 89 EMA — a level it has historically respected, reinforcing the bullish structure. RSI is also in sync with the move, adding further confirmation.
If price reaches TP1, there is a strong likelihood it will attempt to fill the previous gap down, aligning with TP2. The stop loss is set below the 89 EMA at 12.70 on a closing basis, while traders may consider scaling the stop upward as the trend progresses.
Recommended Levels:
Buy: 13.14 (CMP)
Stop Loss: Closing below 12.70
Take Profit 1: 13.60
Take Profit 2: 14.50
Take Profit 3: Ride the trend with a trailing stop
Potential upside remains as long as price sustains above the breakout zone and the 89 EMA. Happy trading!
1150 IS PUSHING LOWERBack in January, I posted to buy 1150, but the market managed to take the opposite direction tp come lower and lower due to the conditions we currently have.
Now the price is pushing towards the level 24.24, we'll see how it will act around the level, but probably it will break through it and reach the next level at 21.92.
So for now don't buy anything on 1150.
Meanwhile, there's a golden opportunity for those who wants to learn how to trade Saudi Market, since it is in a level where you have all the possible configuration you'll face while running low.
Let me know if you got further questions!

2010 WILL GO FURTHER LOWER2 Months ago, I posted that 2010 will go lower but some of you didn'tlisted and contacted me saying that it won't. As usual, time proves who's right and who's wrong.
Now as you can notice on the chart, the price reached the point I told you and went further lower, now we're looking for it to reach 49.60.
DON'T BUY FOR NOW!
Meanwhile, there's a golden opportunity for those who wants to learn how to trade Saudi Market, since it is in a level where you have all the possible configuration you'll face while running low.
Let me know if you got further questions!

A TRADE WE'RE HOLDING We've been holding this trade on 2040 for a month now in which we're doing great so far despite the Market slow movement.
The entry on this trade is based on liquidity and market gaps in case you wondered!
Meanwhile, there's a golden opportunity for those who wants to learn how to trade Saudi Market, since it is in a level where you have all the possible configuration you'll face while running low.
Let me know if you got further questions!
