1120: Buy idea: Spring effectOn 1120 we have a very good spring effect on the vwap indicator and this means that we would have a high probability of seeing the market go up.
Next report date
—
Report period
—
EPS estimate
—
Revenue estimate
—
4.0SAR
15.80 BSAR
50.05 BSAR
3.91 B
About AL RAJHI BANK
Sector
Industry
CEO
Walid bin Abdullah Ali Al-Moqbel
Website
Headquarters
Riyadh
Employees (FY)
20.88 K
Founded
1957
ISIN
SA0007879113
FIGI
BBG000FBK1L0
Al Rajhi Bank engages in the provision of banking, financing, and investment services. It operates through the following segments: Retail, Corporate, Treasury, and Investment Services Brokerage, and Other. The Retail segment includes individual customer deposits, credit facilities, customer debit current accounts, fees from banking services and remittance business. The Corporate segment incorporates deposits, corporate customer deposits, corporate credit facilities, and debit current accounts. The Treasury segment provides treasury services and portfolios. The Investment Services and Brokerage, and Other segments incorporate investments of individuals and corporate in mutual funds, local and international share trading services, and investment portfolios. The company was founded in 1957 and is headquartered in Riyadh, Saudi Arabia.

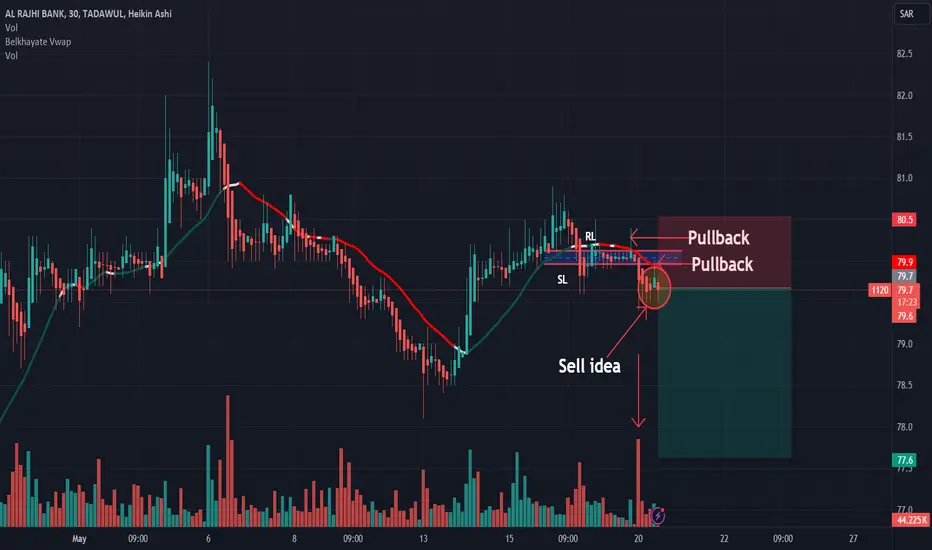
1120: Pullback: Sell ideaOn 1120 after the breakout of the vwap indicator as you can see on the chart we have a pullback on the vwap and this means that we have a high probability of seeing the market go down.

A technical look at Al Rajhi Bank stock After the price broke its historical peak Al Rajhi Bank shares are preparing for a correctional journey with prices that are very suitable for those who are ready to invest in this bank.
Orange levels are very good to buy the stock. TADAWUL:1120

YOU STILL CAN'T BUY 1120Dear Saudi traders,
Last week I posted that you can't buy 1120 since it still going down, and here it is.
For now there's no point of buyin 1120, instead, you can check the other markets where you have the opportunity to buy.
For further questions don't hesitate to ask!

1120: Sell ideaSell idea on 1120 as you see on the chart because we have two pullback on vwap and also we have the breakout of the support line.Thanks!
DON'T BUY 1120On 1120 as you can see on the chart, the market came up to fill the imbalance we had and now it's continuing its way down towards the level 71.2.
Don't waste your money on stocks that are obviously going down, there are other stocks in which you still can put your money in and come with profits.
T

1120 AL RAJHI BANKTHIS MONEY IT JUST NEED MORE TIME TO DEVELOP.
This is just my technical opinion and may be more incorrect than correct. It is not considered investment advice

al rajhi bank oscillatingal rajhi bank is not showing any interest in neither moving up nor down so wait for things that could help to make a decision

DON'T BUY 1120Dear Saudi Traders and Investors,
I'm sharing with you some of the stocks you can't buy currently since you will lose your money if you do so.
Here on 1120 as you can see, the stock is consolidating in between the strong levels 90.5 and 81.3, for now you can't do anything unless the price crosses on

1120 IS CONSOLIDATINGDear Saudi Traders and Investors, it's been a while since I last posted.
Today I'm sharing with you this analysis since I got asked by some of you and my private community members about A BUYING opportunity on 1120.
You can see on the chart that 1120 is currently consolidating for the last 2 monts,

See all ideas
An aggregate view of professional's ratings.
Trade directly on the supercharts through our supported, fully-verified and user-reviewed brokers.


Frequently Asked Questions
The current price of 1120 is 83.5 SAR — it has decreased by 1.07% in the past 24 hours. Watch AL RAJHI BANK stock price performance more closely on the chart.
Depending on the exchange, the stock ticker may vary. For instance, on TADAWUL exchange AL RAJHI BANK stocks are traded under the ticker 1120.
1120 stock has risen by 0.60% compared to the previous week, the month change is a 3.47% rise, over the last year AL RAJHI BANK has showed a 11.19% increase.
We've gathered analysts' opinions on AL RAJHI BANK future price: according to them, 1120 price has a max estimate of 102.00 SAR and a min estimate of 66.70 SAR. Watch 1120 chart and read a more detailed AL RAJHI BANK stock forecast: see what analysts think of AL RAJHI BANK and suggest that you do with its stocks.
1120 reached its all-time high on May 9, 2022 with the price of 117.4 SAR, and its all-time low was 4.2 SAR and was reached on Mar 3, 1999. View more price dynamics on 1120 chart.
See other stocks reaching their highest and lowest prices.
See other stocks reaching their highest and lowest prices.
1120 stock is 1.56% volatile and has beta coefficient of 1.55. Track AL RAJHI BANK stock price on the chart and check out the list of the most volatile stocks — is AL RAJHI BANK there?
Today AL RAJHI BANK has the market capitalization of 334.00 B, it has increased by 0.48% over the last week.
Yes, you can track AL RAJHI BANK financials in yearly and quarterly reports right on TradingView.
AL RAJHI BANK is going to release the next earnings report on Jul 26, 2024. Keep track of upcoming events with our Earnings Calendar.
1120 earnings for the last quarter are 1.05 SAR per share, whereas the estimation was 1.07 SAR resulting in a −1.74% surprise. The estimated earnings for the next quarter are 1.06 SAR per share. See more details about AL RAJHI BANK earnings.
AL RAJHI BANK revenue for the last quarter amounts to 7.23 B SAR, despite the estimated figure of 7.21 B SAR. In the next quarter, revenue is expected to reach 7.34 B SAR.
1120 net income for the last quarter is 4.19 B SAR, while the quarter before that showed 3.98 B SAR of net income which accounts for 5.37% change. Track more AL RAJHI BANK financial stats to get the full picture.
AL RAJHI BANK dividend yield was 2.64% in 2023, and payout ratio reached 58.23%. The year before the numbers were 1.66% and 29.49% correspondingly. See high-dividend stocks and find more opportunities for your portfolio.
As of Jul 27, 2024, the company has 20.88 K employees. See our rating of the largest employees — is AL RAJHI BANK on this list?
Like other stocks, 1120 shares are traded on stock exchanges, e.g. Nasdaq, Nyse, Euronext, and the easiest way to buy them is through an online stock broker. To do this, you need to open an account and follow a broker's procedures, then start trading. You can trade AL RAJHI BANK stock right from TradingView charts — choose your broker and connect to your account.
Investing in stocks requires a comprehensive research: you should carefully study all the available data, e.g. company's financials, related news, and its technical analysis. So AL RAJHI BANK technincal analysis shows the buy rating today, and its 1 week rating is buy. Since market conditions are prone to changes, it's worth looking a bit further into the future — according to the 1 month rating AL RAJHI BANK stock shows the strong buy signal. See more of AL RAJHI BANK technicals for a more comprehensive analysis.
If you're still not sure, try looking for inspiration in our curated watchlists.
If you're still not sure, try looking for inspiration in our curated watchlists.